What’s New in Rider
Rider 2020.2 delivers some highly requested features, such as the Localization Manager and Shader support in our Unity integration. We’ve completely reworked the Unit Test Runner and the debugger API to make them faster, more powerful, and more stable. This release also includes better C# support, Data Breakpoints, and full support for GitHub pull requests.
Debugger
New Debugger API
The new release comes with the new debugger API which has been largely rewritten. This is not noticeable from the UI, but it allows more features to come and allows plugins to hook into the debugging process as never before. This includes improved super-lazy value calculations with better interruption and custom value representations. The only thing noticeable from the outside is that debugger tool windows show the correct icons for all variables.
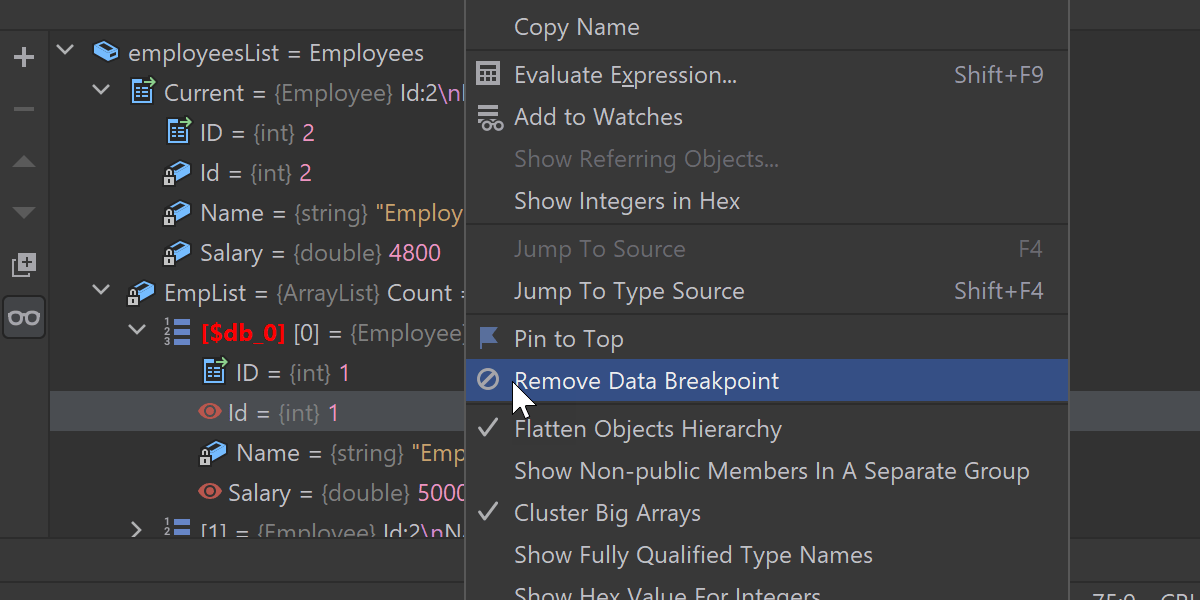
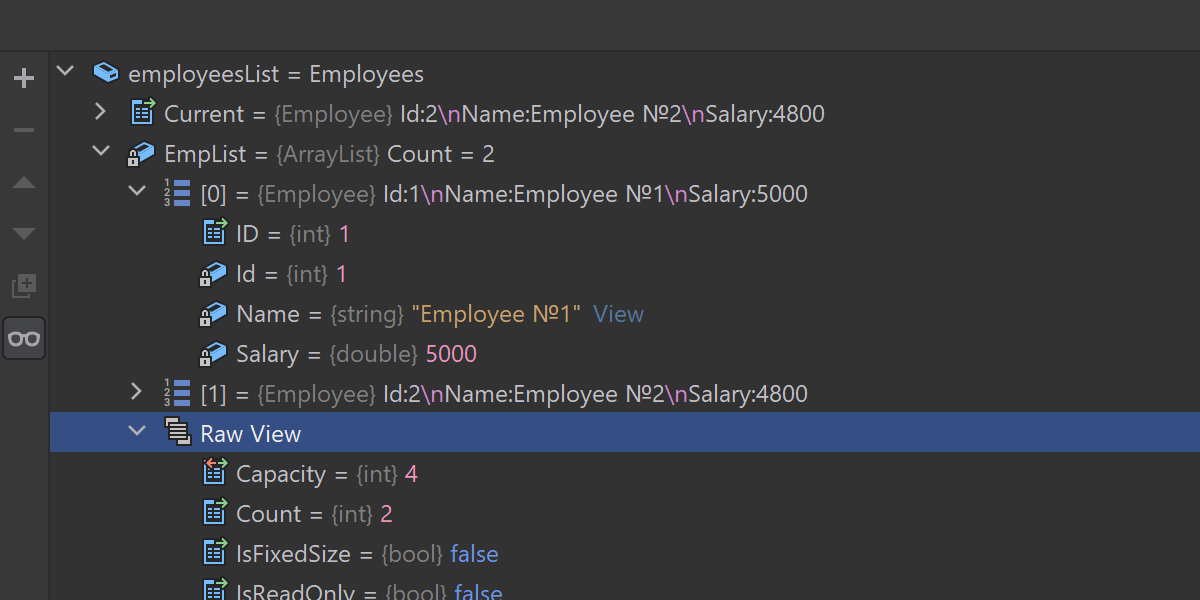
Data breakpoints Windows only
Data breakpoints are useful when you need to focus on a particular object’s properties. You typically use them in scenarios where you know what will change, but have no idea where the change comes from in your codebase. This will be accessible from the Watch tool window, and will even work with array elements. Due to current platform limitations, this feature is only available for .NET Core 3+ on Windows.
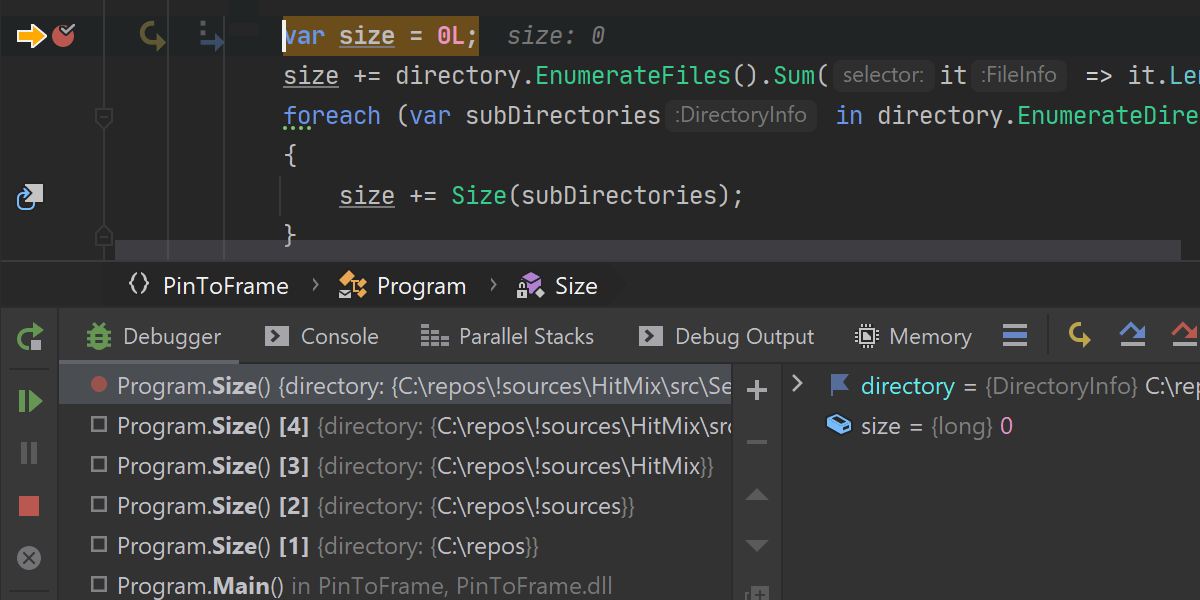
Pin-To-Frame
In Rider 2020.2, we’re adding Pin-To-Frame, which lets you pin values across frames. You can pin parameters for a function, and see them in the list of stack frames. When debugging recursive functions, it lets you watch the state of values in different iterations.
Localization Manager
The Localization Manager is now available in Rider to help you localize your .NET application or website. You can access it using the Tools menu or by double-clicking on a .resx file.
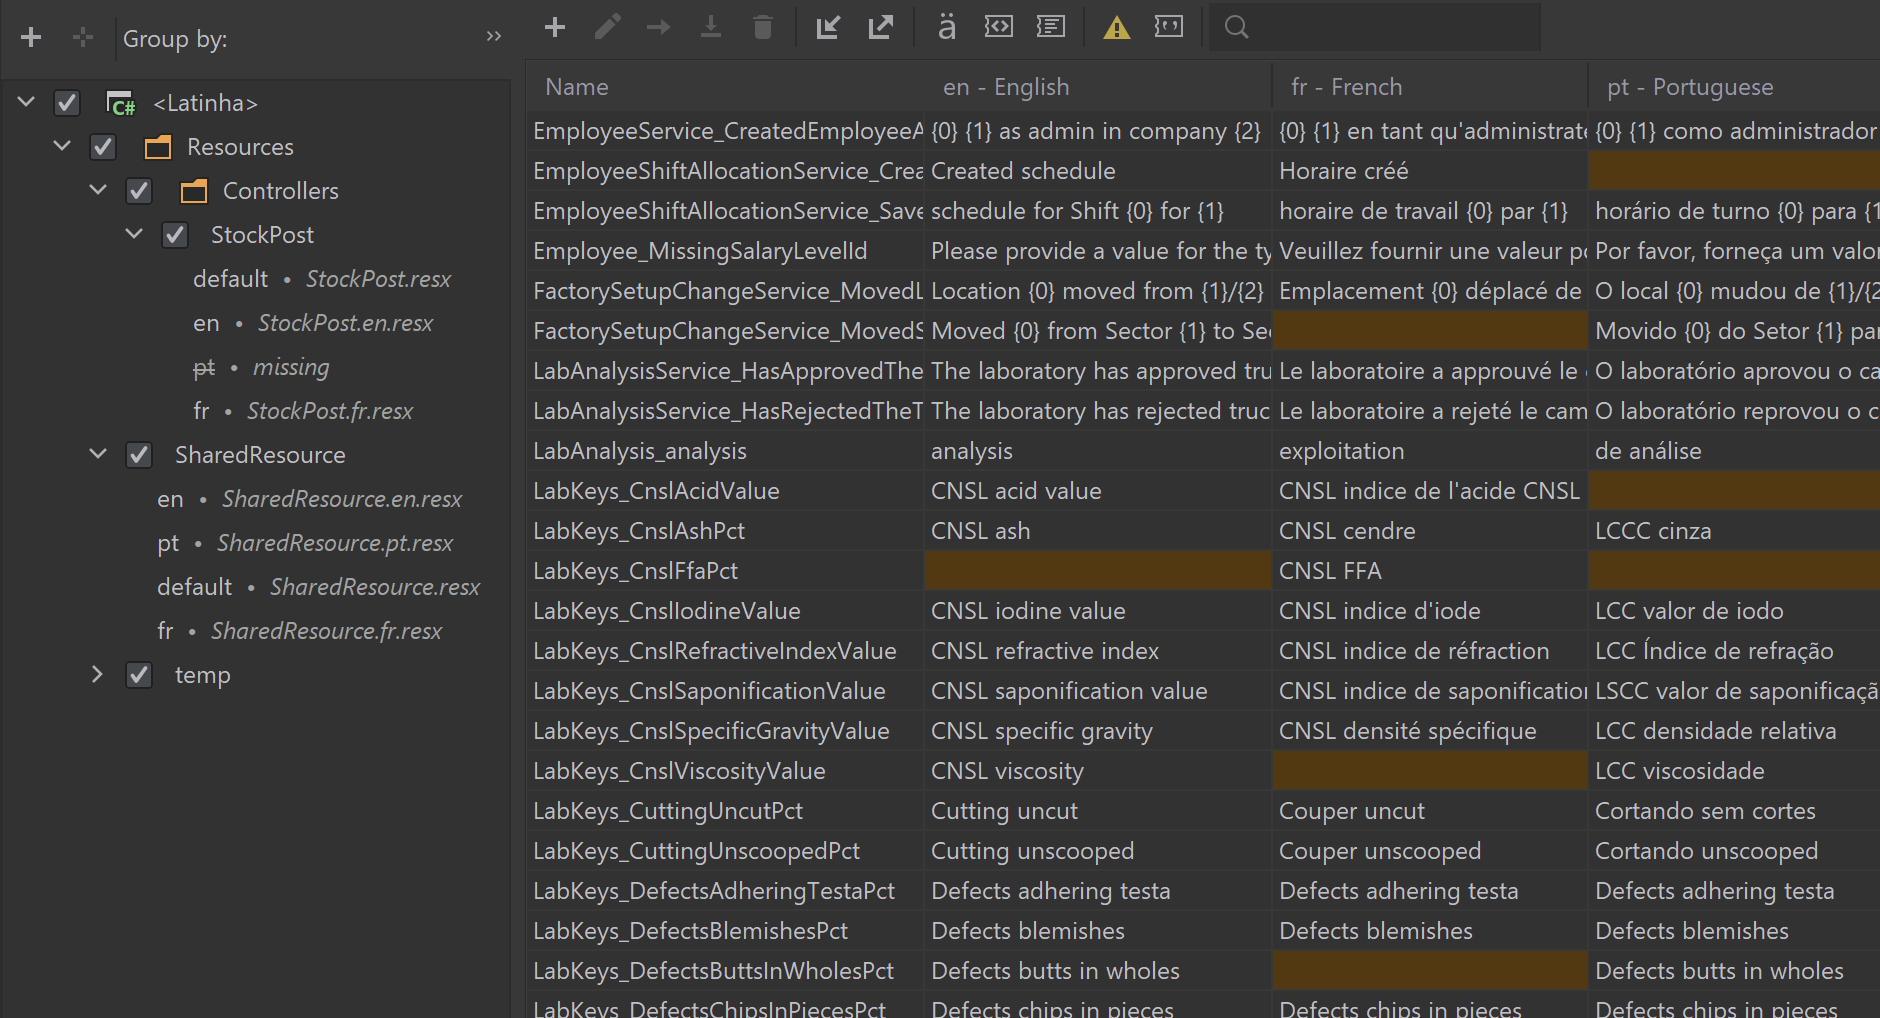
It allows you to view everything contained in all your project’s .resx files, or a
specified selection of files, in a single grid.
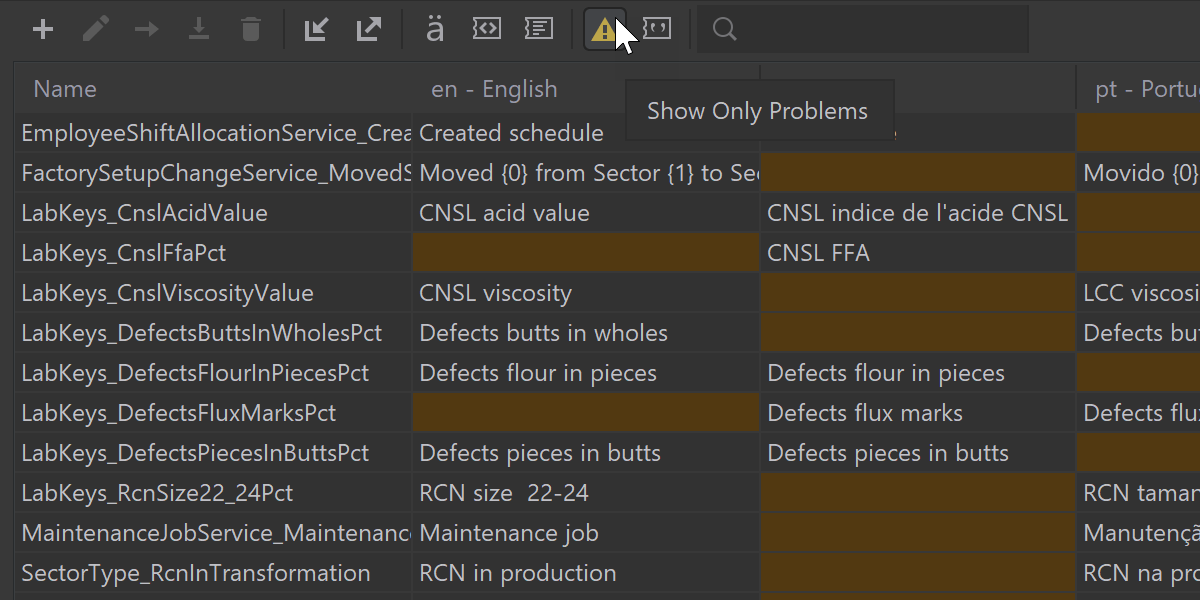
You can easily find all resources that are missing localized values or are just not used.


You can add, edit, rename, search for, find usages of, and safely delete any localized resources.
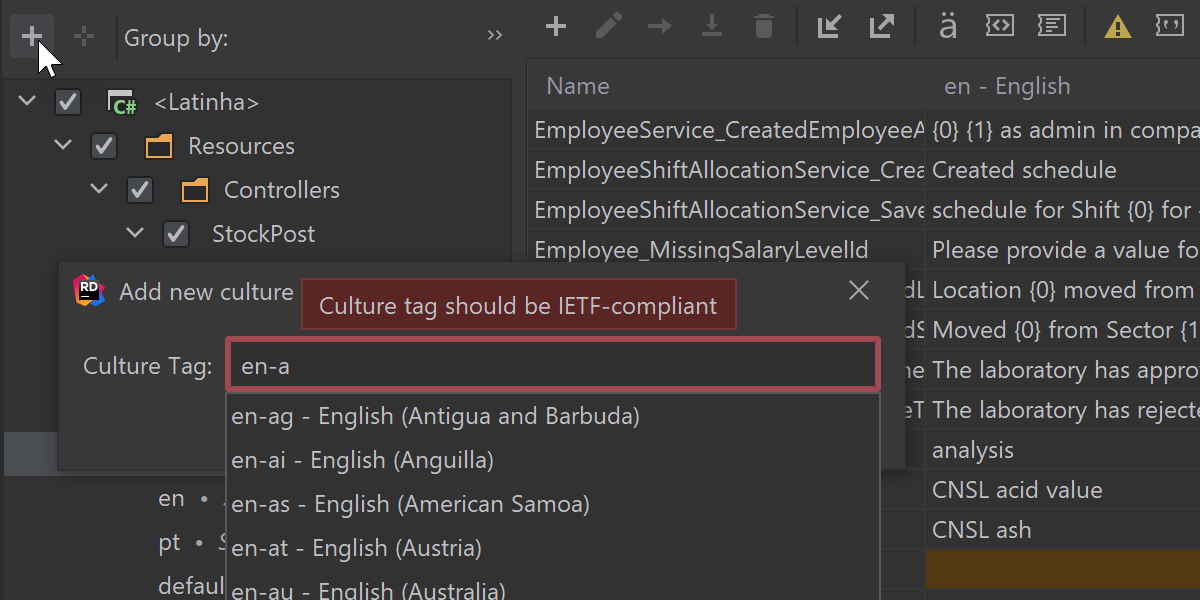
You can easily add a new culture to your application using the predefined list of cultures in the completion list or hide locales you don't need right now.
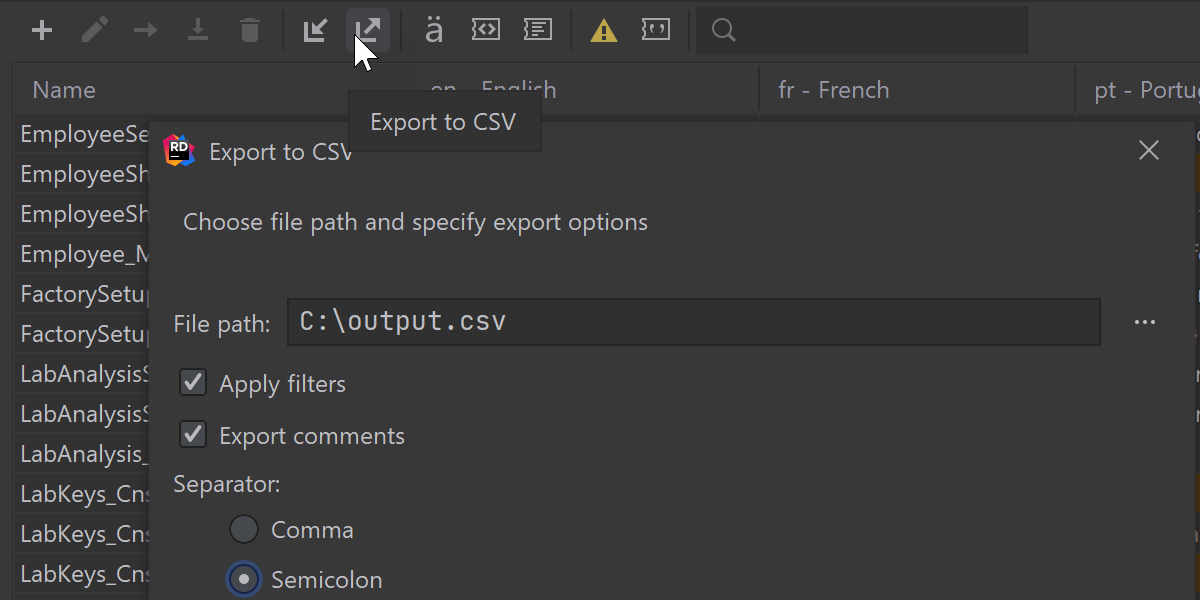
You can export the whole grid to a CSV format to share with translators and import the final version back into the Localization Manager.
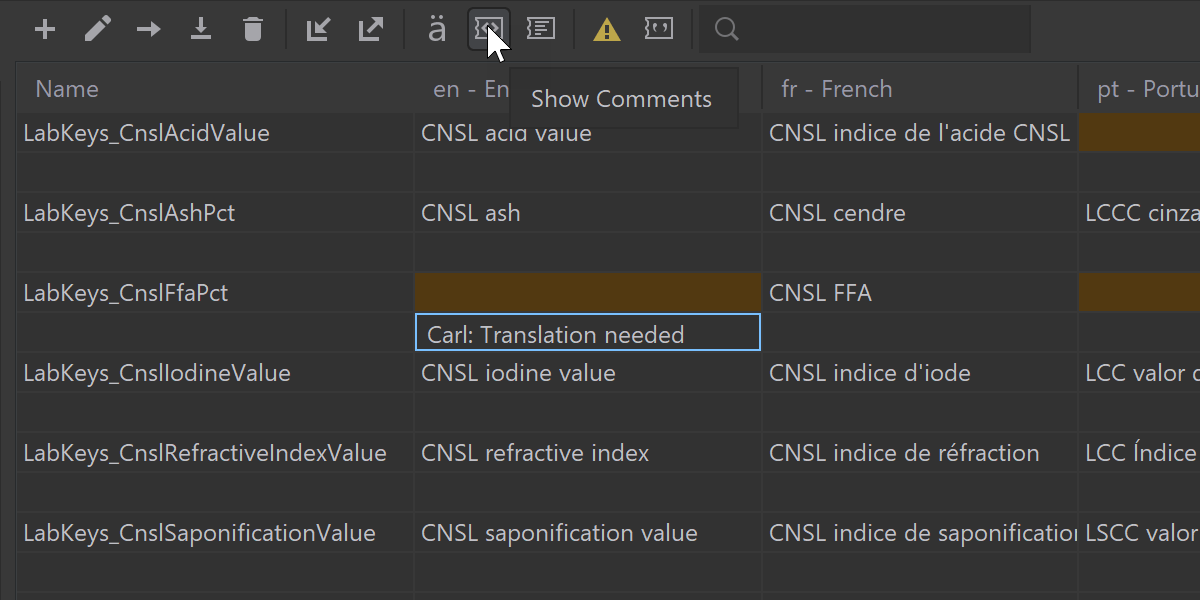
You can add and edit comments for any entity from resource files right inside the grid, and you can also export and import these comments.
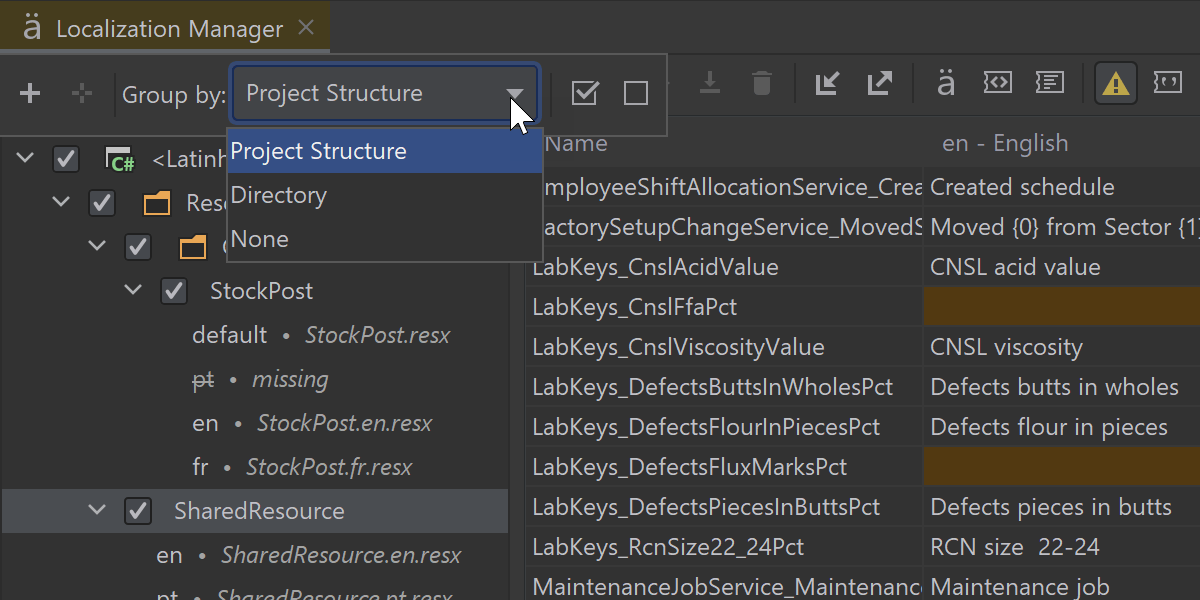
You can view the whole structure of .resx files in your solution with different groupings.
GameDev
Unity


Shader support
Rider 2020.2 adds much-requested support for Cg and HLSL shaders! This includes syntax highlighting, code completion, semantic error highlighting, go to definition, find usages, refactorings, and more.
Rider fully understands the structure of shader files, including macros, and can navigate to macro definitions or unroll them directly in code. Included files are discovered and parsed, and Ctrl+Click on an included file will take you directly to that file.
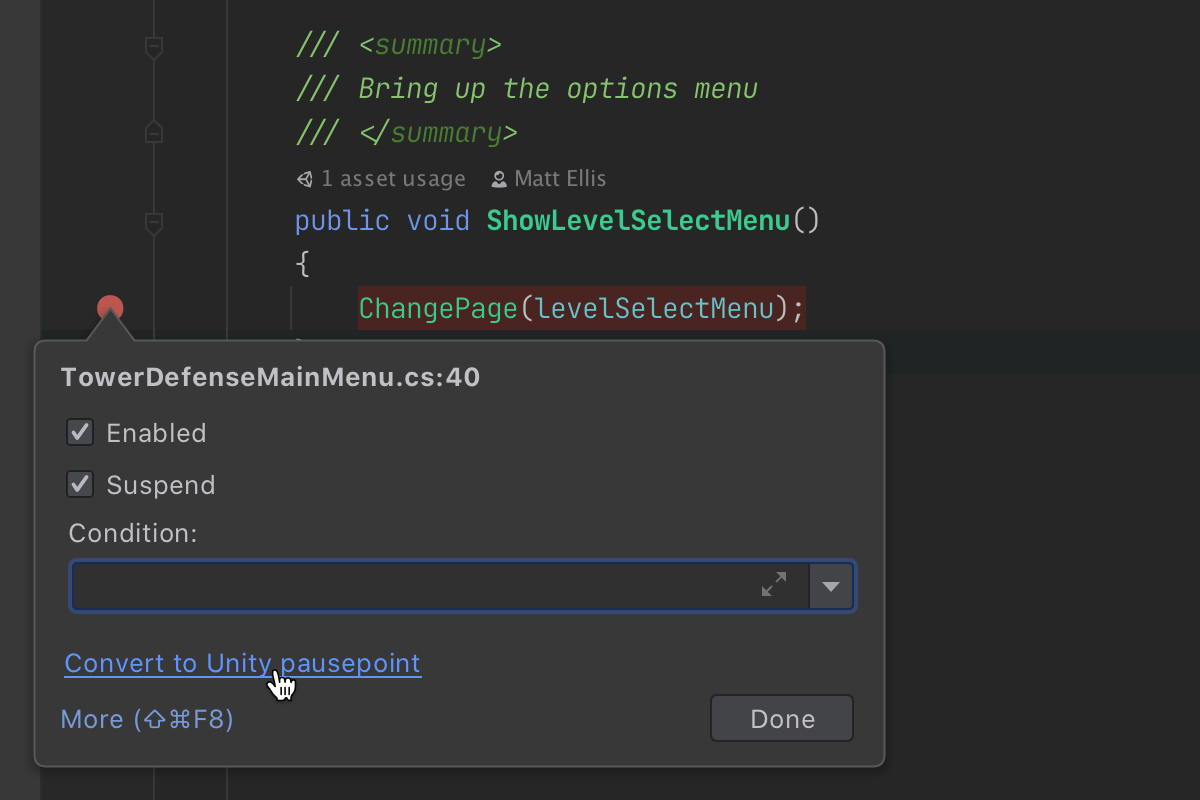
Pausepoints
Introducing a new kind of breakpoint! Set a breakpoint in code, convert it to a pausepoint, and when the debugger hits it, Unity Editor immediately switches to pause mode, allowing you to use the Inspector to view the state of your game.
This becomes an even more powerful tool when used in combination with conditional and dependent breakpoints. Read more in this blog post.
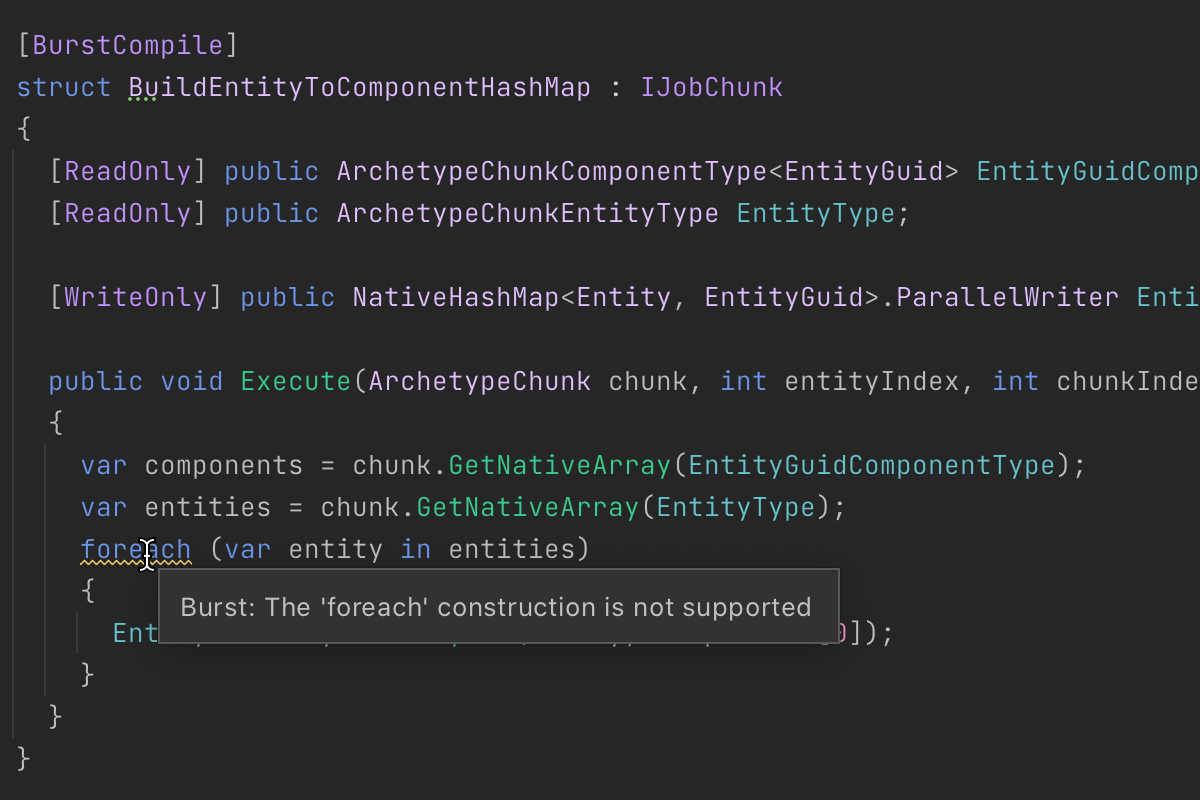
Burst analysis
Burst-enabled code can greatly improve the performance of your Unity application, but it places constraints on what your code can do.
Rider 2020.2 adds smart analysis for all code called within a Burst context, and will highlight any incorrect code usage, such as boxing, use of foreach or try/catch, as well as reading/writing to static fields, and more.
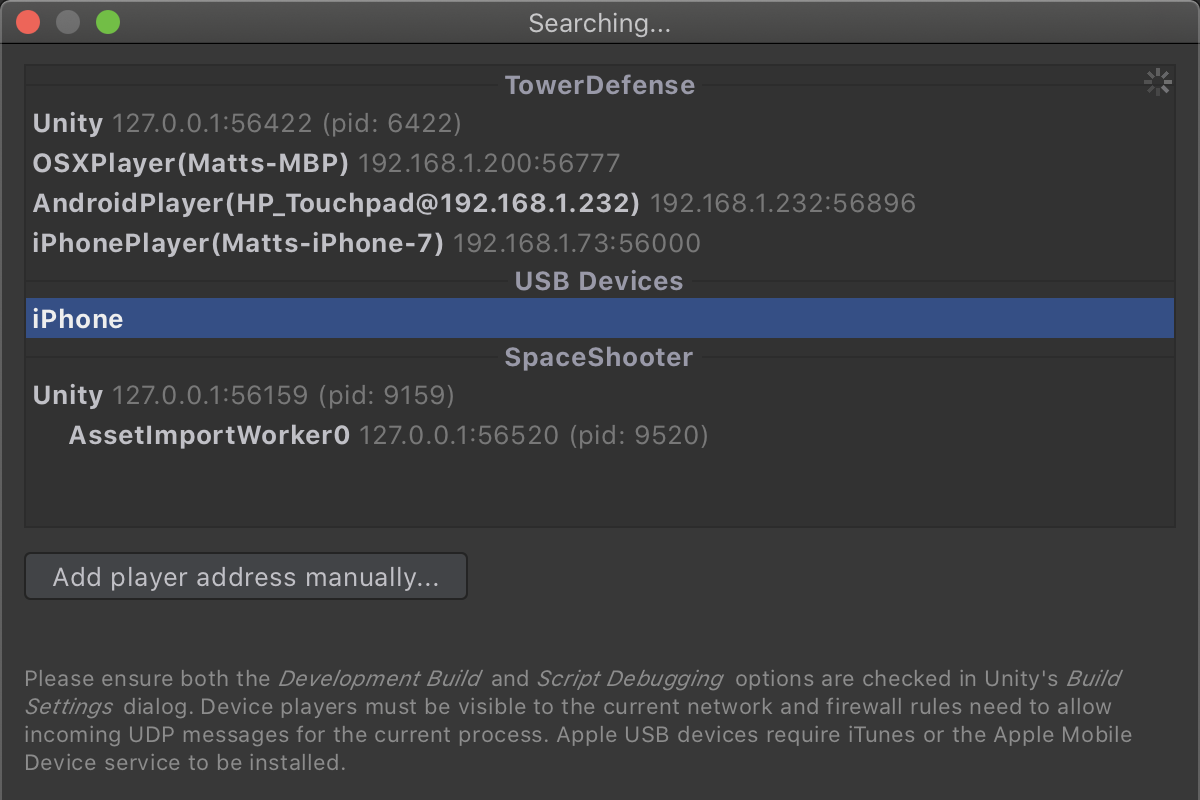
USB debugging for Apple devices
Rider already has great support for debugging players over the network, including standalone desktop players, mobiles, and consoles.
Rider 2020.2 introduces USB-based debugging for Apple devices (USB debugging for Android devices is planned for a future release).
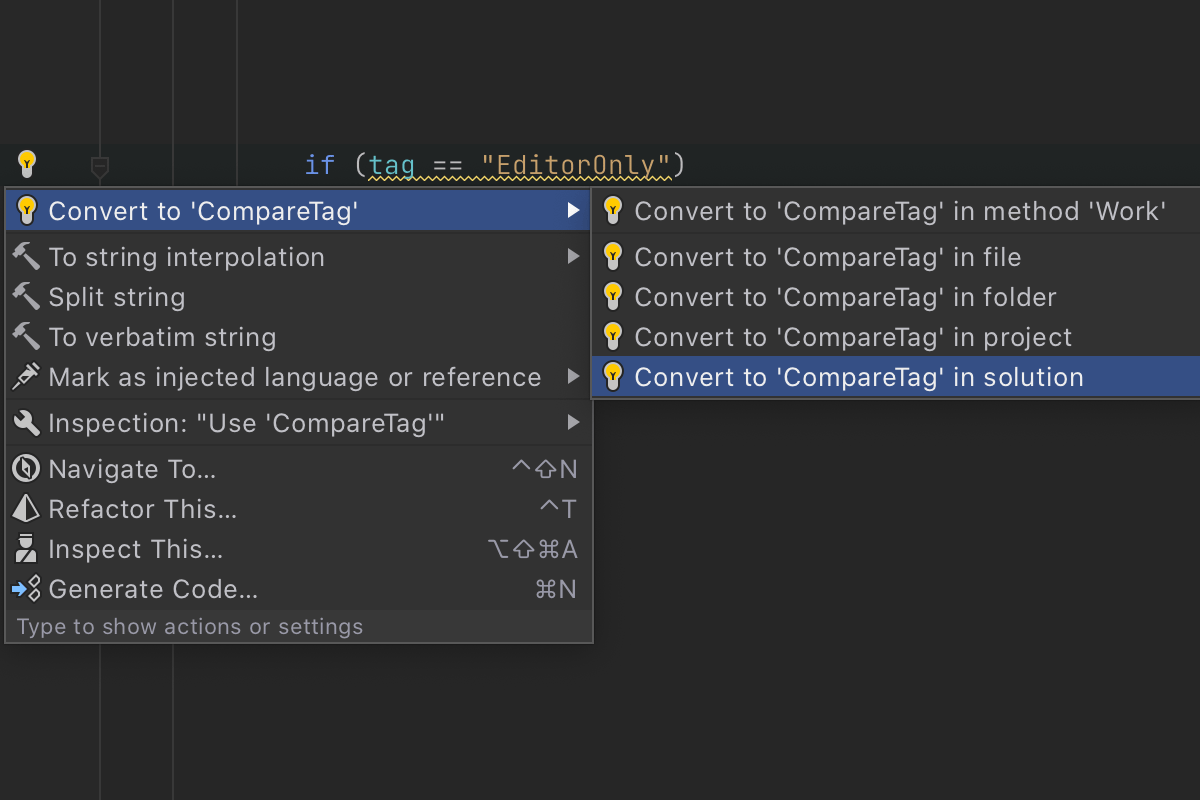
Bulk quick fixes
All quick-fixes that can be run on files, projects, and entire solutions have now been upgraded to be able to do so.
Remove redundant Unity attributes, replace string literal comparisons with
CompareTag,
improve performance by combining object creation with setting the parent transform, and
more – all across your entire Unity project, with a single click.
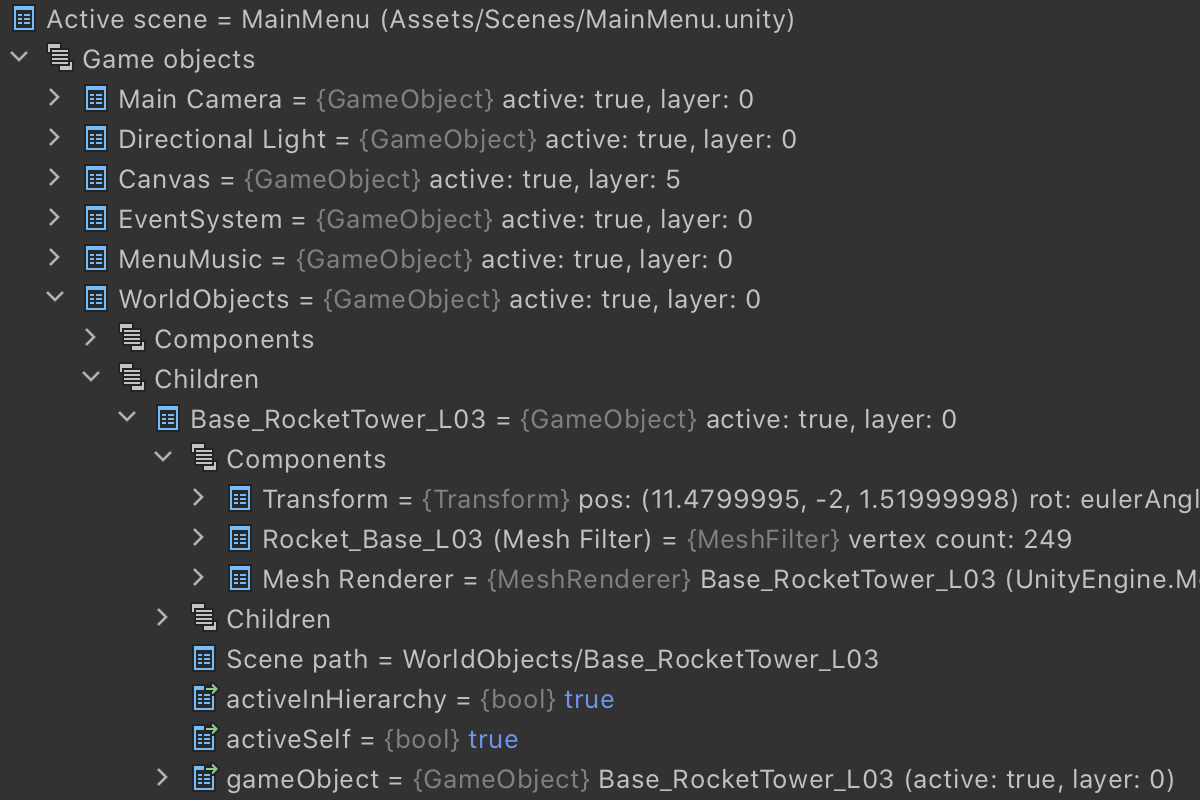
Debugger value extensions
Rider’s debugger will show you extra contextual values for Unity projects. Get easy access to the active scene, child game objects, and all attached components.
Rider also displays improved summary information for certain types, such as Euler angles for Quaternion, full precision values for vectors, the enabled state of behaviors, and more.
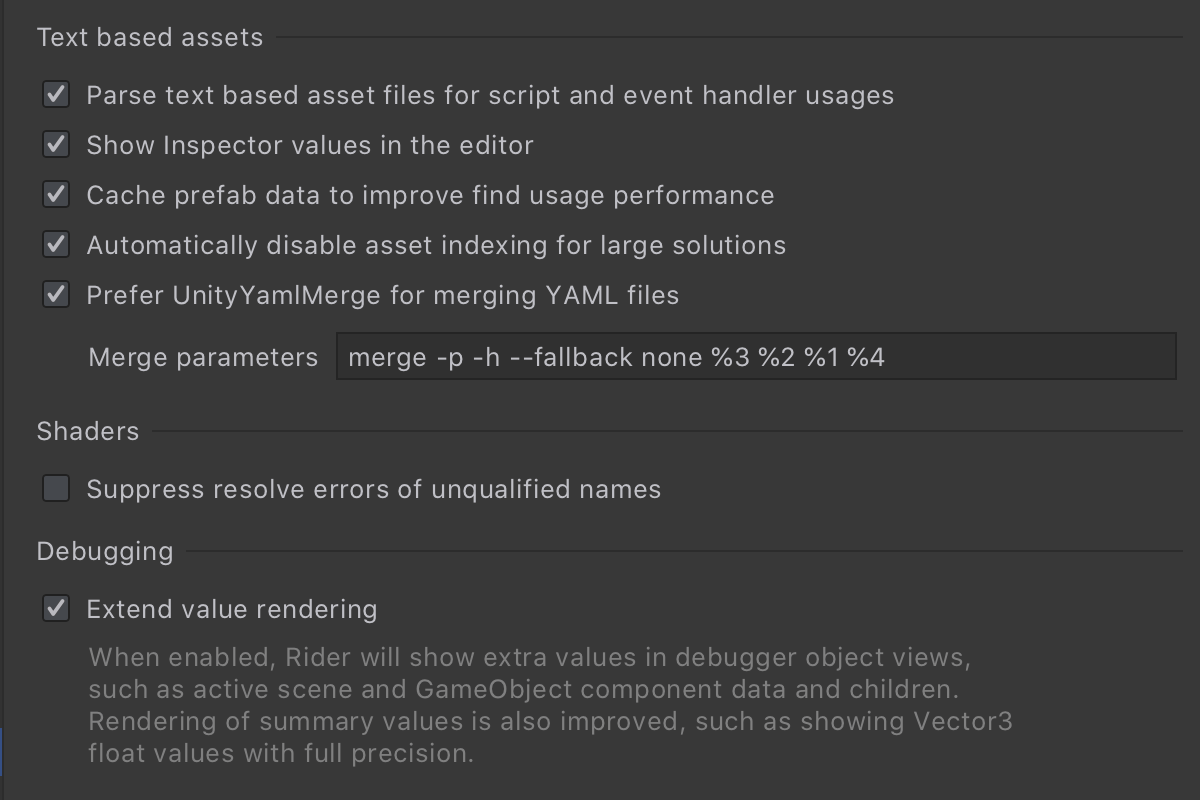
Integrated UnityYamlMerge support
Rider will automatically use Unity’s Smart Merge tool to merge asset files when performing integrated version control operations.
More features
- Significant reduction in memory usage and improved throughput while indexing text-based assets for code usages in scenes, prefabs, and other assets.
- Common Unity API terms have been added as a custom dictionary to Rider’s spell checker.
- Code cleanup now recognizes Unity types, and will no longer reorder serialized fields, which is important when showing these fields in the Unity Inspector.
- More minor features and fixes.
Rider for Unreal Engine Early Preview
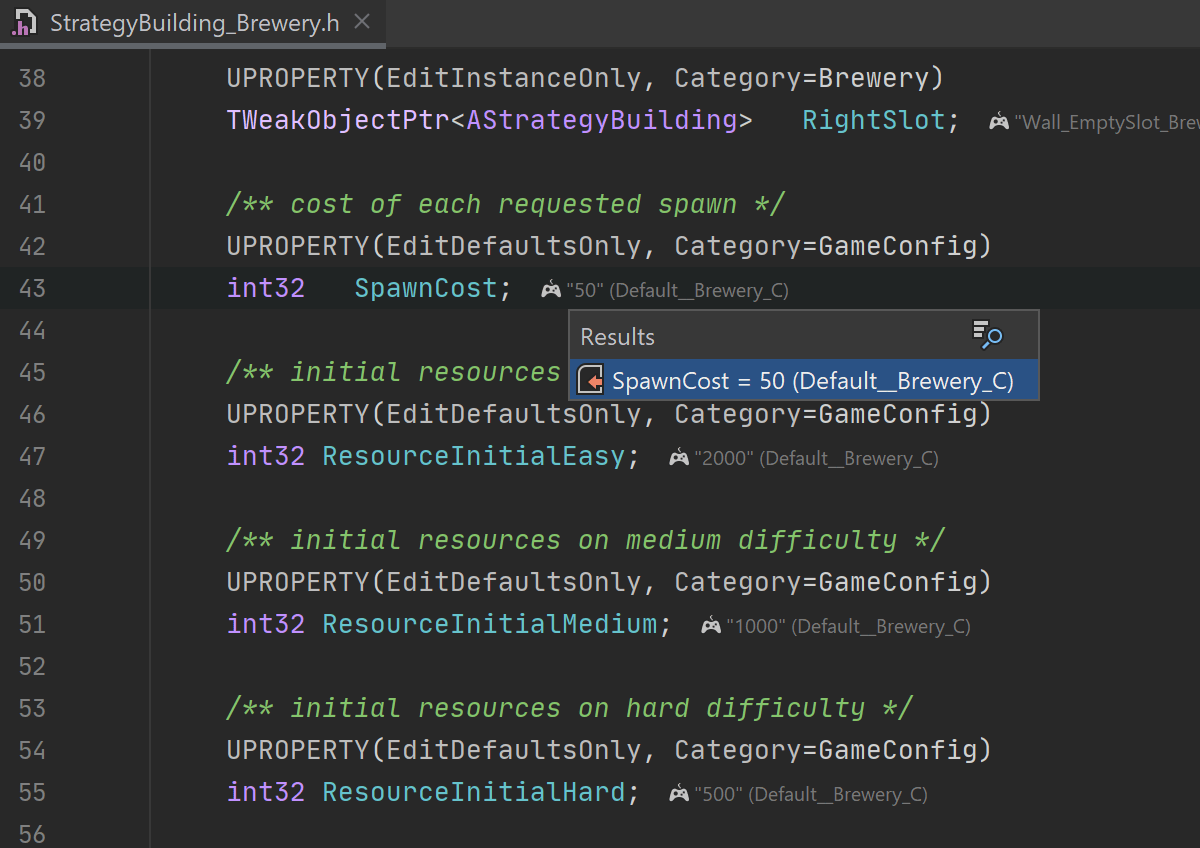
Are you interested in game development with Unreal Engine? On our way toward making Rider a standalone, all-in-one, universal game development IDE, we have introduced early support for Unreal Engine development in Rider:
- Native C++ support powered by the ReSharper C++ engine.
- Performance optimized for Unreal Engine projects.
- Integration with the Unreal Editor and Blueprints information in the Rider Editor.
- Understanding UE reflection and RPC, and enforcement of UE naming rules.
- Getting HLSL and C#, JSON, and uproject/uplugin dialects.
The Early Access Preview is free to use. Simply register to join.
Code Analysis
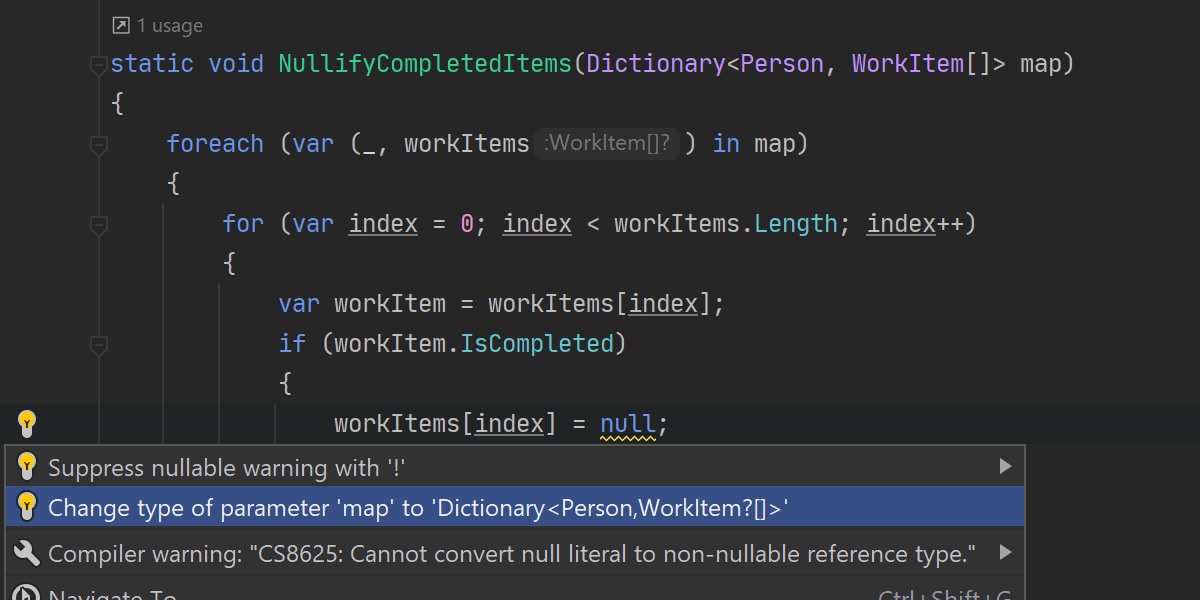
Nullability code analysis is now aware of more cases and can trace incorrect nullability
through deconstruction and the foreach cycle. It also provides a corresponding
quick-fix.
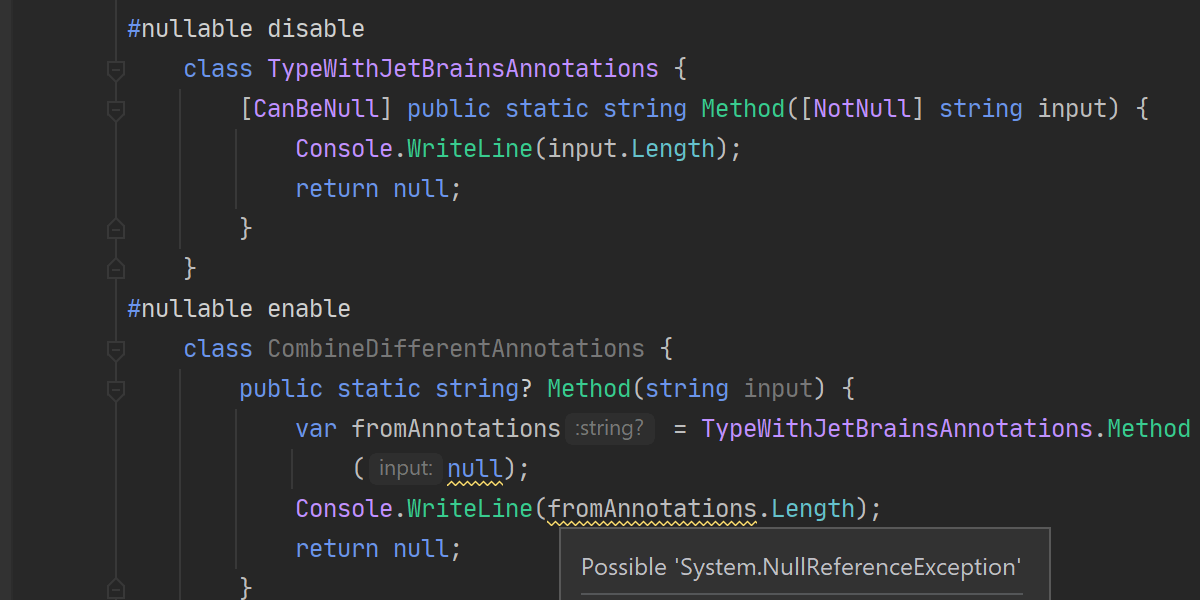
Code analysis now takes into account JetBrains.Annotations attributes (both
NotNull and CanBeNull) for the API, even in code where nullable reference
types are disabled (#nullable disable).


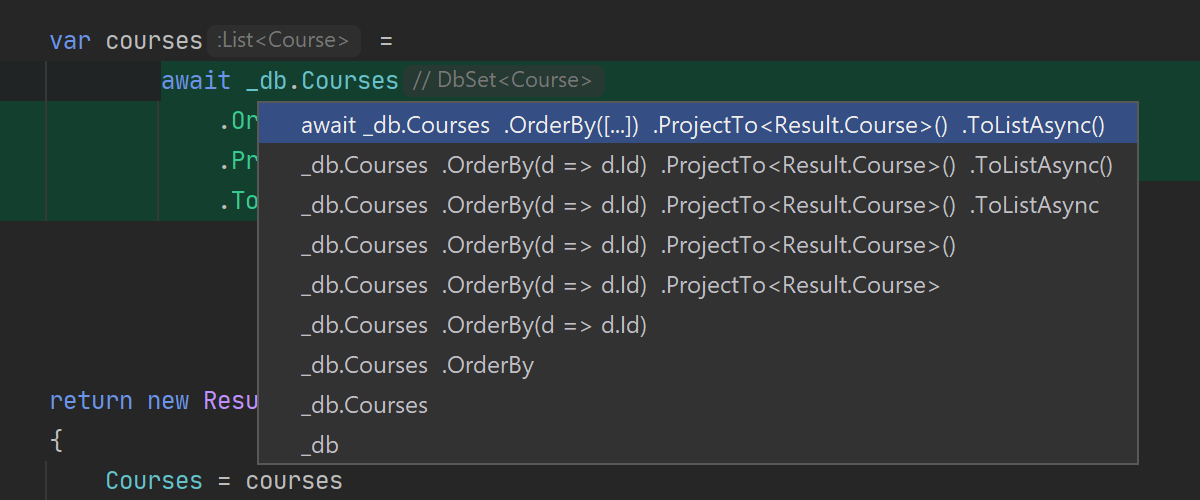
Context actions for converting "foreach to LINQ" and "LINQ to code" are also available on
IAsyncEnumerable‹T› if you have the System.Linq.Async
NuGet package installed for your project.
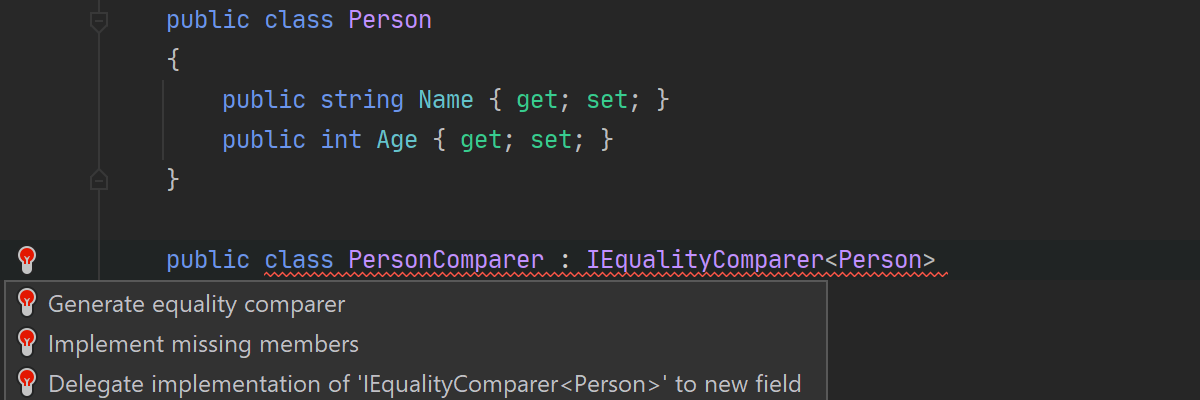
Now it’s possible to easily generate IEqualityComparer‹T› and
IComparer‹T› implementations with the appropriate quick-fixes.
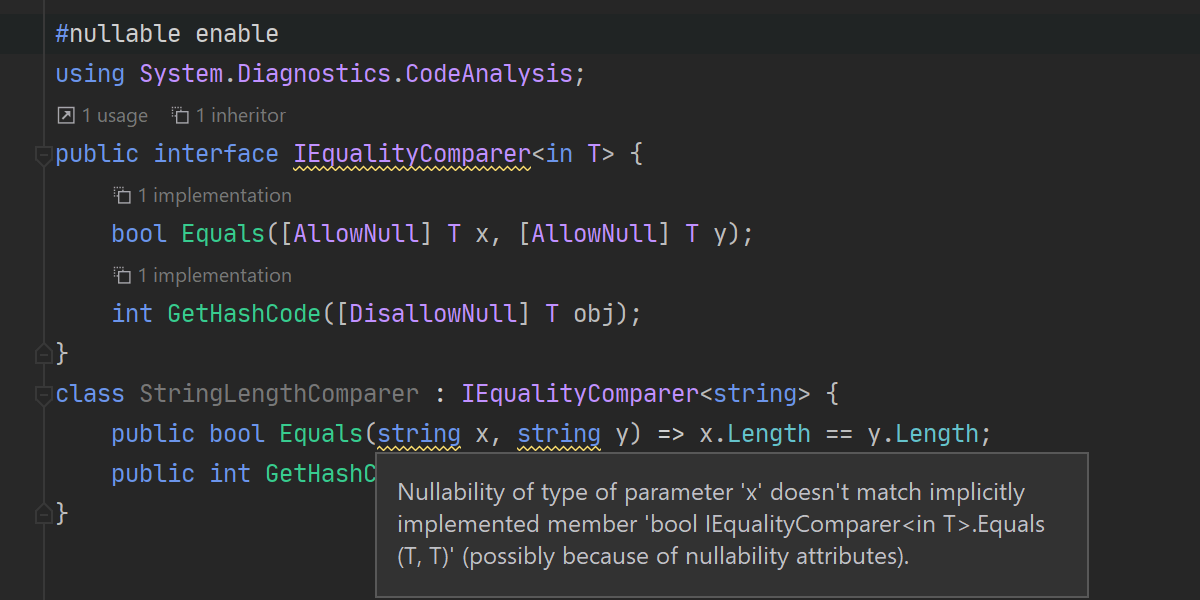
Code Analysis now takes compiler annotations (such as AllowNull and DisallowNull)
into account when verifying the nullability of implemented or overridden members.
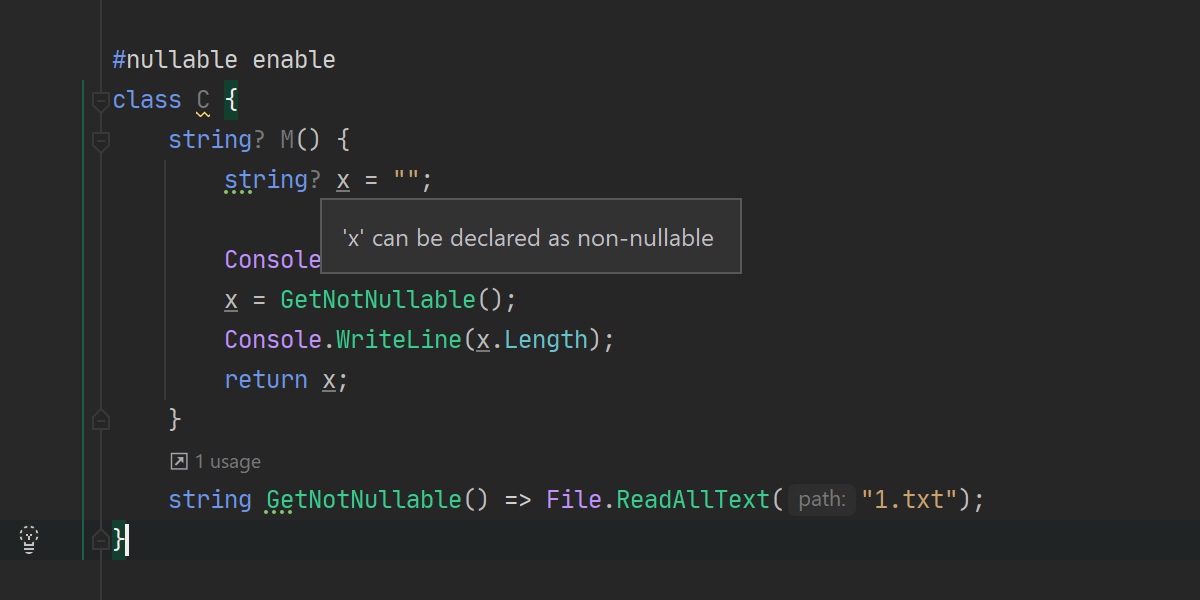
There are new inspections and quick-fixes to make variables and return types “not nullable” if they have never held or returned nullable values.
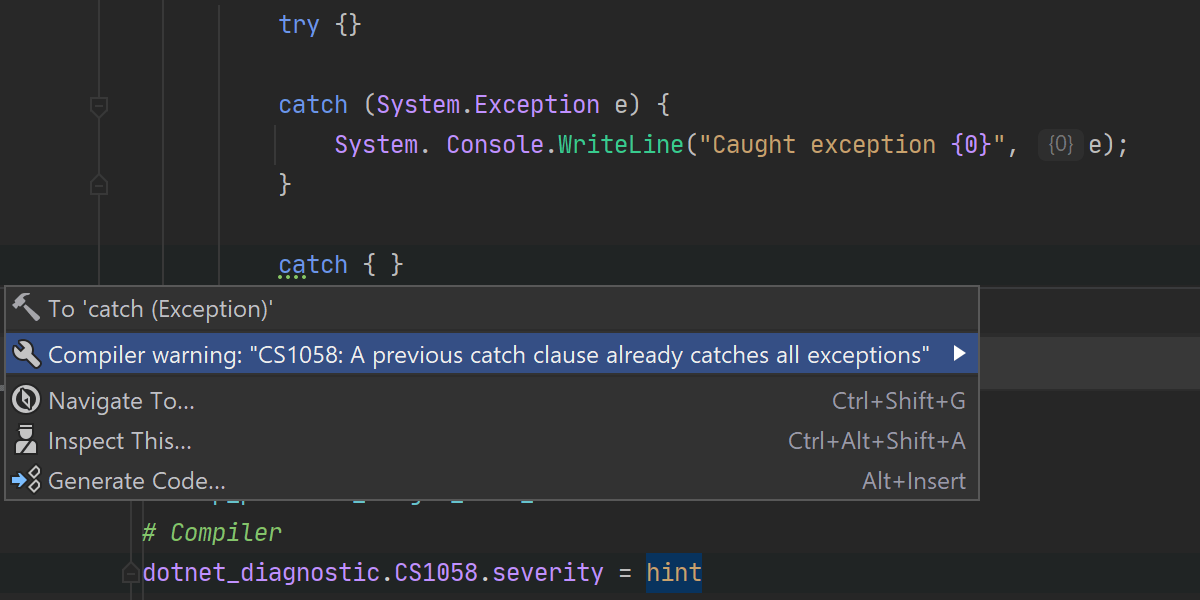
Code analysis is now able to follow the dotnet_diagnostic rules from the .editorconfig
file. Specify the severity of inspections in the .editorconfig file, e.g. dotnet_diagnostic.CS1058.severity
= hint, and Rider will display inspections accordingly.
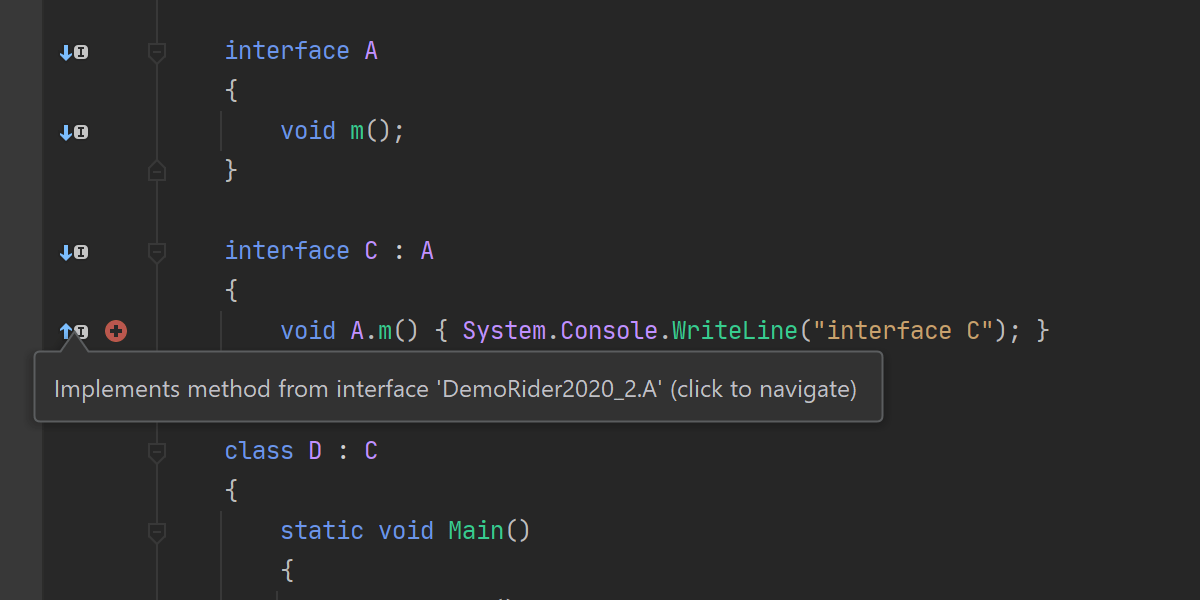
Support for the default implementations in interfaces feature has been enhanced in this release. The left-hand gutter in the code editor shows that a method is implemented or overridden, and our refactorings and navigation are aware of this C# language feature.
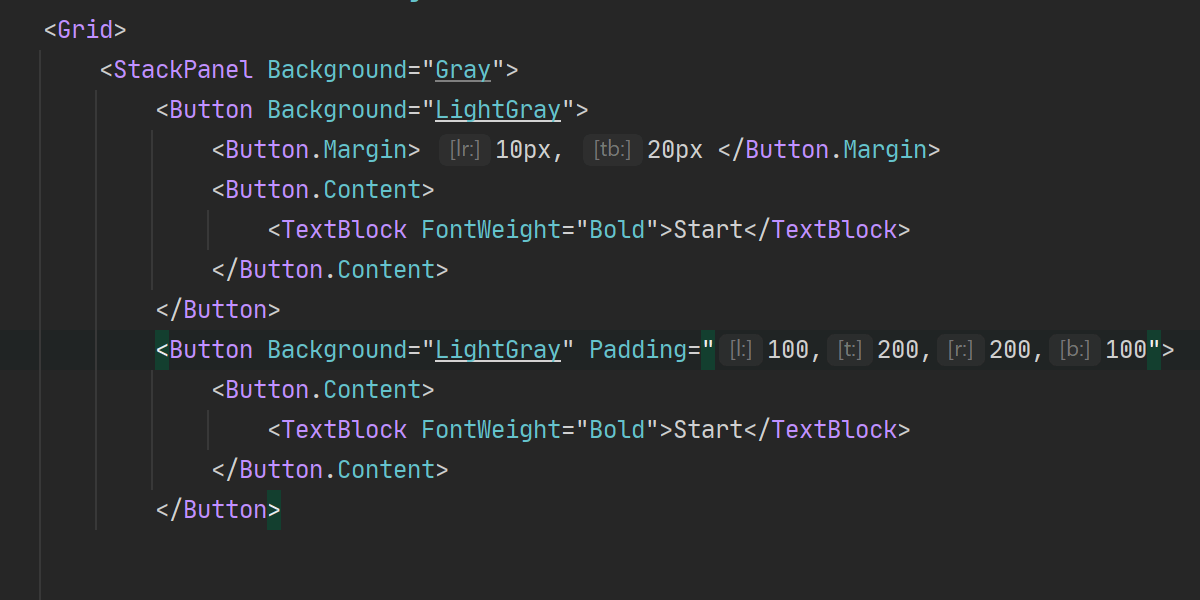
Inlay hints are now available in XAML code. We provide hints for markup property names and
DataContext, as well as for margins and paddings, which is handy if you don’t want
to memorize their orders.
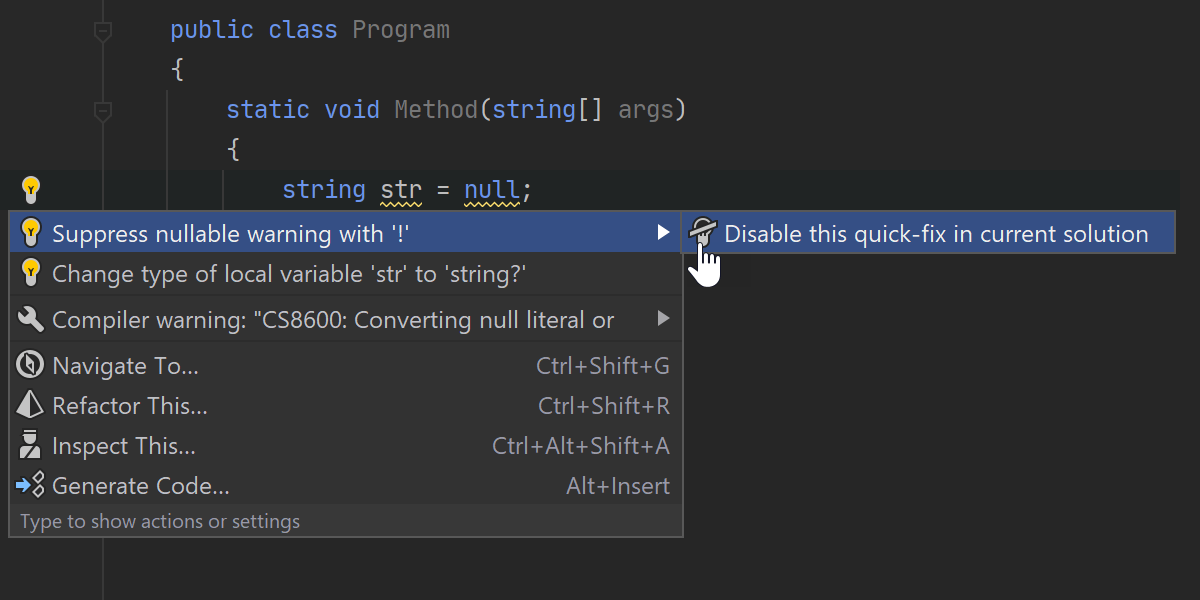
The Suppress nullable warning with ! quick-fix can be disabled for a solution via the Alt+Enter menu.
Unit Testing
We’ve rebuilt our unit test runner from scratch for both .NET Framework and .NET Core to have the same runner for both runtimes which run out of the Visual Studio process. It helps us solve a lot of problems with discovering, running, and debugging unit tests, and gives us full control over unit test hierarchies for .NET Core tests.
The new unit test runner introduces the following important improvements:
- Built-in support for MSFakes for NUnit, xUnit, MSTest v2 unit test frameworks.
- Built-in support for TypeMock Isolator for NUnit, xUnit, and MSTest v2.
- MSTest v2 tests can now be run without Visual Studio installed.
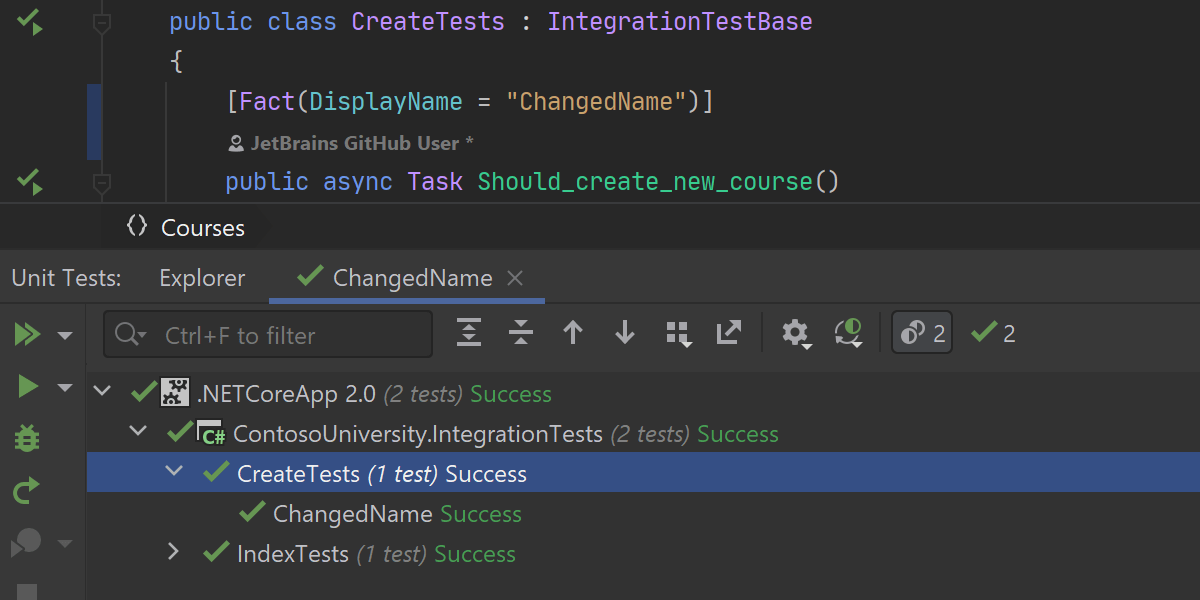
Rider now supports the DisplayName attribute in .NET Core tests for xUnit and NUnit frameworks.
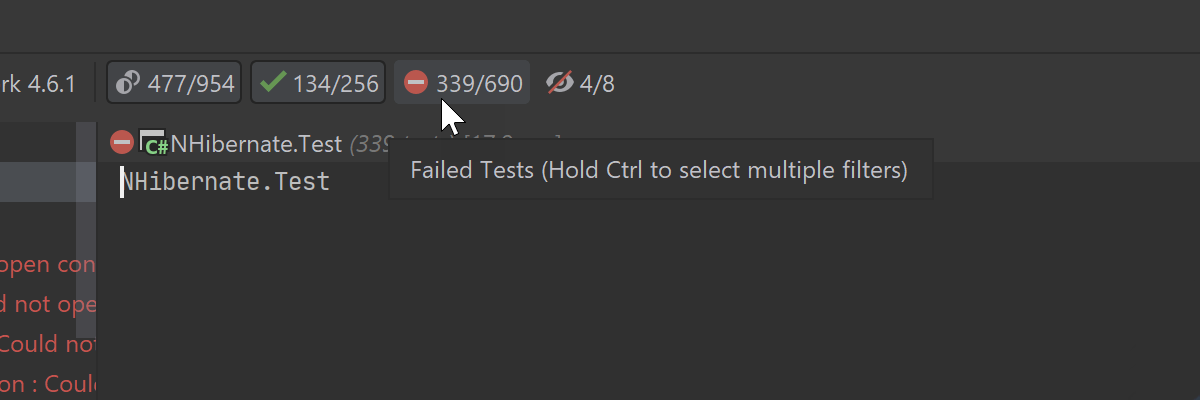
You can select multiple unit test statuses simultaneously to filter them in the unit test tree. Enable or disable multiple statuses by holding down the Ctrl key as you click on them.
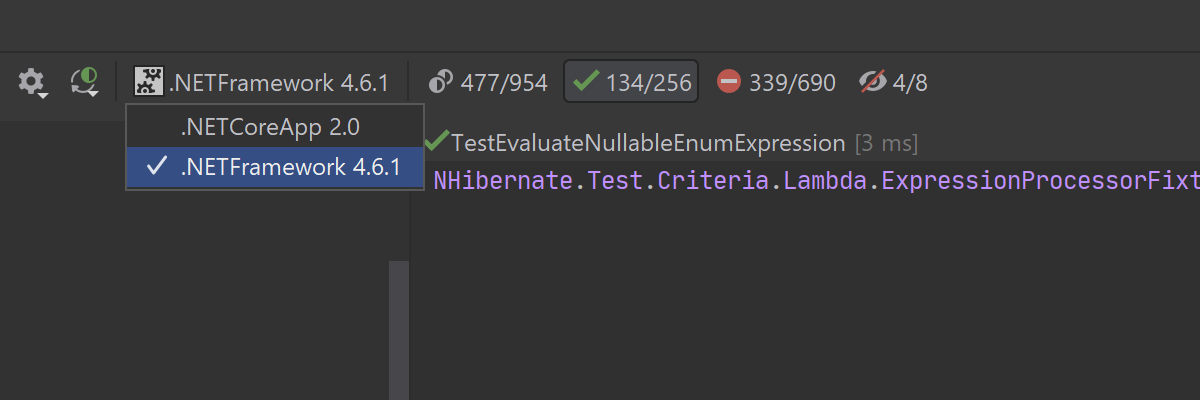
There are two different counters for each status when a search or target framework filter is applied to show the overall number of unit tests, and the number of tests that match the filter criteria.
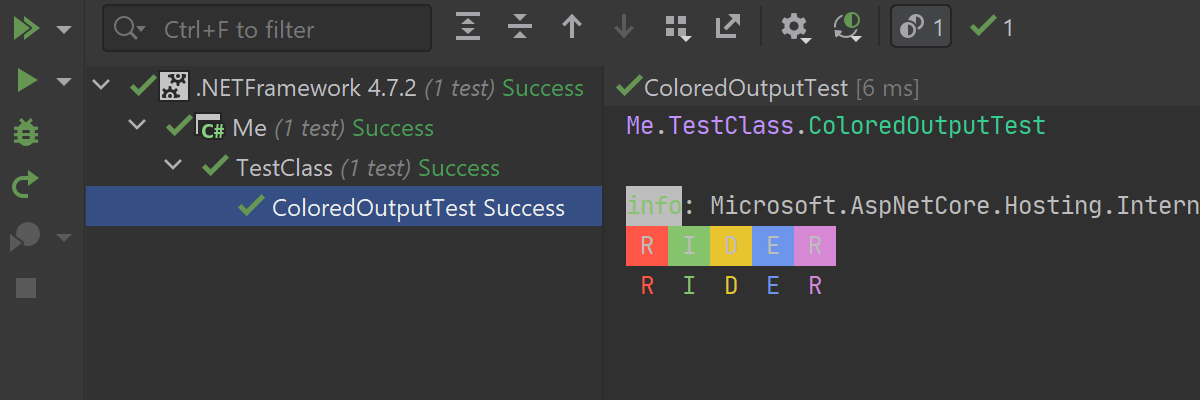
We’ve added support for ANSI escape codes in the Output window, so you can colorize the unit test output if you want.
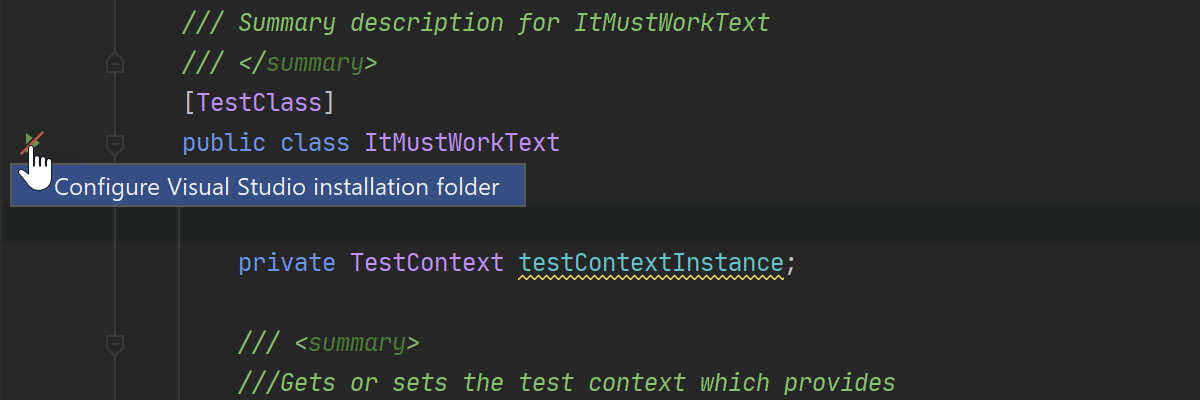
There is a new action in the Alt+Enter menu to open the Settings dialog if you get a "Visual studio installation folder is not set" status for your MSTest unit test.
Version control
GitHub pull requests
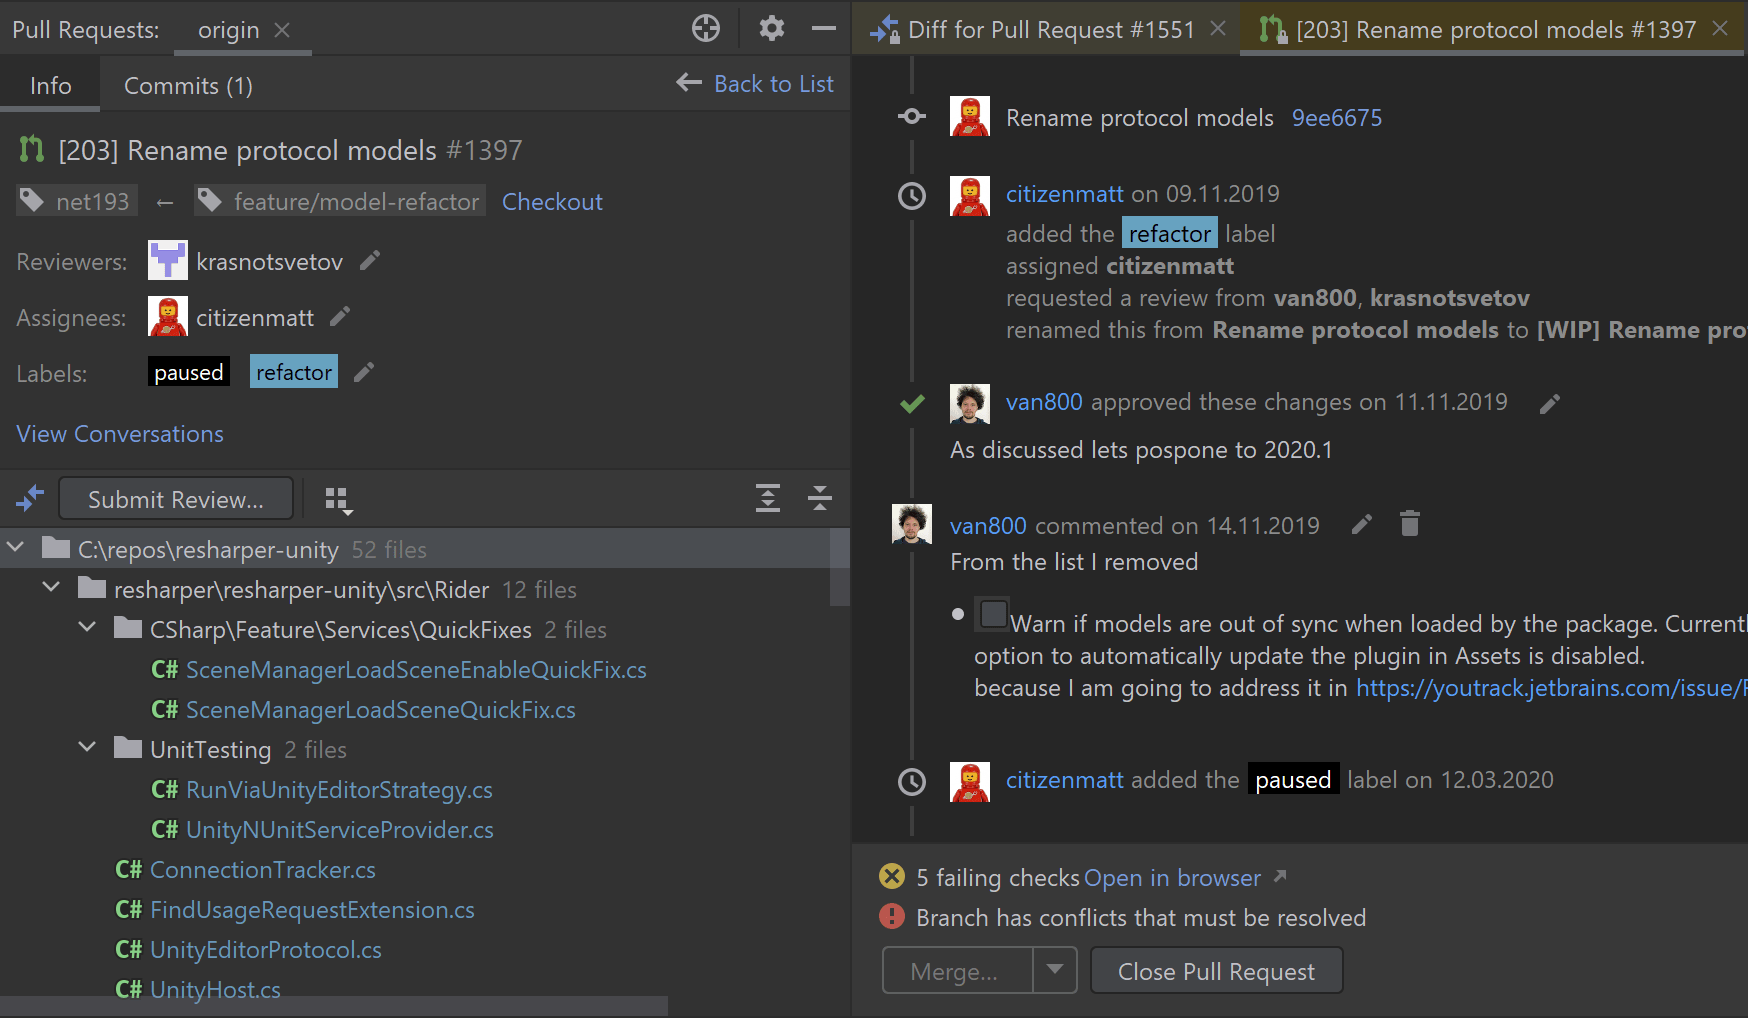
Enhanced support for GitHub pull requests is finally here! You’ll be able to browse, assign, manage, and even merge pull requests, view the timeline and inline comments, submit comments and reviews, and accept changes.
The new support includes:
- A new layout for the pull requests viewer.
- Viewing the results of pre-commit checks in the Timeline.
- Support for reviews.
- Interaction with comments.
- Merging pull requests from within the IDE.
For more details about this new feature, please check out this blog post.


Other VCS features
In addition to full GitHub pull request support, the following new features are available for version control systems:
- Support for Git installed in WSL2.
- We’ve improved the way the result of the Compare branches action is presented.
- You can now select a number of local commits in the Log tab of the Git tool window and squash them into one. This action is available from the right-click context menu.
NuGet
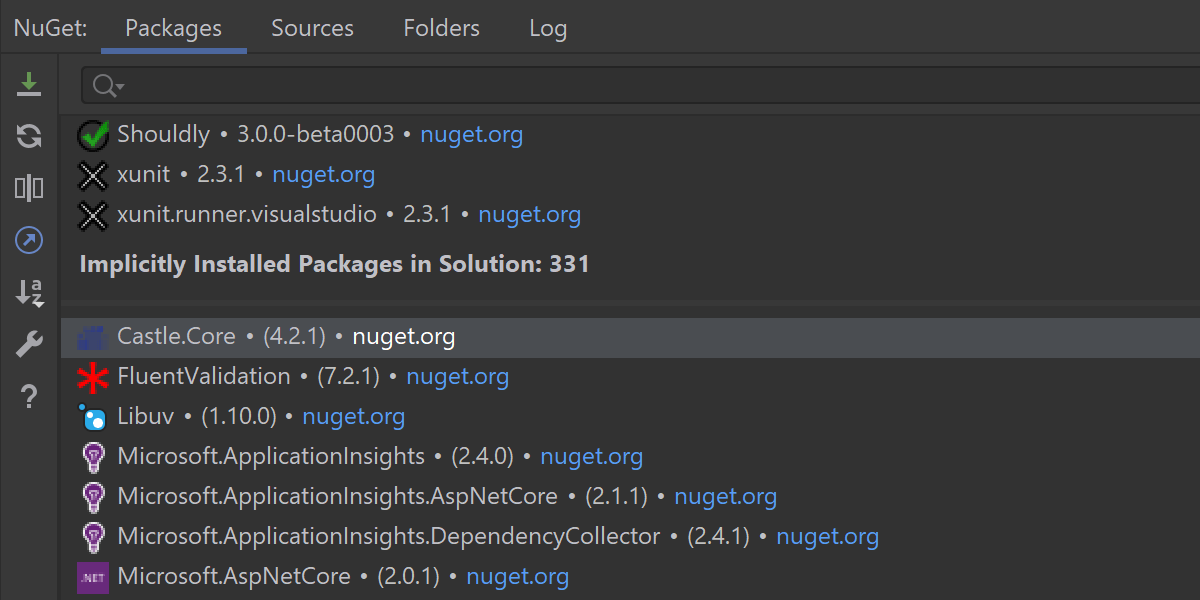
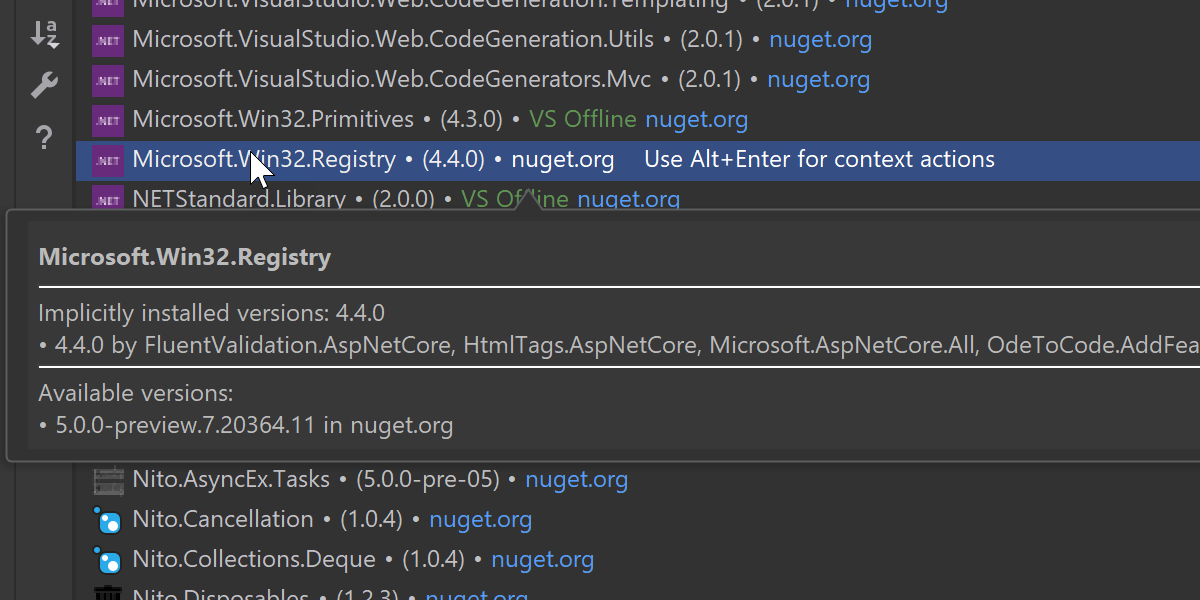
You can use the NuGet tool window to see all the transitive packages of a solution or project in the new Implicitly Installed Packages section.
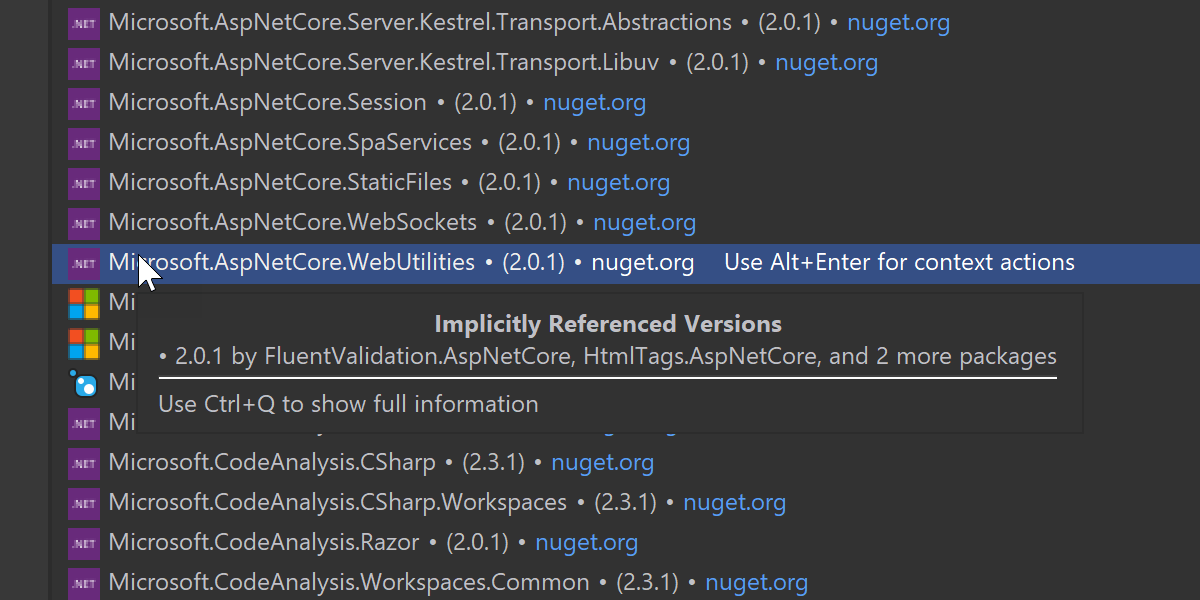
Hovering over an implicit package reveals a tooltip that contains information about the implicit package’s version and the referencing package. If the package is referenced in multiple versions, they will all be shown.
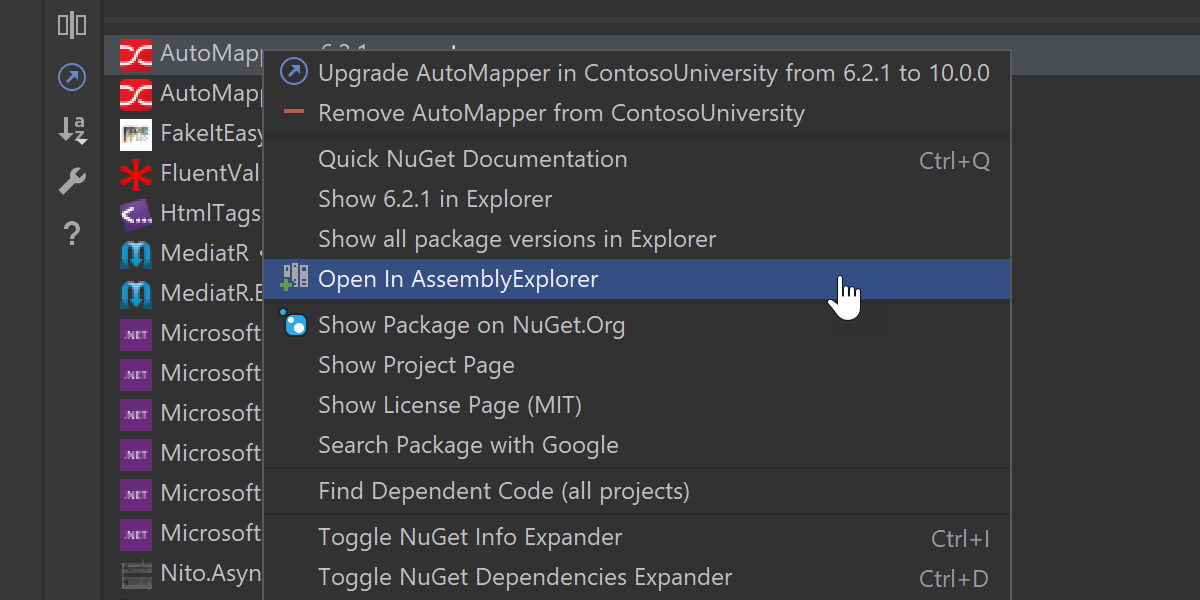
We’ve added a new context popup menu that can be invoked via right-clicking or pressing Alt+Enter on a NuGet package. From here you can quickly access all the relevant actions for a single NuGet package, like updating or removing the package, opening it in the Assembly Explorer to examine the API, revealing it in the filesystem explorer, navigating to the related NuGet.org entry, or finding dependent code.
There is also a new Quick NuGet Documentation action to bring up the implicit reference paths to a package.
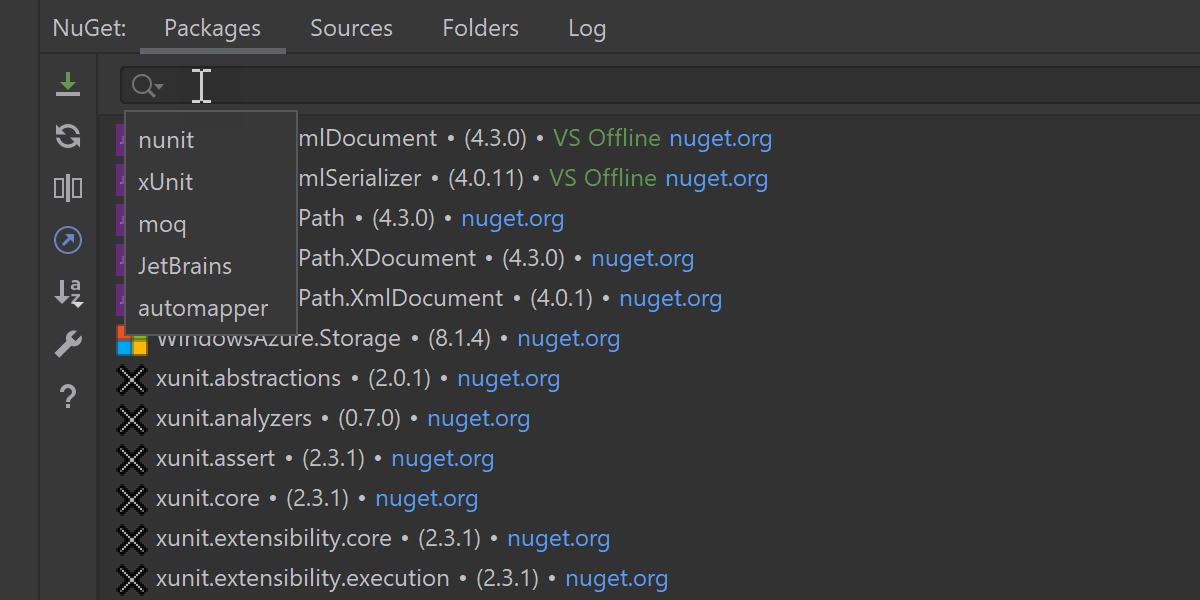
The search box for packages also received an update. You can either click the magnifier icon or use Alt+Down Arrow to open the history of recent package searches.
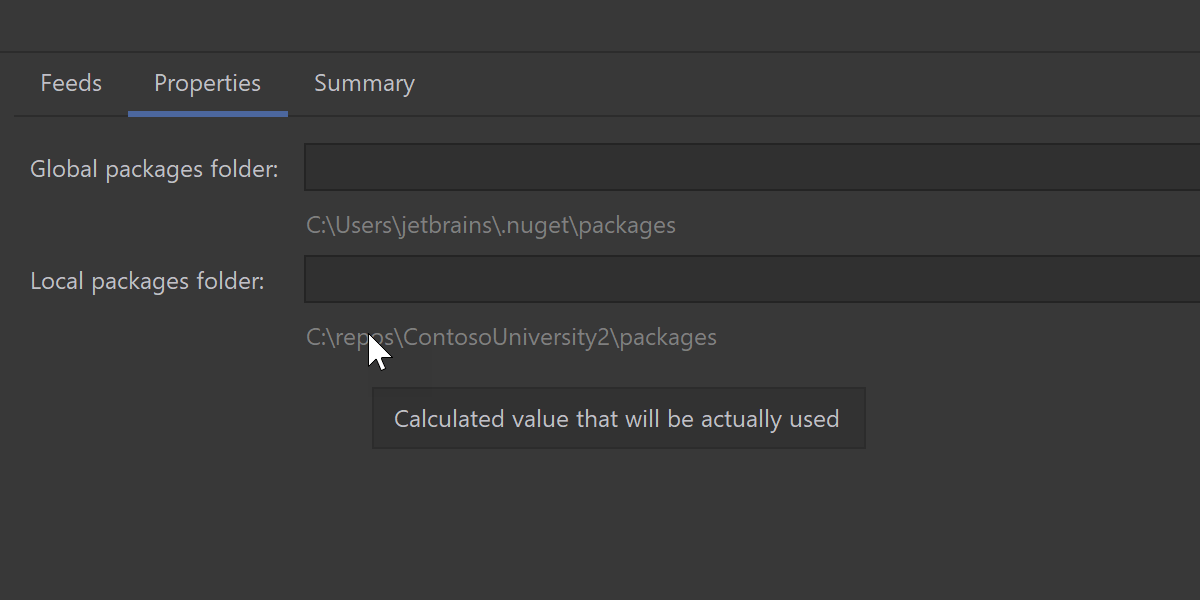
We can now also edit values for two of the most commonly changed properties – globalPackagesFolder
and repositoryPath.


In the Feeds tab, we can now immediately see whether a feed path is invalid as the path will be highlighted with a red rectangle.
A warning message will also be shown in the search list if we search for a package and it is not found in any of the feeds.
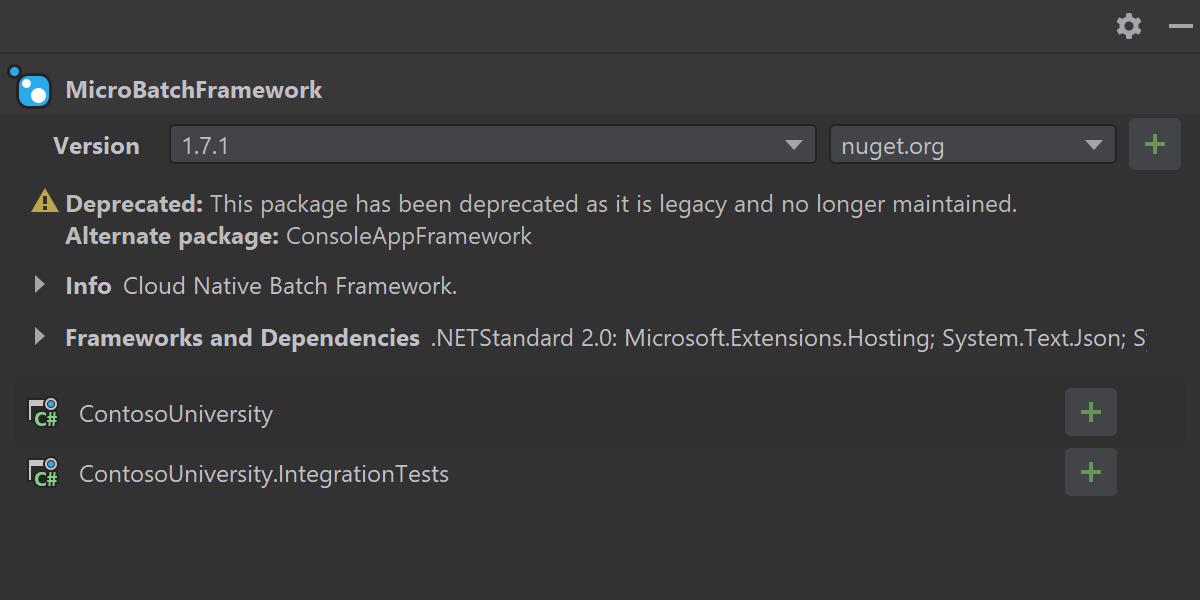
A new warning in the details pane is a visual indication of which packages are still in maintenance or have been deprecated.
F# support
Refactorings
The Introduce Variable refactoring is now available for expressions. When invoked, it shows the suitable subexpressions (unless a specific part of code is selected) and offers to replace similar subexpressions. It is also smart about naming the new variable, and suggests a meaningful name according to type and context.
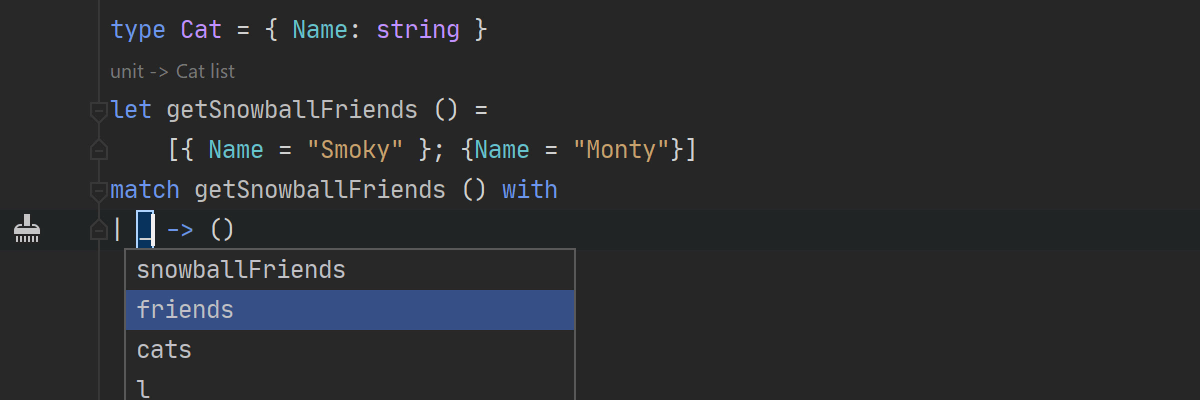
Rename now works on underscore wildcards. Whenever you need to turn a wildcard pattern into a named variable, you can call the refactoring instead of doing it manually. It also takes type and context into account when suggesting names.
Quick fixes and context actions
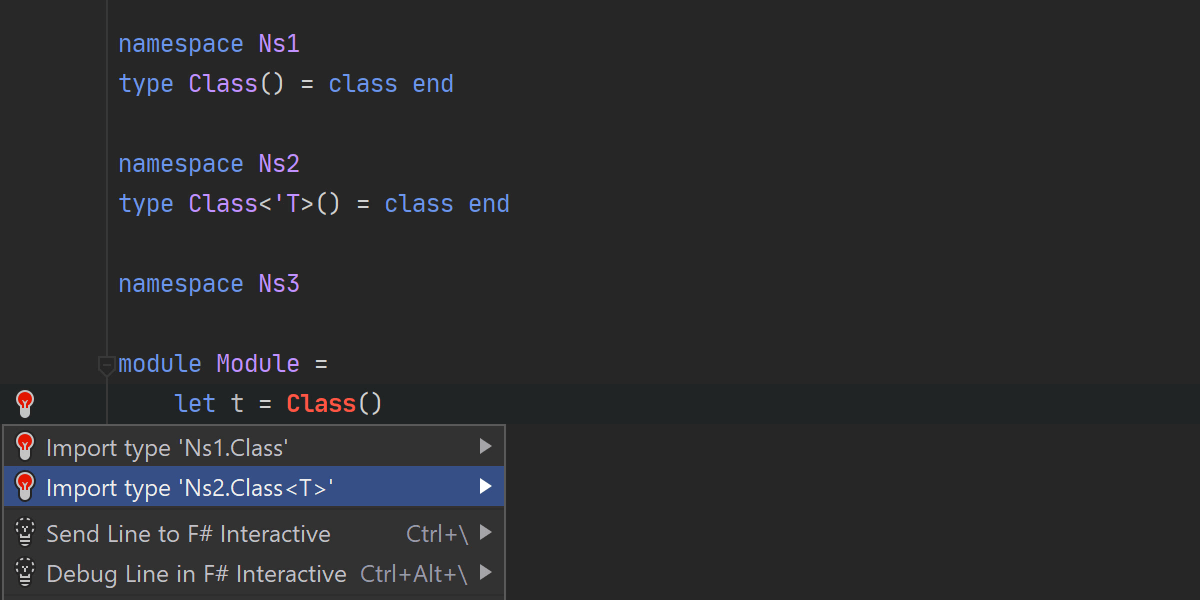
Import Type has been significantly improved. It now works in more cases and keeps the
parameter count in mind when suggesting a type. Rider can now also suggest referencing a
module or another project from your solution and import the type from it.
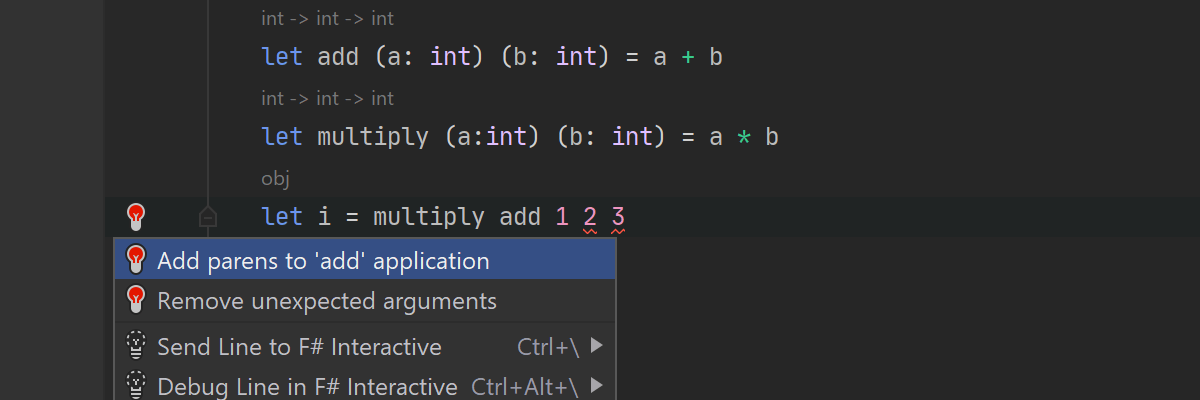
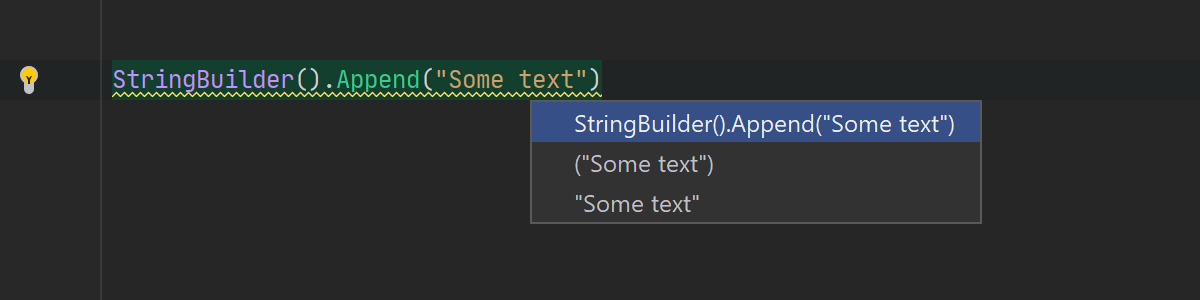
Several new quick-fixes have been added as well: adding parentheses to an application of a
function in the list of parameters, adding the Extension attribute to a containing type or
module, fixing syntax errors, converting let to use, and others.
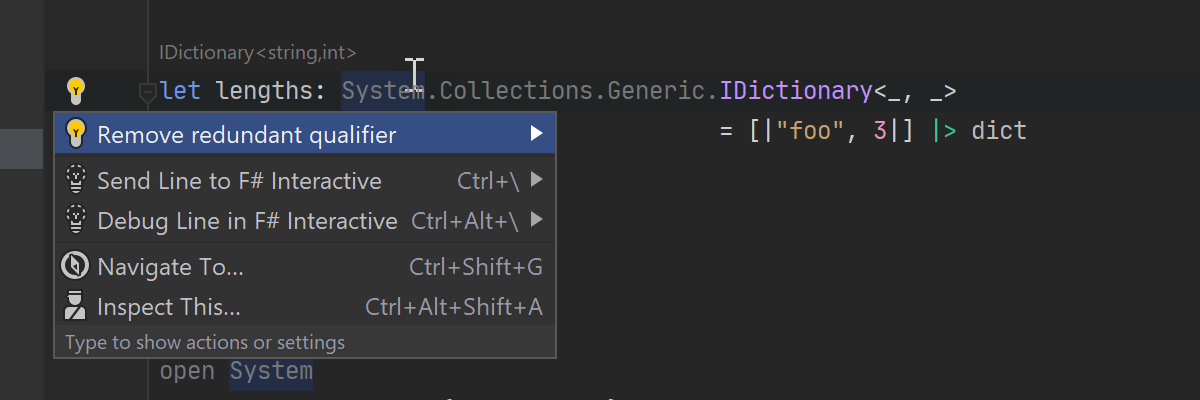
Analyzers
We’ve implemented a fast redundant qualifiers analyzer, as well as a corresponding quick-fix to remove the redundancies.
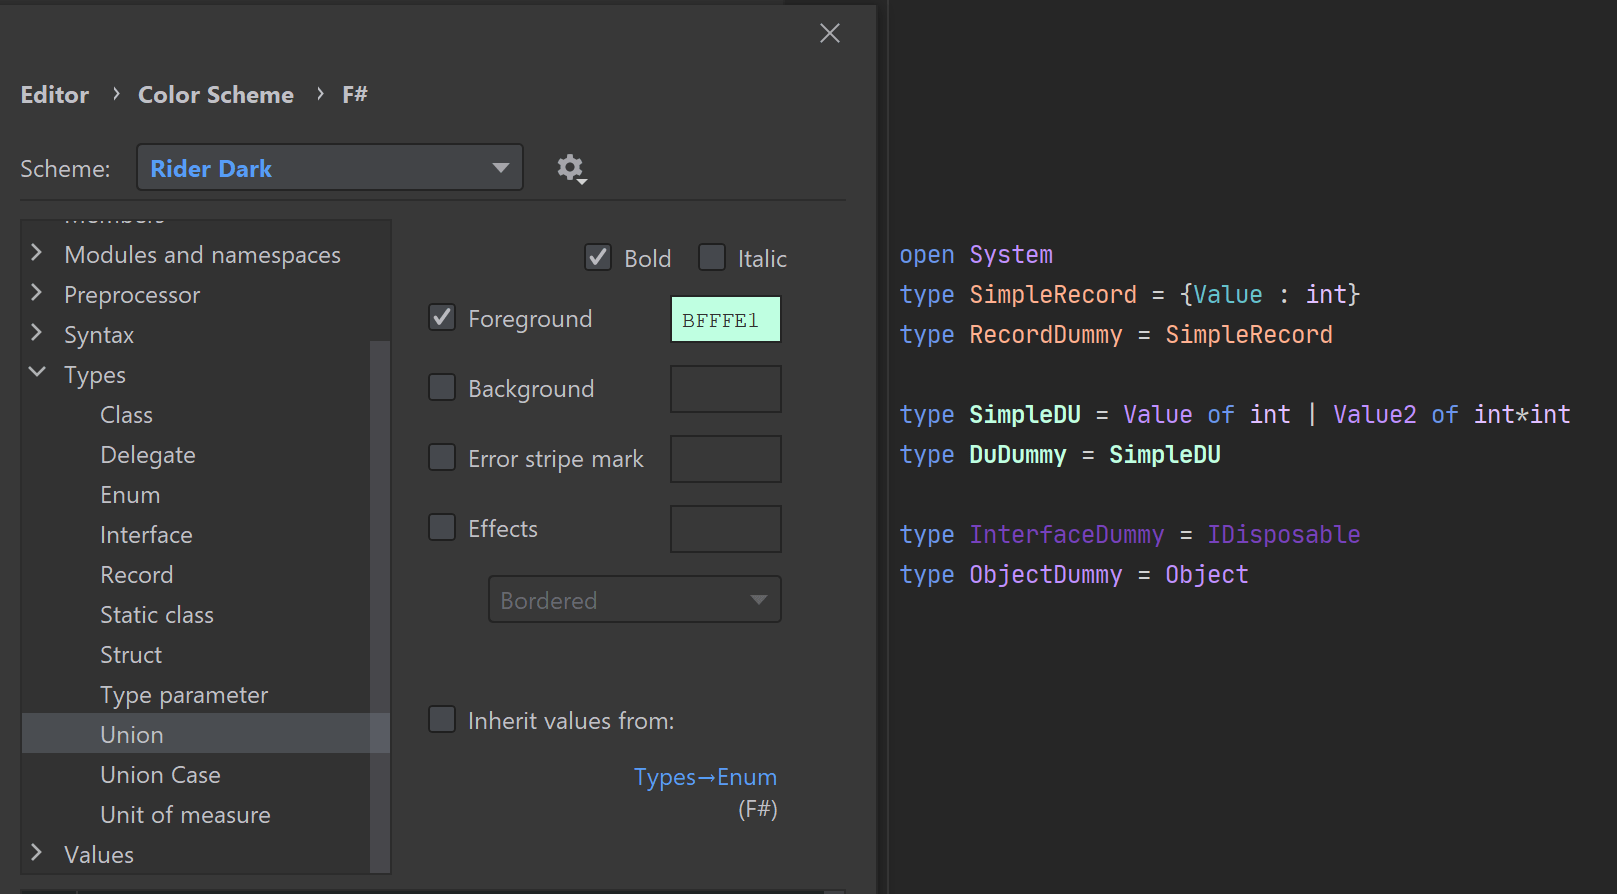
Editor
There's now more options for highlighting various symbols differently. In addition, type abbreviations are highlighted as the types they abbreviate, and functions can be highlighted as methods. Both are external contributions, and we thank Igor Bagdamyan for them.
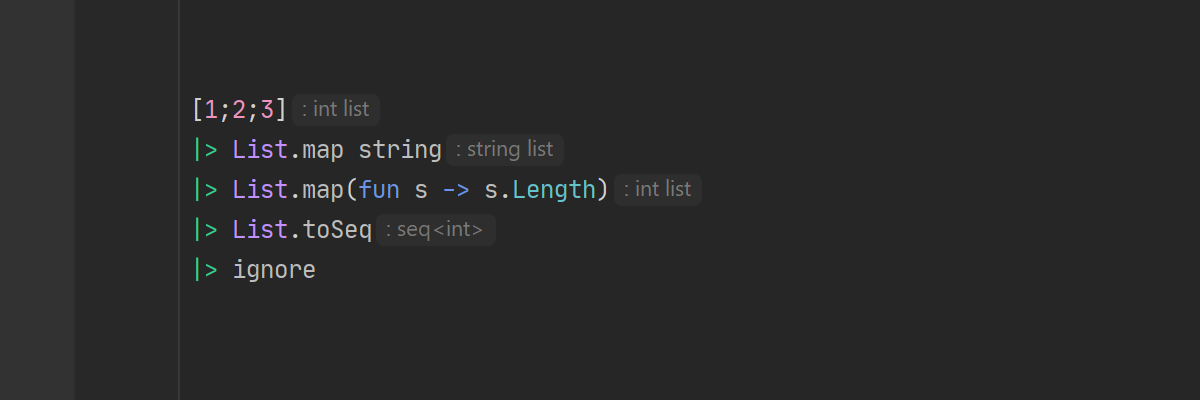
Rider now has type hints for expressions in |> chains. They help you keep track of what’s
happening without having to follow the whole chain in your mind. This too is an external
contribution, which we’d like to thank Saul Rennison
for.
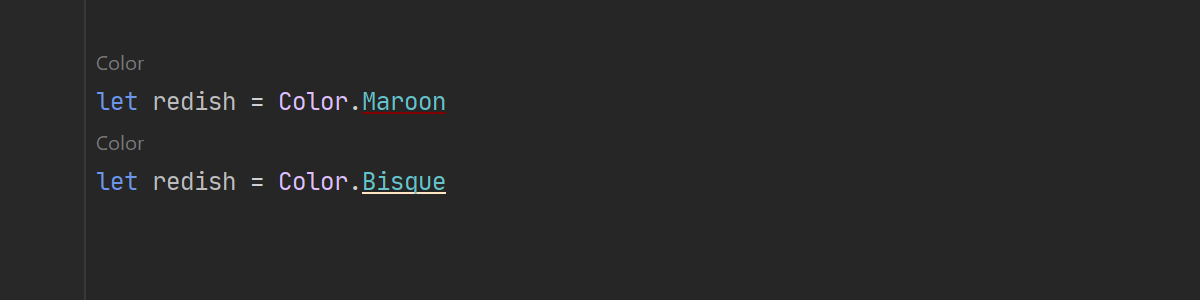
Color references are now highlighted in the code, making them more visible.
Finally, we now have an F# Compiler Service monitor – thanks again to Saul. Whenever FCS is busy, an indicator will be displayed. This is mostly a diagnostic tool: it helps the developer understand the reason why the IDE is thinking, and in the event that the behavior seems suspicious, it can be reported to the Rider team to be analyzed.
To learn more about updates in F# support, please take a look at the release notes on GitHub.
x:Bind support
We have good news for UWP developers – support for compiled bindings with x:Bind is finally here!
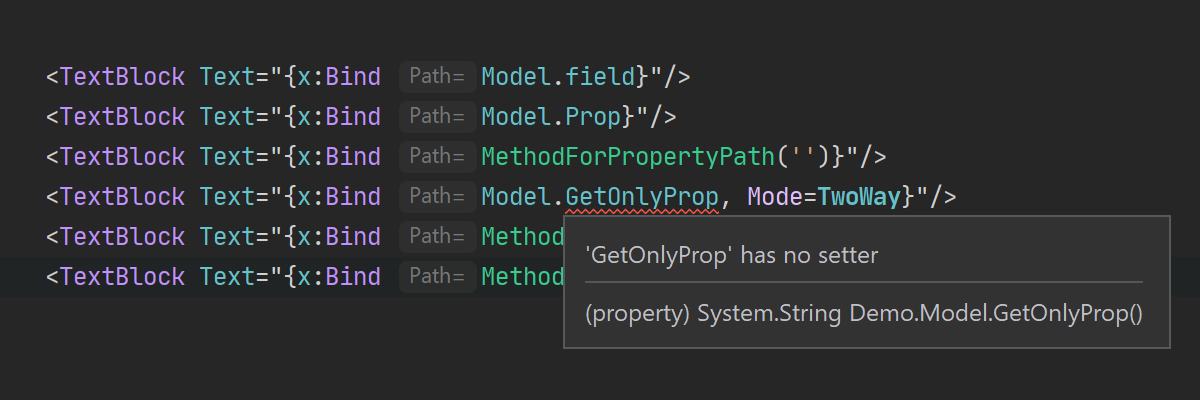
Rider resolves x:Bind code correctly and offers several inspections and
corresponding quick-fixes. It warns you about missing property setters, BindBack
attributes, and when there are overload collisions. In addition, there is a set of Create
from Usage quick-fixes to generate a proper field, property, or method inside C#
code-behind.
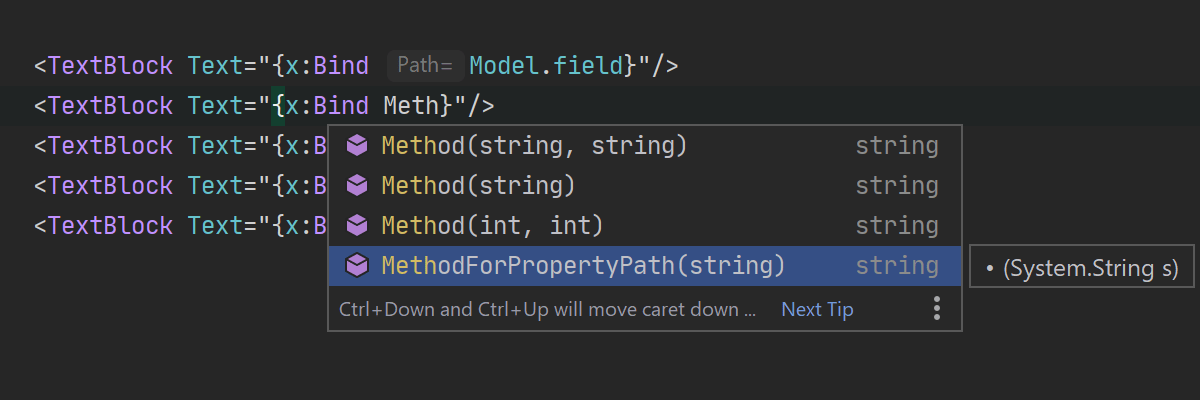
There is code completion and parameter info for propertyPath, BindBack,
and UpdateSourceTrigger attributes inside an x:Bind expression.
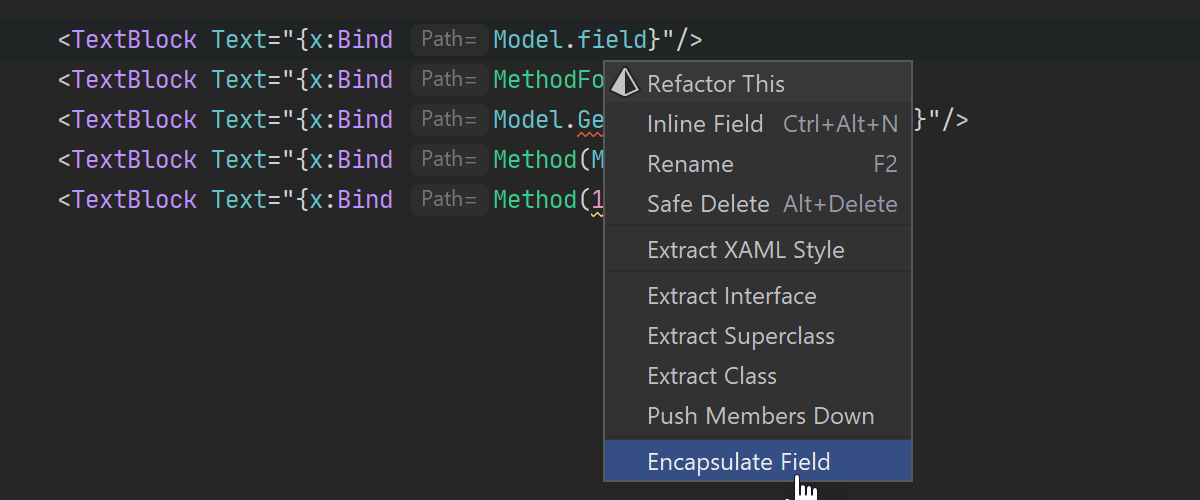
Change Signature and Safe Delete refactorings are now aware of method usage in XAML code and update them accordingly. Also, Make Static/Const and Encapsulate Field refactorings work directly from XAML code and update XAML usages correctly if you call them from C# code-behind.
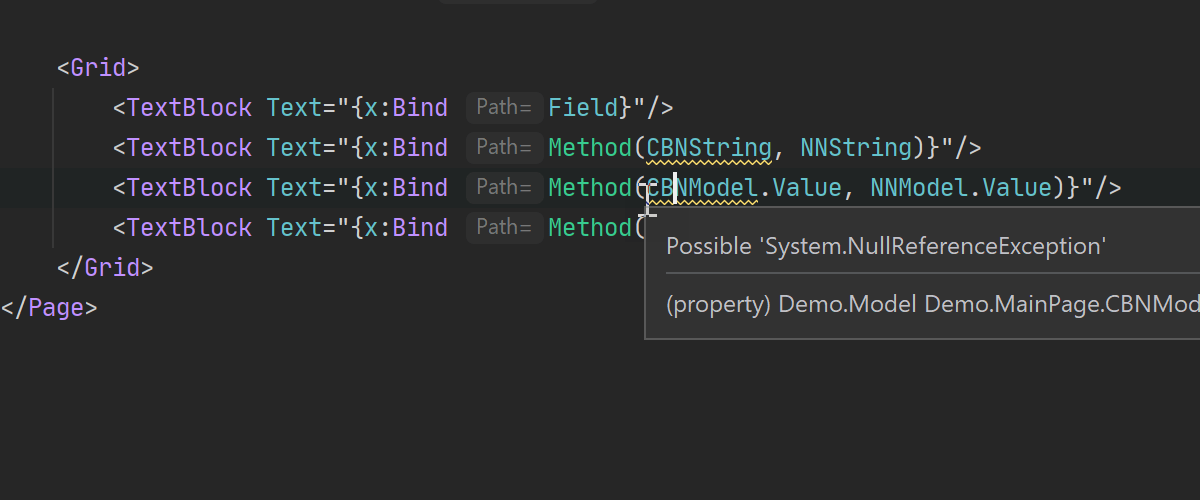
Nullability awareness is integrated into the x:Bind code analysis. Rider now
shows you null-related inspections directly inside the XAML code if there are
CanBeNull and NotNull attributes in C# code, for example, “Possible
System.NullReferenceException” and “Possible null assignment to non-nullable
entity” for arguments in a method used in a propertyPath.
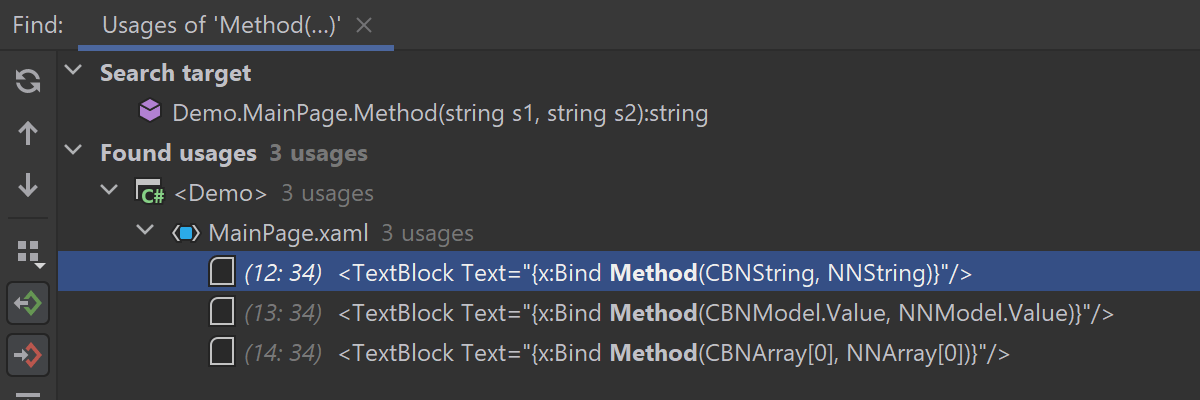
Other Rider features like Find Usages and Go to Declaration are also aware of x:Bind
bindings.
Plugins
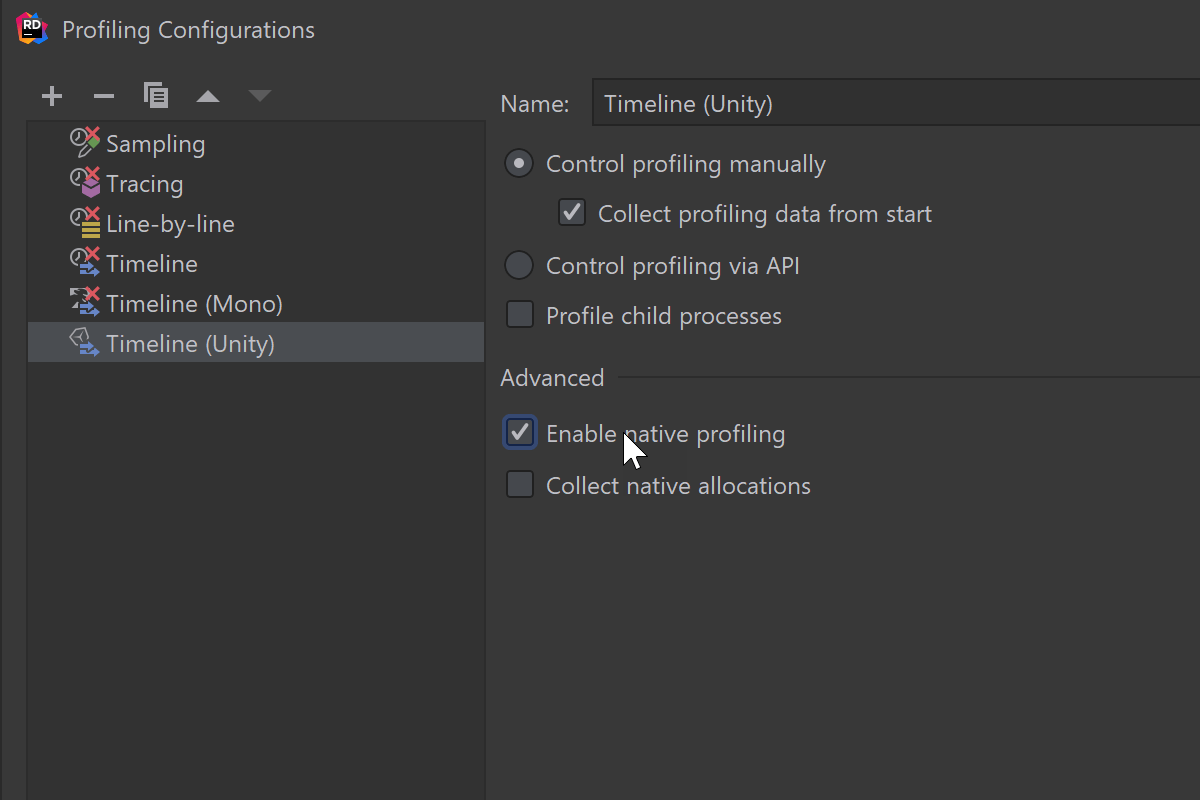
dotTrace dotUltimate
The dotTrace plugin can profile the native part of Mono/Unity applications on Windows. Start a session with the Enable native profiling option and you’ll see both native and managed call stacks in performance snapshots.
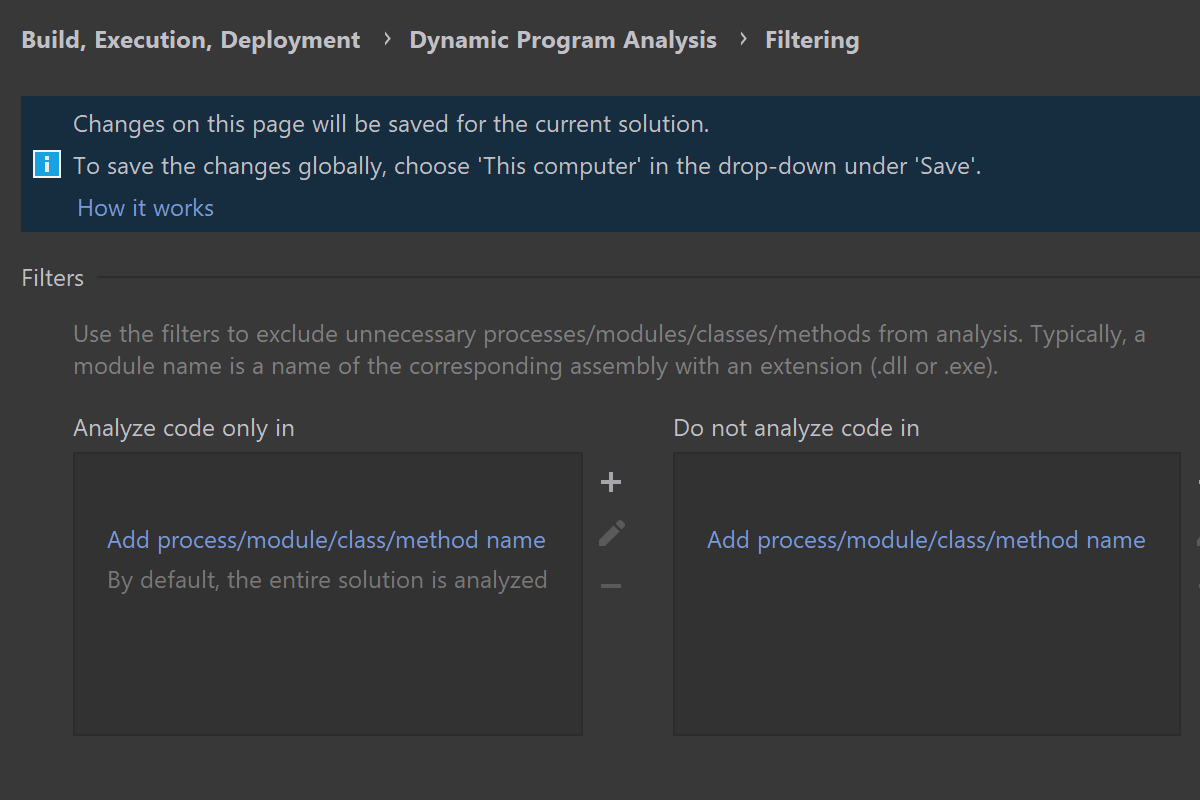
Dynamic Program Analysis
Now, you can filter by process/module/class/method in Settings/Preferences |
Build, Execution, Deployment | Dynamic Program Analysis | Filtering to narrow the
scope of Dynamic Program Analysis.
- If you need to analyze only some specific method/class/etc., add it to the Analyze code only in list.
- If you need to hide some specific method/class/etc. from analysis, add it to the Do not analyze code in list.


dotCover dotUltimate
The new release brings several useful features to the dotCover plugin:
- The Unit Tests Coverage window now lets you export coverage reports.
- The Unit Tests Coverage window now has a quick search feature.
-
You can now navigate from a symbol in code to that symbol in the coverage tree
(
Navigate to | Coverage Treeor using theNavigate from Editoricon on the toolbar in the Coverage tool window).


Azure Toolkit for Rider
After you install Azurite storage emulator using npm (npm install -g
azurite), an Azurite node will be added to the Services tool window. From
here, you can start, stop, and clear the storage emulator.
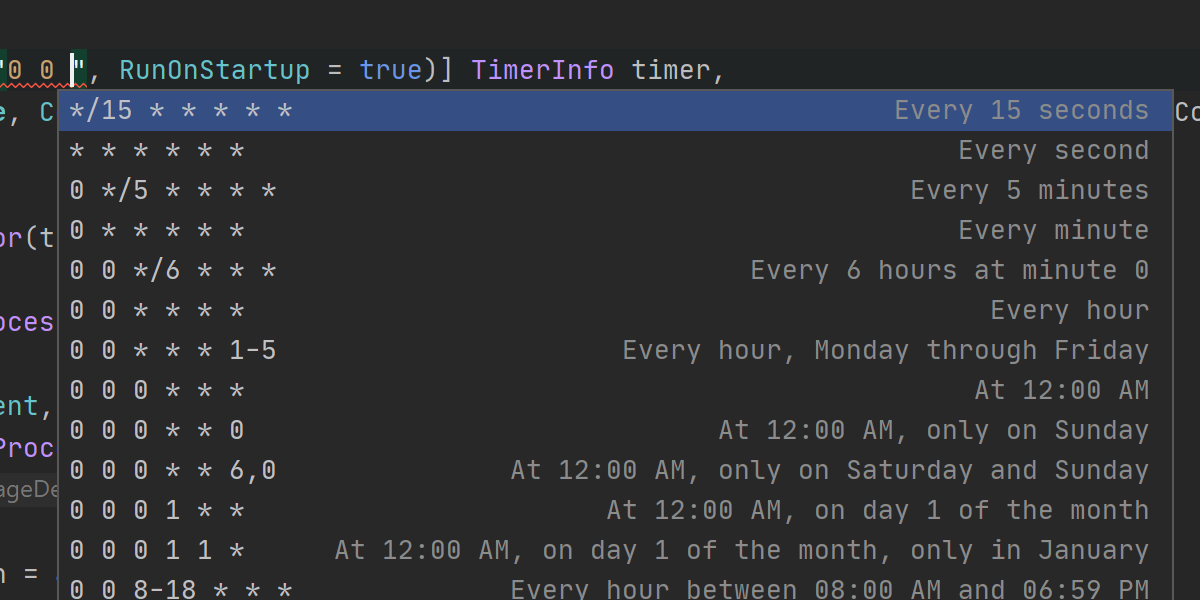
When you’re using timer triggers in Azure Functions, you have to enter a valid
NCrontab
expression that defines when the function will be executed. The Azure Toolkit for Rider now
helps you edit the crontab by providing code completion with several example expressions
from which you can start working.
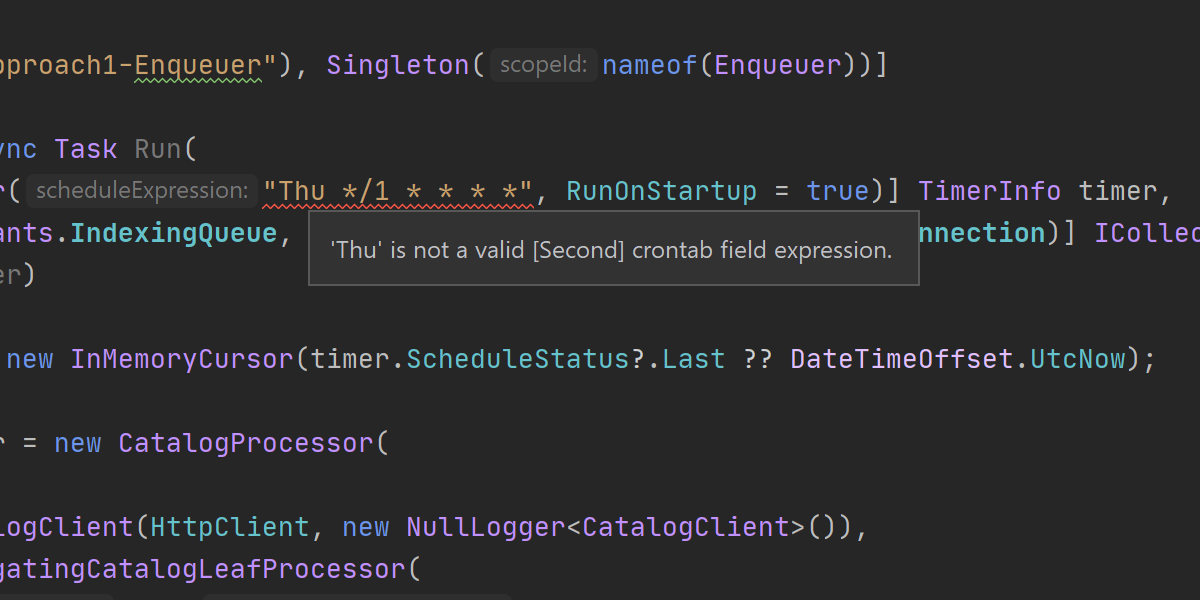
Rider now validates whether an NCrontab expression is valid or not, and gives you extra information about what may be wrong.
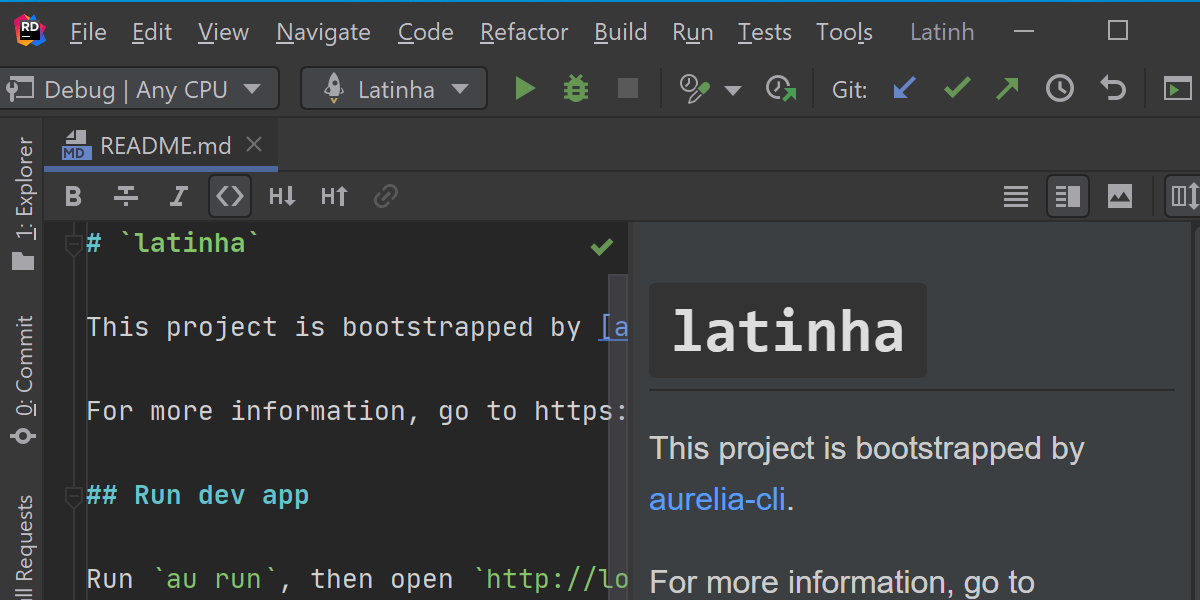
Markdown plugin
Say hello to Markdown support in Rider! Rider 2020.2 comes bundled with the Markdown plugin. It recognizes Markdown files in your solution, provides a dedicated editor for them, and shows the rendered HTML in a live preview.
Godot support
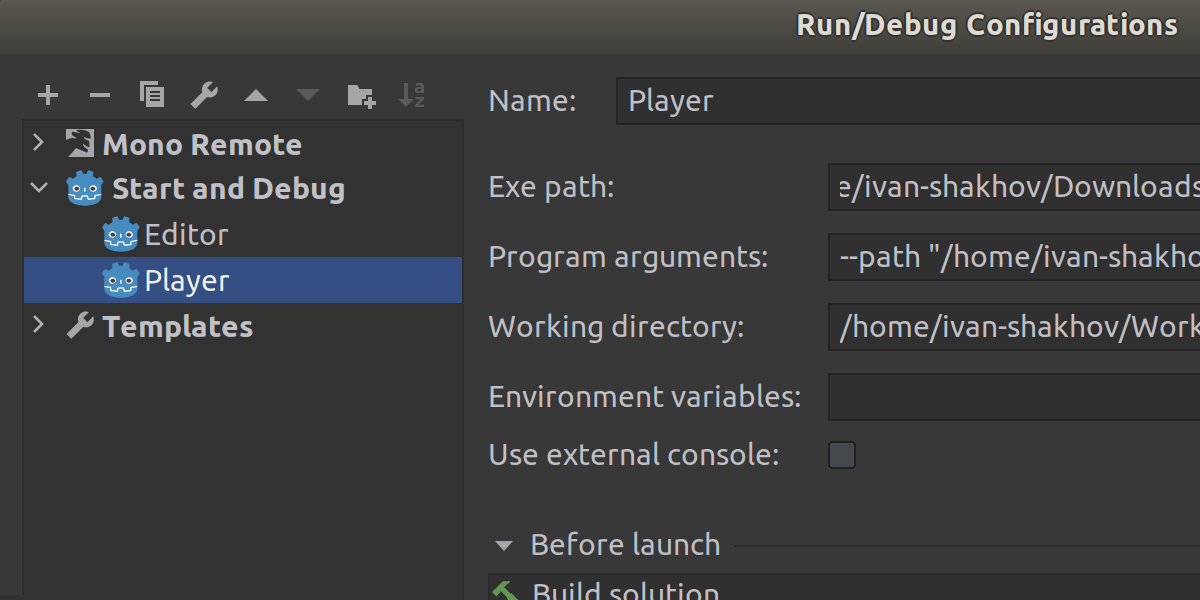
Godot run configurations have been reworked. You can run, debug, and run with profiling Player and Editor run configurations. In addition, you can edit the command line parameters which is used to run both player and editor.
Also, you can now launch run or debug for individual scenes right from the context menu in the Solution Explorer view.
Database support
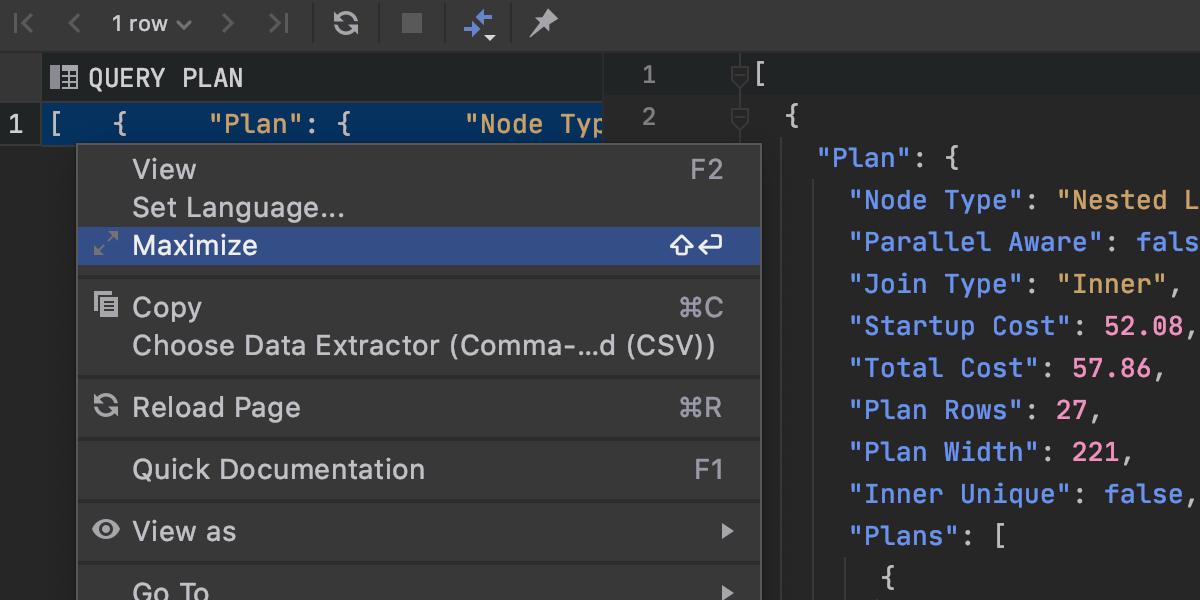
Separate editor for cell values
Now if you have a huge value in your cell, you can view and edit it in a separate panel. You can also toggle soft wrap mode using the right-hand toolbar. Use all the power of Rider’s code editor for your data!
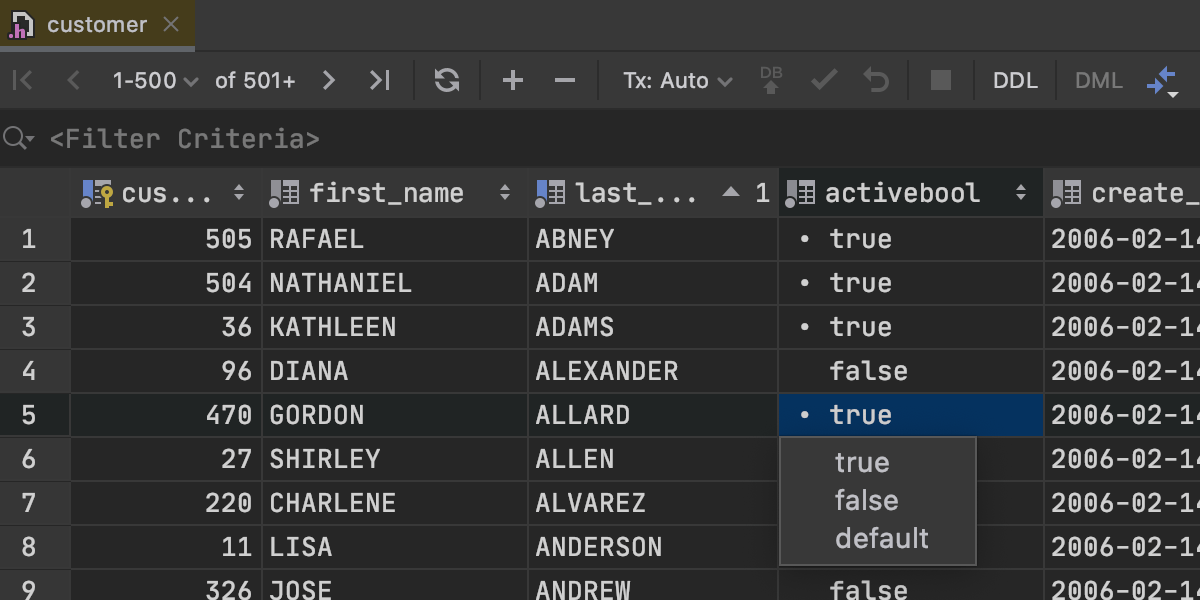
A new UI for boolean values
There’s now a more user-friendly way to view and edit boolean values. True values are now marked with a bullet point to distinguish them from all the others.
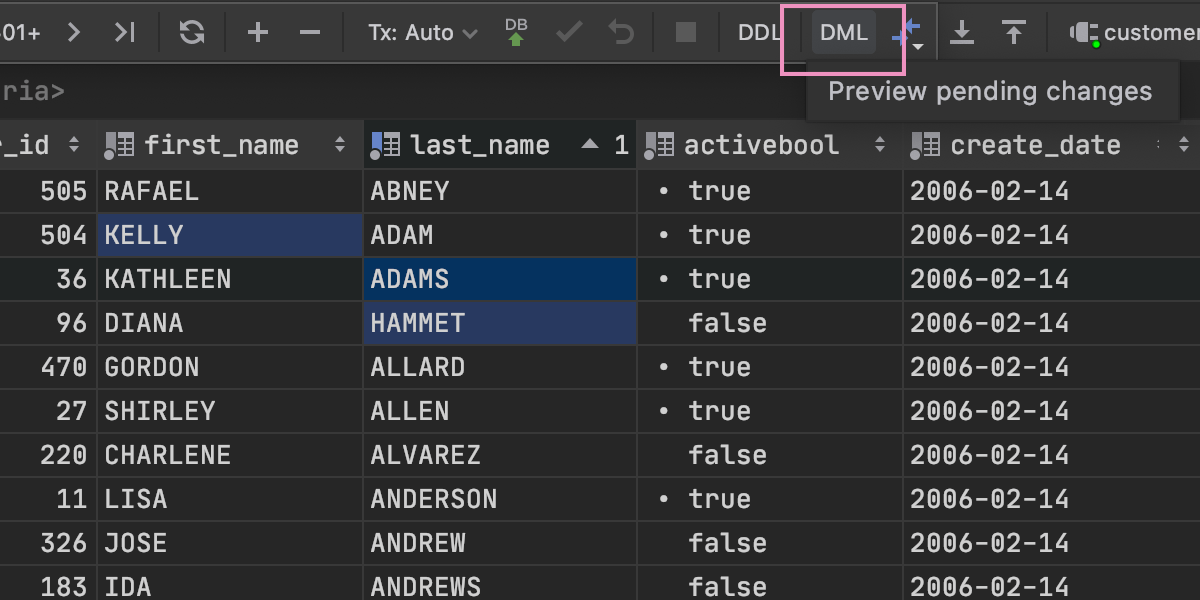

DML preview in the data editor
Starting with this version, you can review the query that represents your changes in the data editor. There is now a DML icon that is active if there are pending changes. On clicking on the icon, you will see a dialog with the DML preview. This query is not necessarily the exact SQL that will be run to modify your data, because Rider uses a JDBC driver to update tables, but most of the time it will be the same.
Check out What’s New in DataGrip for all the database improvements that are also available in Rider 2020.2.
Web development
Save time with new features for JavaScript
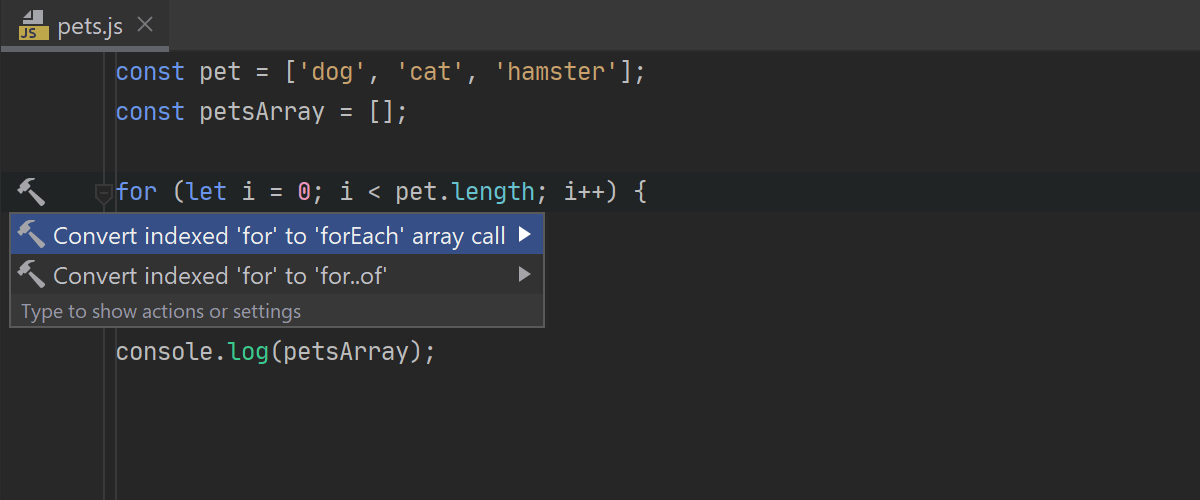
New smart intentions (Alt+Enter) will help you perform some actions faster. For
example, you can now quickly convert a for loop with a numeric index into a forEach
array method. Looking through documentation comments in JavaScript and TypeScript files has
also become easier as you can now render them right in the editor, minimizing all
distractions.
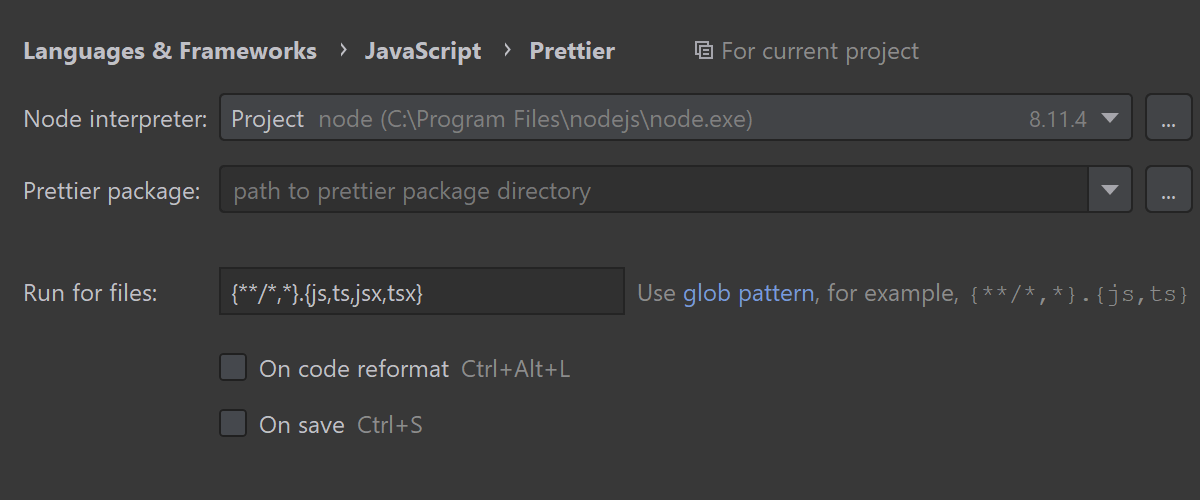
Make Prettier the default formatter in your JavaScript projects
Want to use Prettier instead of the built-in formatter to tidy up your code? With
this update, it has become even easier than before. Install the plugin from the JetBrains
Marketplace and then, on the Settings/Preferences | Plugins page, tick the new
On code reformat checkbox and the IDE will use Prettier whenever you reformat your
.js, .ts, .jsx, and .tsx files. Other file types can be
easily added, too.
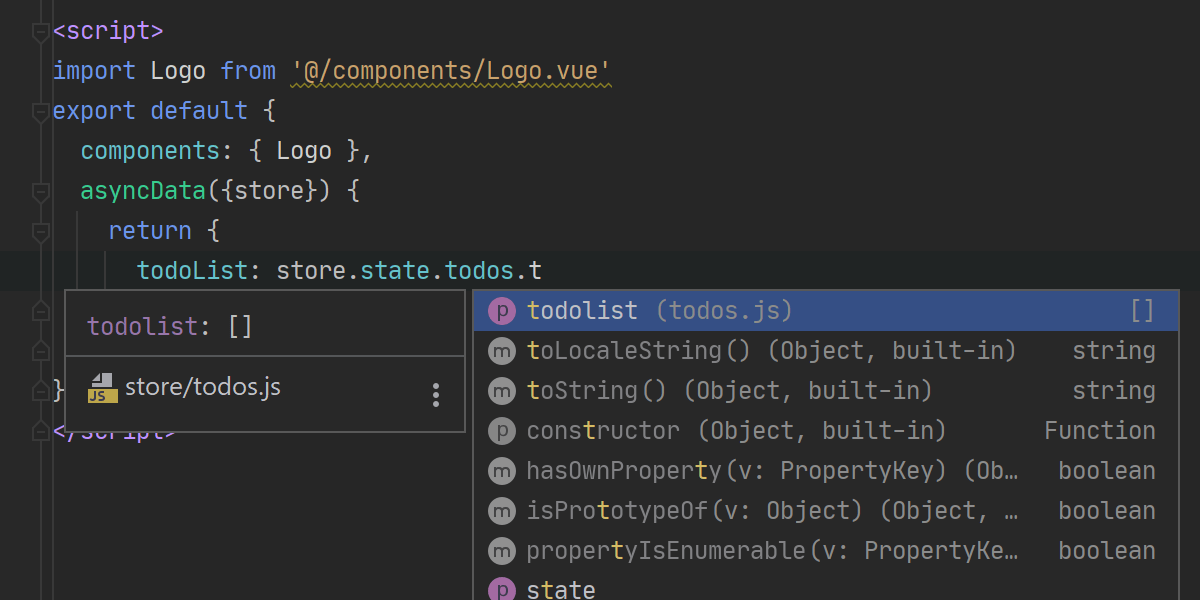
Enjoy best-in-class support for Vue
In the past year we’ve added Nuxt.js support, Vue-specific code style settings, improvements around Vue in TypeScript projects, and a lot of other updates. Vue support in Rider has never been so advanced!
Check out What’s New in WebStorm for all the web development improvements that are also available in Rider 2020.2.
Refactorings
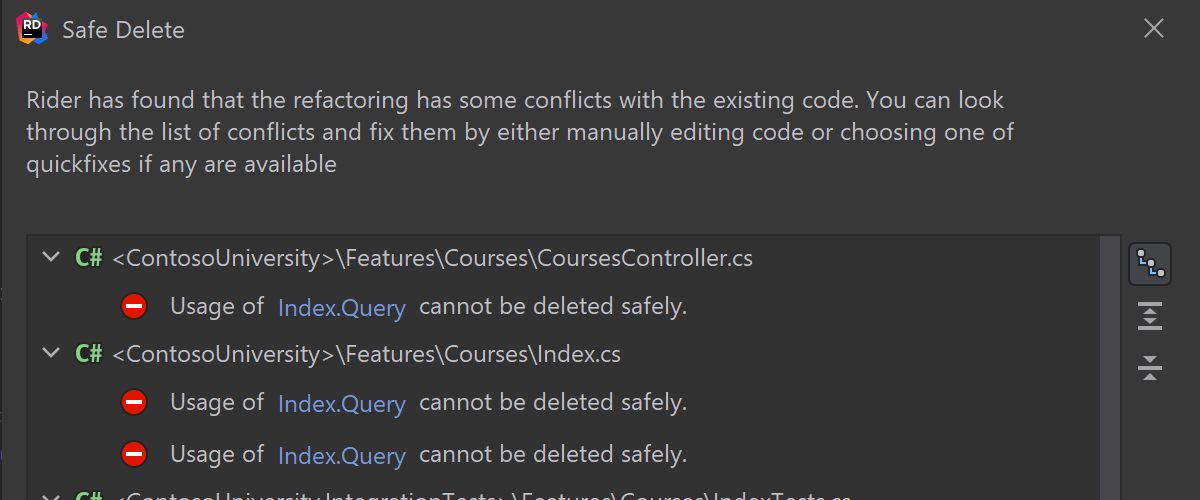
In this release, the Conflicts dialog has been redesigned as a separate step in the Refactorings interface. The plain list from before has been replaced with a tree grouped by file. To return to the plain list, click on the Flatten icon on the right toolbar.
When calling Introduce parameter or Introduce field refactorings on an expression, Rider asks which part of the expression the refactoring should be applied to.
Other updates
Xamarin
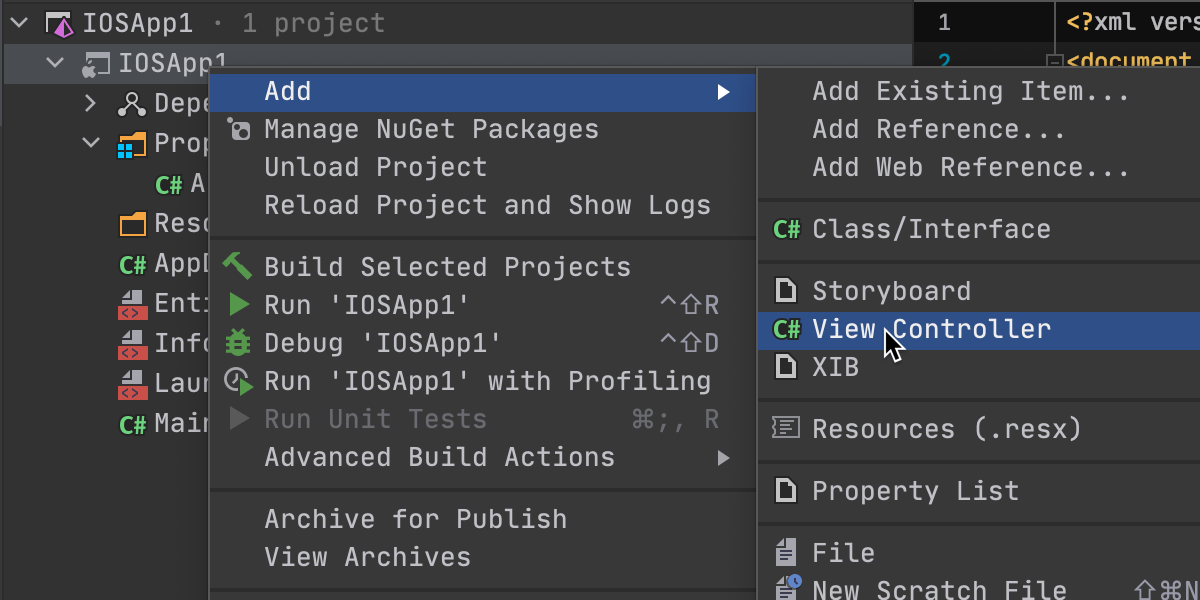
There are a couple of notable updates:
- File Templates are available in both macOS and iOS Xamarin projects.
-
We’ve improved XCode synchronization – when there's no “
.Designer.csfile”, Rider now generates one instead of displaying an error.
Last but not least
- New presentation of the search results in Search Everywhere.
- We now support attaching the debugger to .NET Сore runtime hosting configurations and running them with debug.
- Run configurations are generated for all runnable projects.
-
ProjectReferencesfor website projects are now supported.