What’s New in Rider 2024.1
Rider 2024.1 offers a new feature to monitor your application’s performance and gather key metrics, sticky lines to better understand where you are in your code and navigate more quickly through it, and the updated New Project dialog for faster and easier project configuration. This update assists you while debugging by providing the collections visualizer and displaying the stepping time between two breakpoints. Game developers can benefit from a new set of features for the popular Unity asset Odin Inspector and support for Unreal Engine’s Slate UI framework.
Key updates
New Monitoring tool window
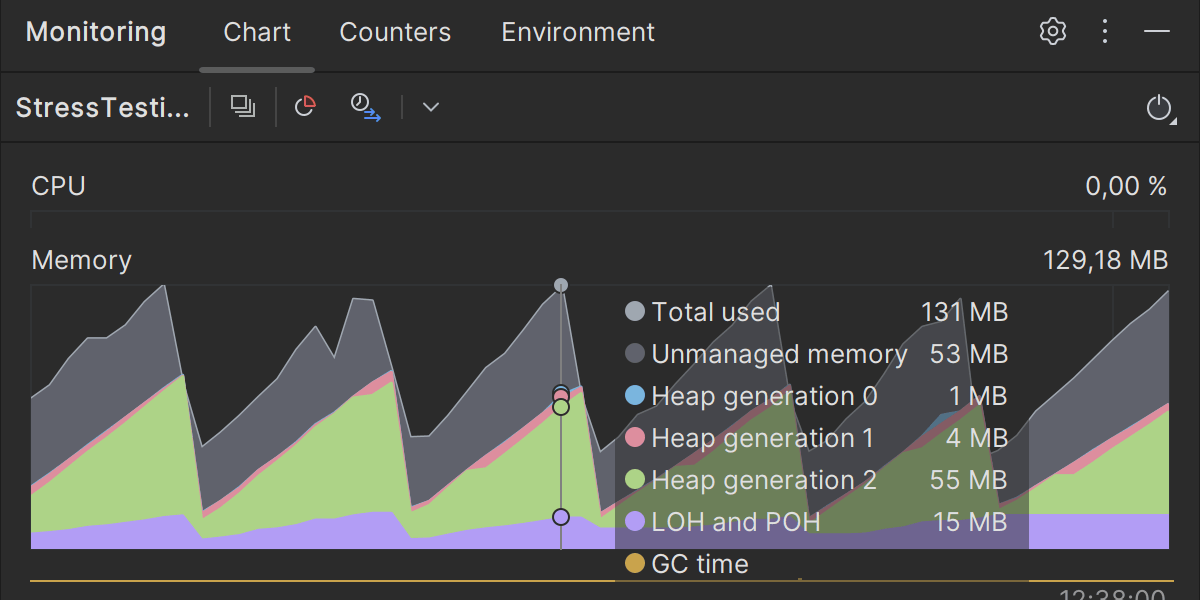
Rider 2024.1 sees the introduction of the Monitoring tool window that lets you monitor your .NET application’s performance and gather key metrics in the background while running or debugging.
Sticky lines
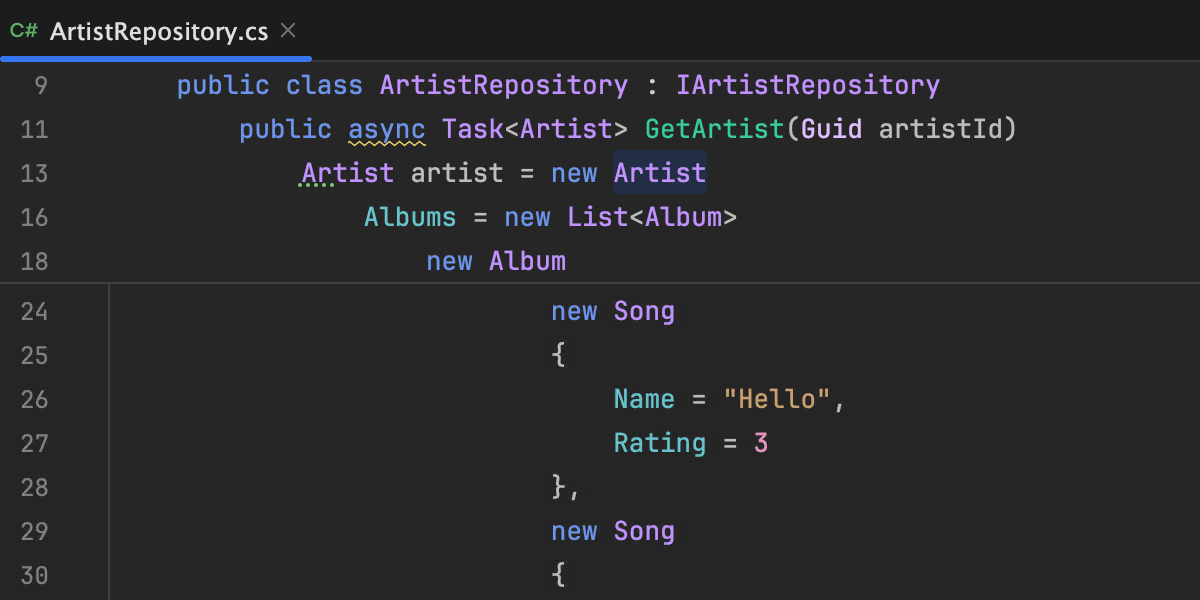
We've introduced sticky lines to the editor to simplify working with large files and exploring new codebases. This feature keeps key structural elements, like the beginnings of classes or methods, pinned to the top of the editor as you scroll. This way, scopes always remain in view, and you can quickly navigate through the code by clicking on one of these pinned lines.
Collections visualizer
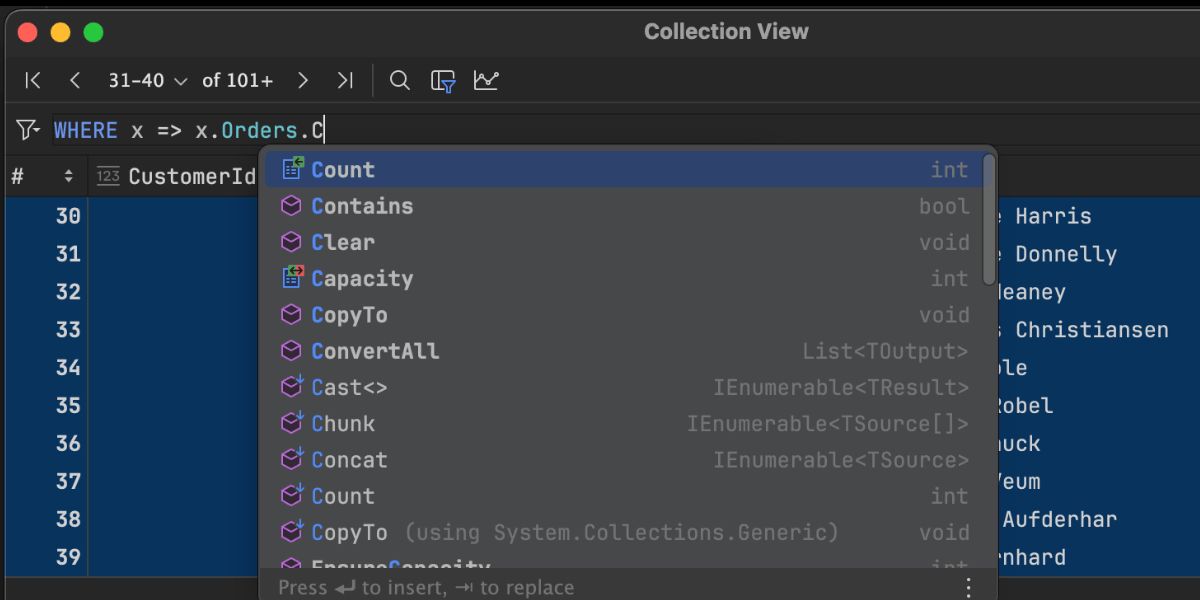
Inspect collections, such as arrays, lists, dictionaries, and other enumerable types, to better understand the state of your program's data during debugging and identify any potential problems related to data handling.
Updated New Project dialog
We have thoroughly reworked the New Project dialog to make new projects easy to configure. It provides comprehensive support for .NET-specific project configurations and custom template parameters, and you can now install the target SDK and the appropriate MAUI workload right from the dialog.
UX/UI
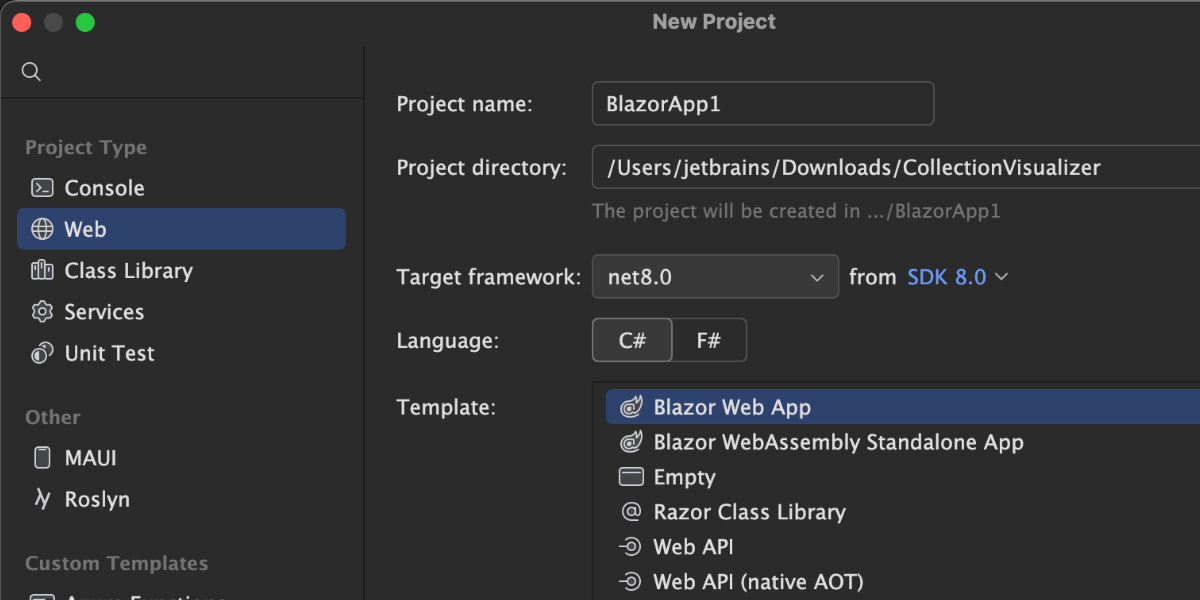
Updated New Project dialog
We have thoroughly reworked the New Project dialog to reduce cognitive load during the configuration of new projects. Here’s what you can expect from the updated dialog:
- Support for all .NET-specific project configuration options, e.g. a check-mark for progressive web apps when creating a Blazor WASM application.
- Support for parameters in custom project templates.
- The ability to install your solution’s target SDK right from the dialog.
- The ability to install the appropriate MAUI workload from the dialog.
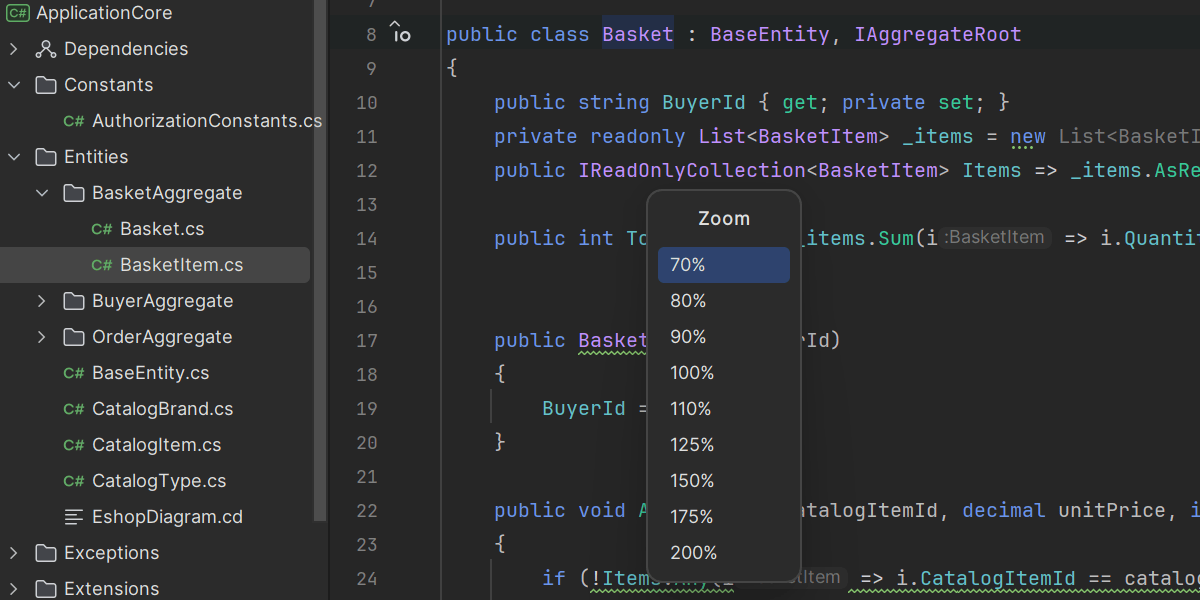
Option to scale down the entire IDE
Previously, it was possible to zoom in and out across the entire IDE, simultaneously resizing all UI elements. However, the original scaling was limited to a range of 100–200%. Now, we’ve added the ability to decrease the IDE’s scale down to 70%, giving you more flexibility when it comes to the size of everything.
Revamped Terminal tool window
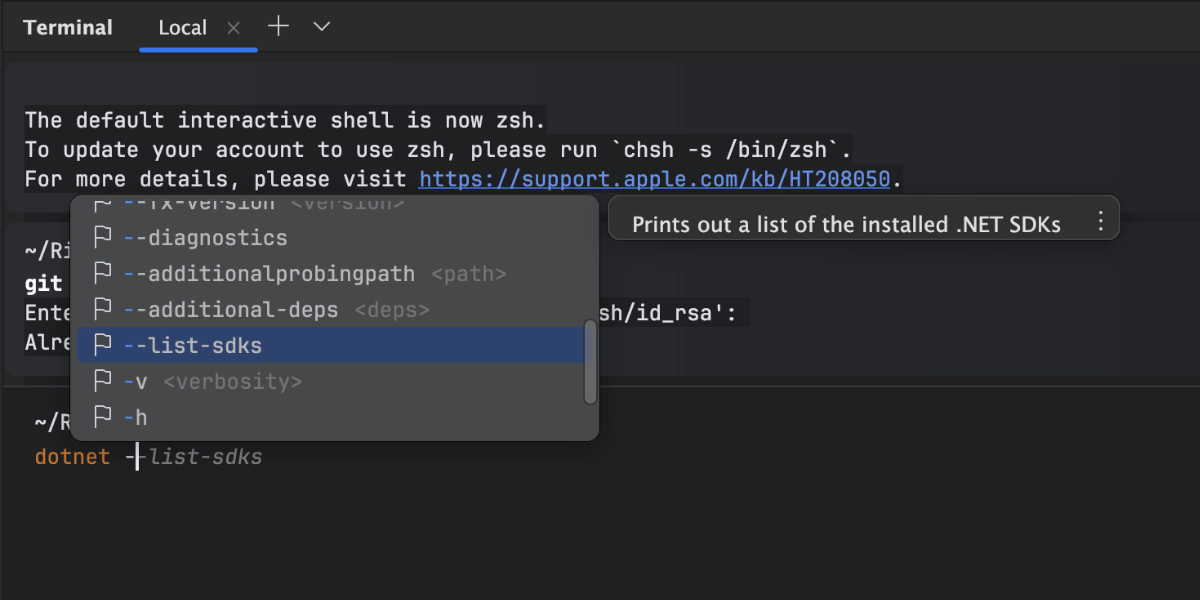
This build brings an overhauled Terminal tool window that gains both visual and functional enhancements designed to elevate the convenience and simplicity of terminal-based tasks. This update both improves the tool visually and expands its feature set.
You can enable the new terminal in Settings/Preferences | Tools | Terminal | Enable New Terminal.
For more information on the revamped terminal, check out this blog post from IntelliJ IDEA.
Code analysis
С# support
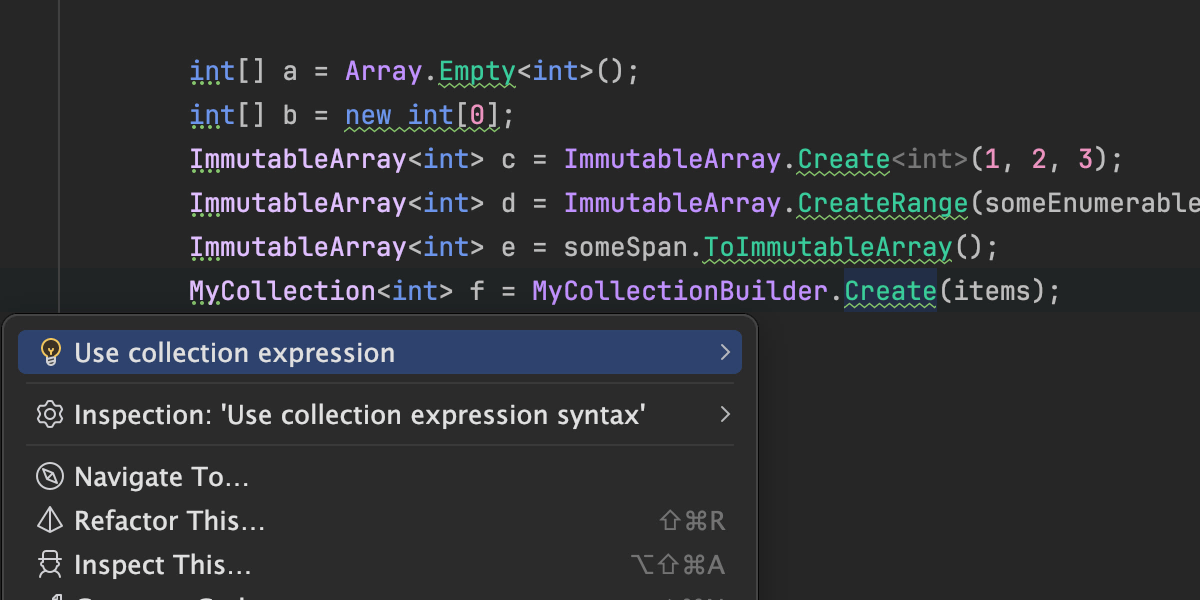
More conversions to collection expressions
Now, you will get suggestions to convert more code constructions
in your source code to collection expressions from C# 12, such
as an empty array or the ImmutableArray declaration and
initialization.
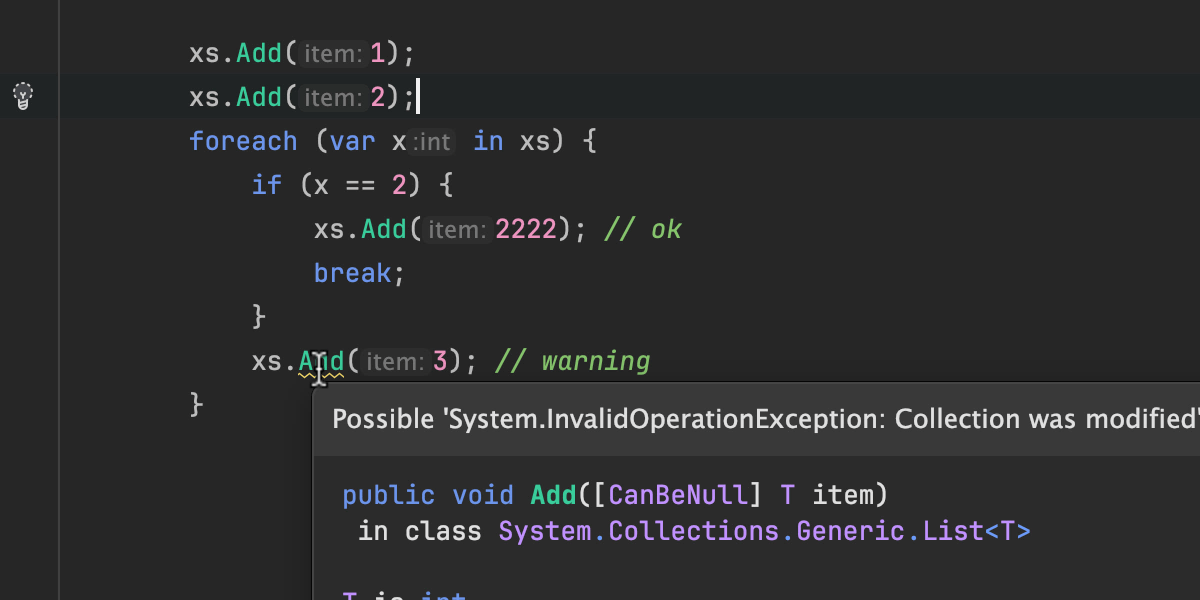
Collection was modified analysis
We’ve added the new Possible 'System.InvalidOperationException:
Collection was modified’ inspection, which will warn you when a
collection was modified while iterating inside foreach loops,
since this modification might lead to an exception in runtime. This
analysis is aware of cases when there is an exit from the loop after
a collection's modification, and these cases won’t trigger the warning.
The inspection comes with a corresponding quick-fix to help you
solve this issue instantly.
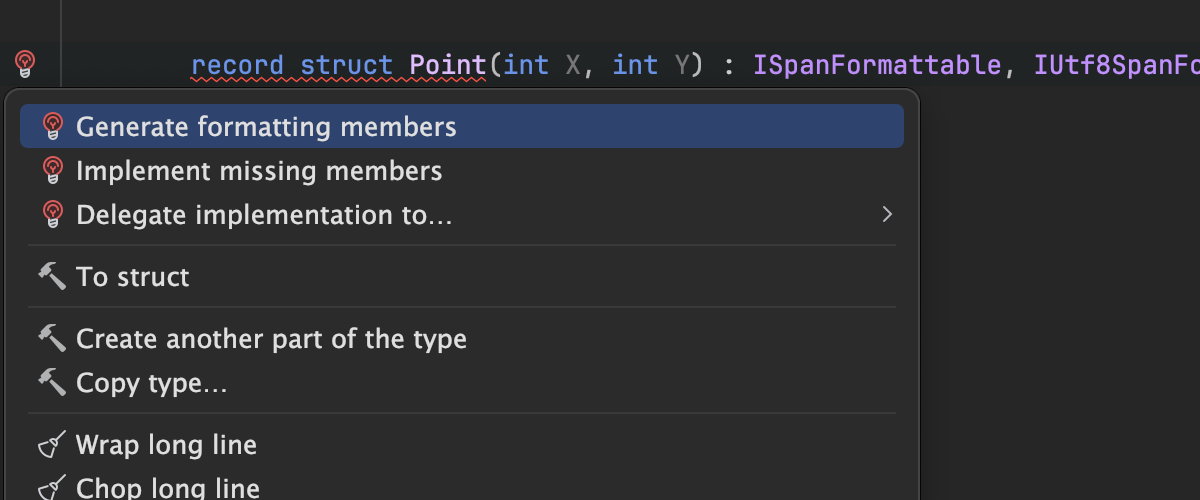
Generate | Formatting Members update
Generate | Formatting Members allows you to generate boilerplate
code to override the ToString() method and return a meaningful
string for your types. Starting from the 2024.1 version, this feature
supports more types, such as ISpanFormattable,
IUtf8SpanFormattable, and IFormattable.
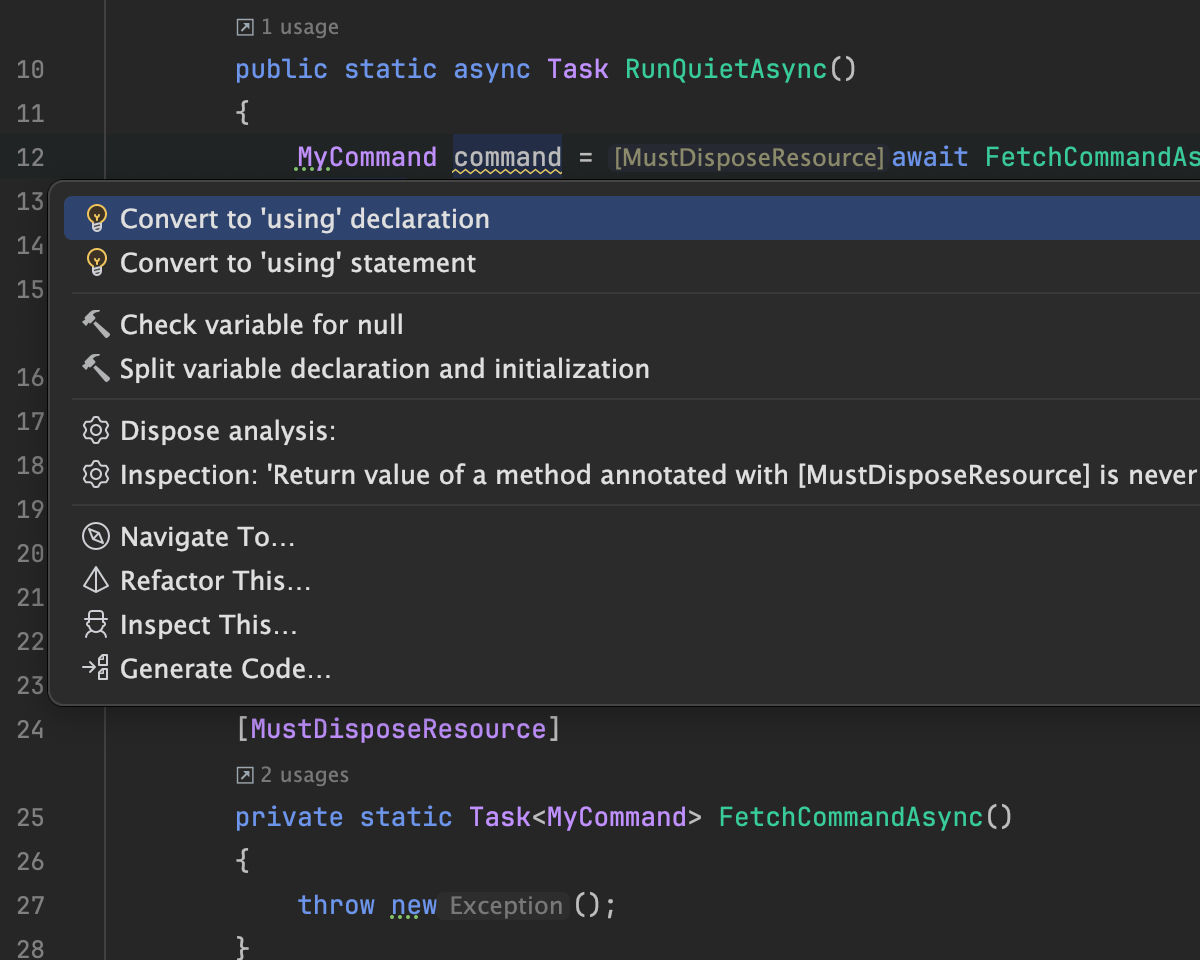
Enhanced support for disposable resources in async methods
-
[MustDisposeResource]Annotation improvements: C# code analysis now ensures that resources returned by async methods, including those wrapped inTask<IDisposable>andValueTask<IDisposable>, are disposed of correctly, helping you avoid unintended disposal of the task itself. -
Task-like return values: Correct analysis for task-like return
values in the 2024.1 version ensures the awaited resource is
checked for disposal and also includes resources retrieved via
.ConfigureAwait(...),.AsTask(), or.Result.
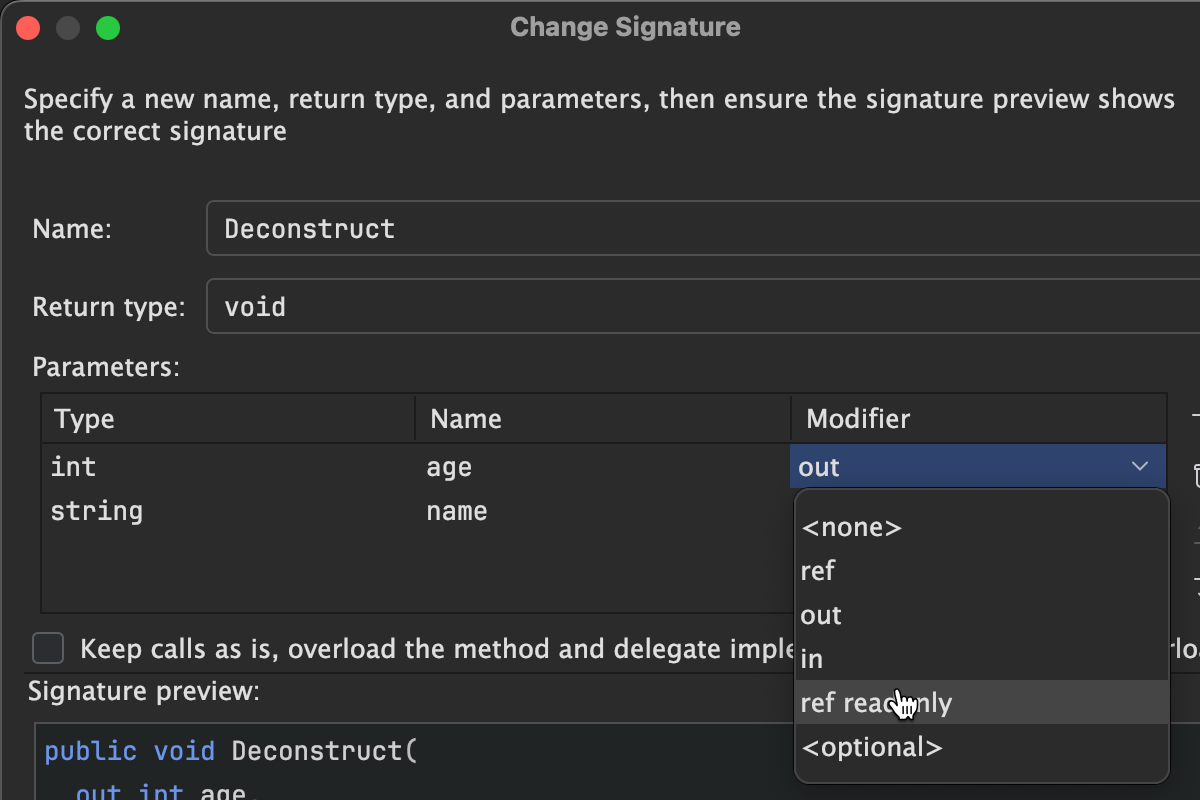
Updates to the Change Signature refactoring
Here are some of the improvements we’ve made to the Change Signature refactoring:
-
The refactoring now supports
Deconstructmethods. You can add, remove, rearrange, and rename parameters, and these changes will be reflected in both the method declaration and its usages. -
Code completion is now available for type parameters. This
means that when you need to specify a type for a
List<>, for example, you can use code completion to easily select the desired type, such asint. -
Type namespaces are automatically shortened when adding or
updating parameters. This helps keep the code clean and
simplified after applying the refactoring. For example, if
you specify the
System.Collections.Generic.List<System.Int16>type in the Change Signature dialog, it will be automatically shortened toList<short>in the resulting code. - The refactoring now supports more features from the last versions
of C#, such as
inandref readonlymodifiers andrecordtypes.
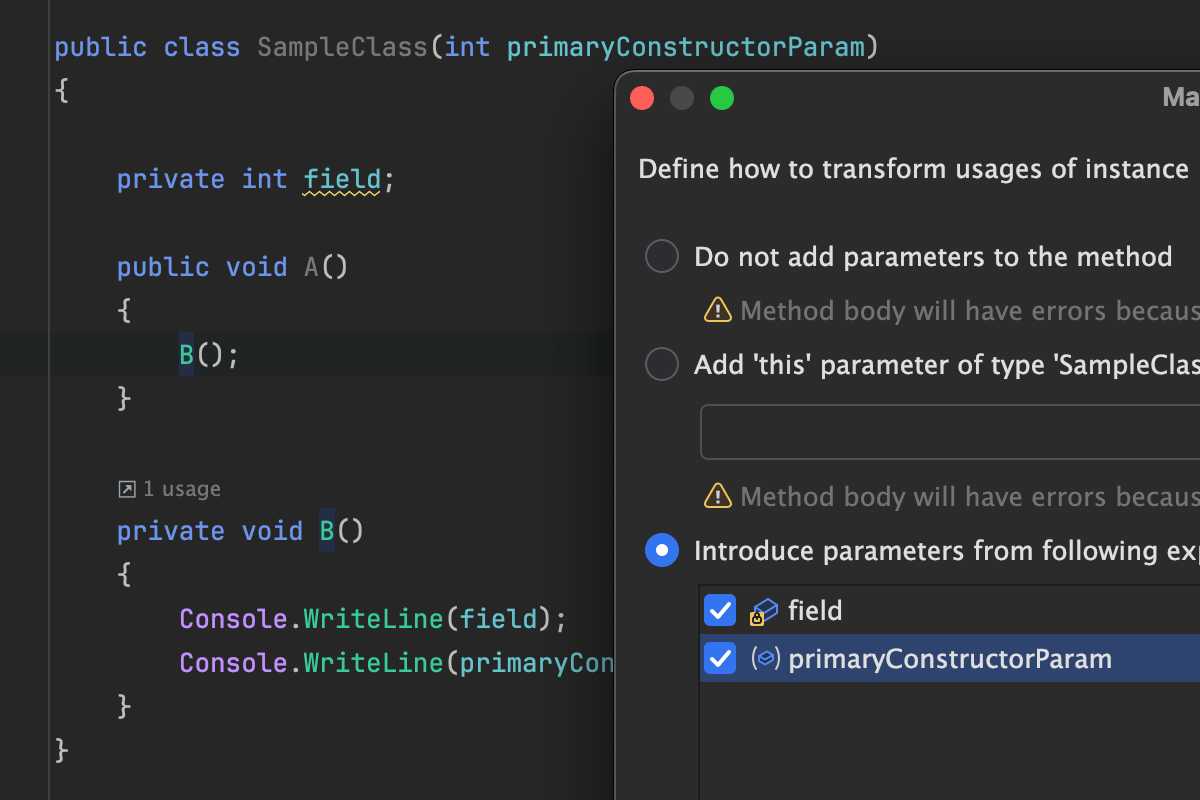
Updates to the Make Static refactoring
In this release, the Make Static refactoring supports primary constructor parameters. They appear in the Introduce parameters list and have a separate icon to help you distinguish them easily. This refactoring is also available for local functions.
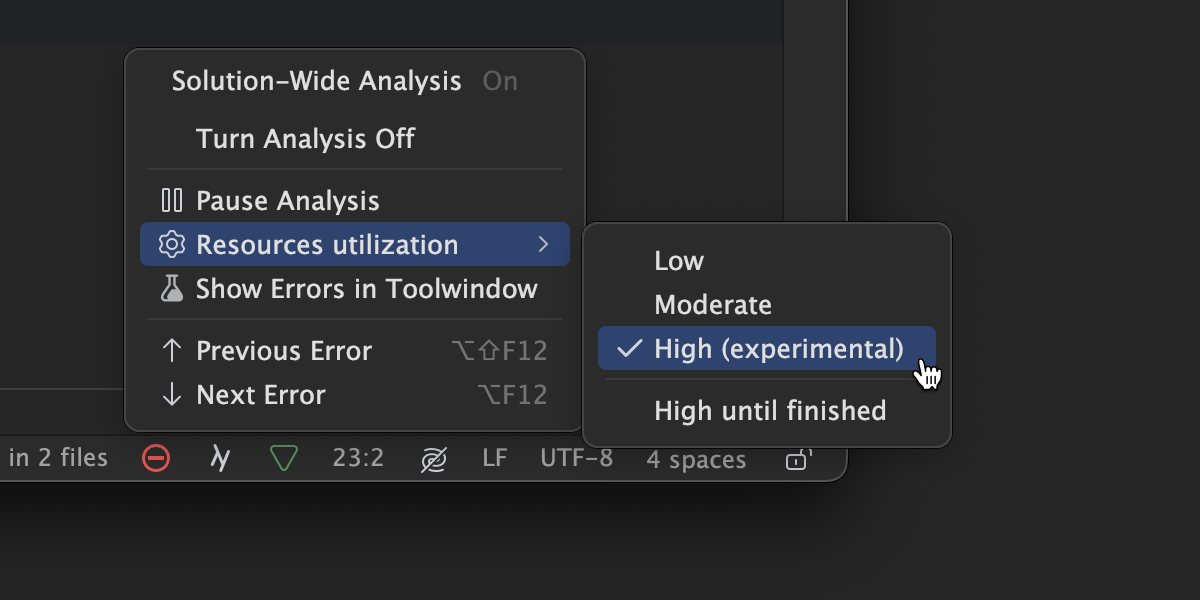
High resource utilization mode in solution-wide analysis
We are actively refining high resource utilization mode for solution-wide analysis, which will significantly reduce analysis duration by using CPU parallelism more efficiently. We've improved the memory allocation profile of code analysis activities to minimize the time spent on garbage collection. While the refinement process is ongoing, we would appreciate it if you would enable this mode and provide feedback on your experience.
Performance
- Renaming elements in your code is now faster and more efficient. This change also affects other core components of Rider, leading to performance improvements across multiple features, including Find Usages.
- The performance of the Move to Another Type refactoring for static members has been significantly improved for dealing with large classes.
Support for the protobuf-net library
Code Analysis now provides support for the ProtoContract
attribute and ImplicitFields enum from the
protobuf-net library. Both of these can be used to
mark members that are implicitly used for serialization.
As a result, such members are no longer flagged with
unused members warnings.
F# support
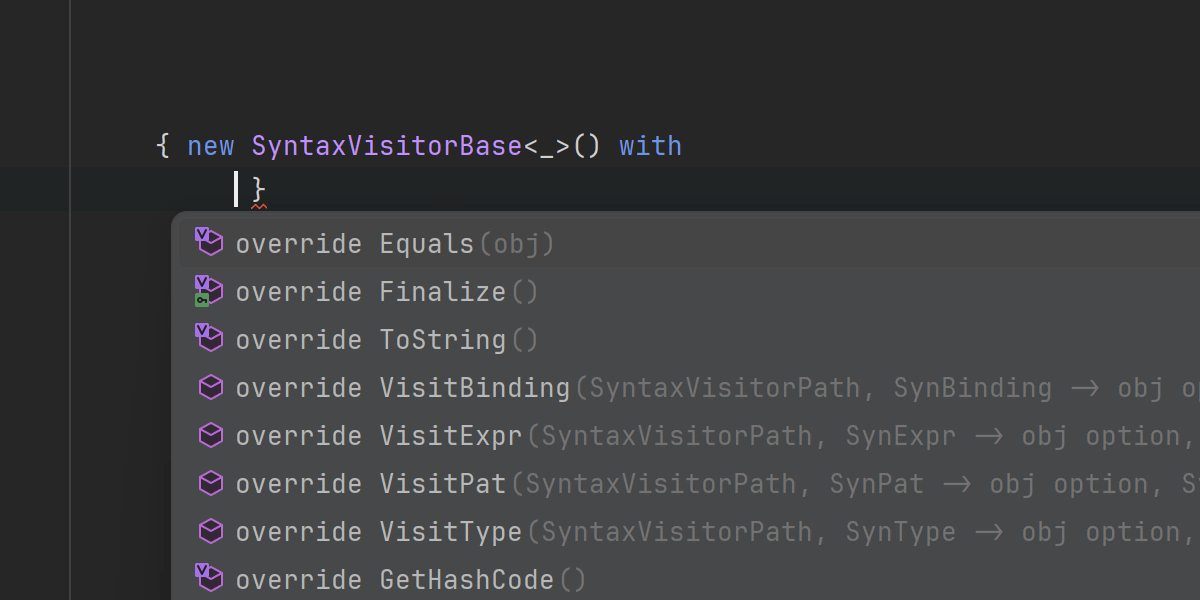
Generating overrides is now available in object expressions via new quick-fixes for missing members, code completion, and a Generate refactoring.
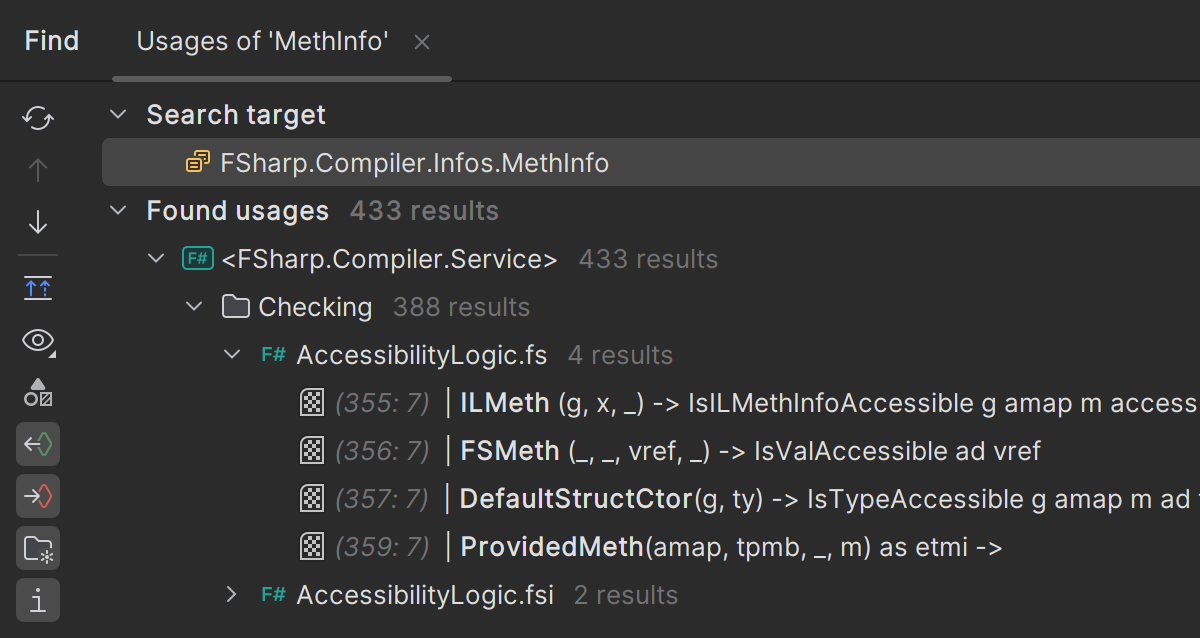
You can now also see union cases when searching for union usages. This makes it easier to see how the type instances are created and pattern-matched.
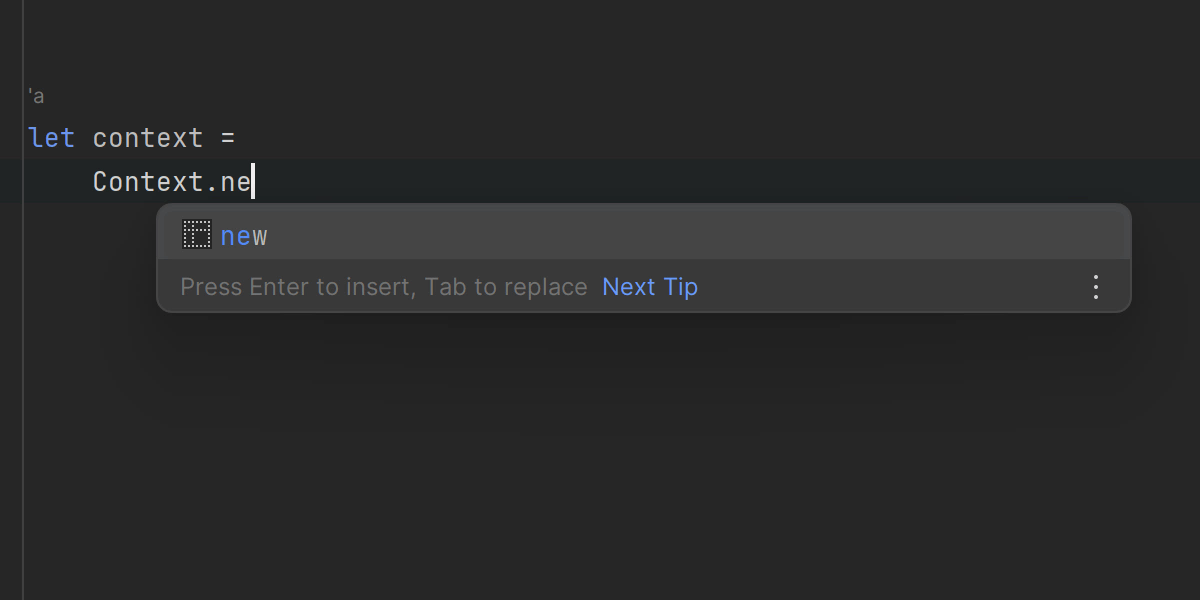
We’ve added a new postfix template that creates instances of
record types and object expressions for classes and interfaces.
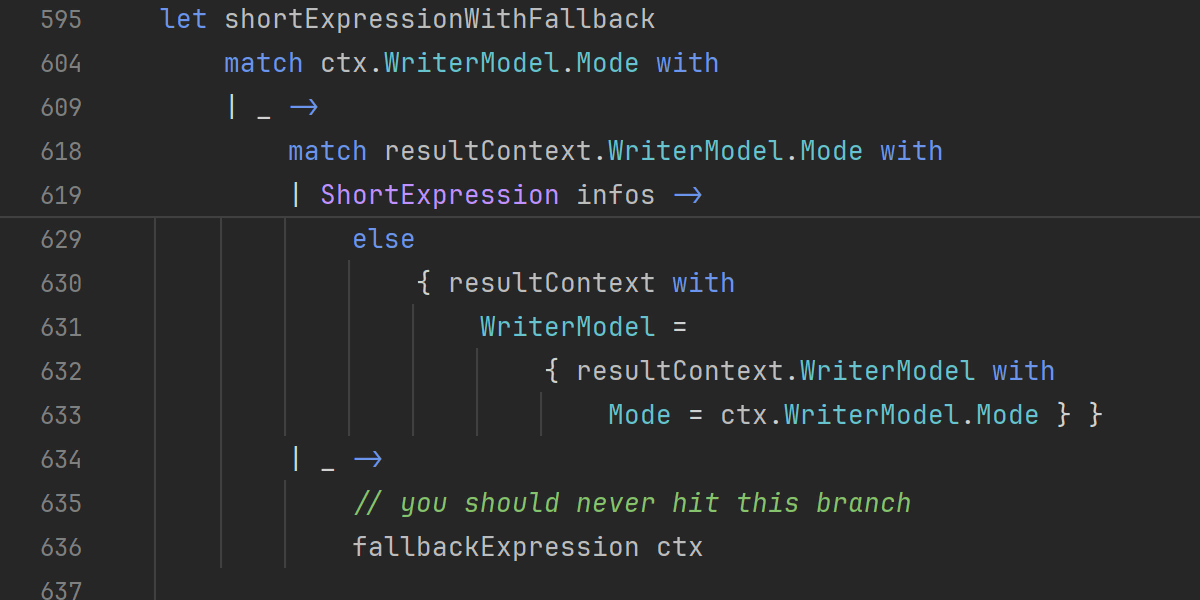
Sticky lines support is implemented for F#, so seeing the context is now easier when working with longer types and functions.
There are more new quick-fixes and context actions for F# support. You can read about these and other changes in the full release notes on GitHub.
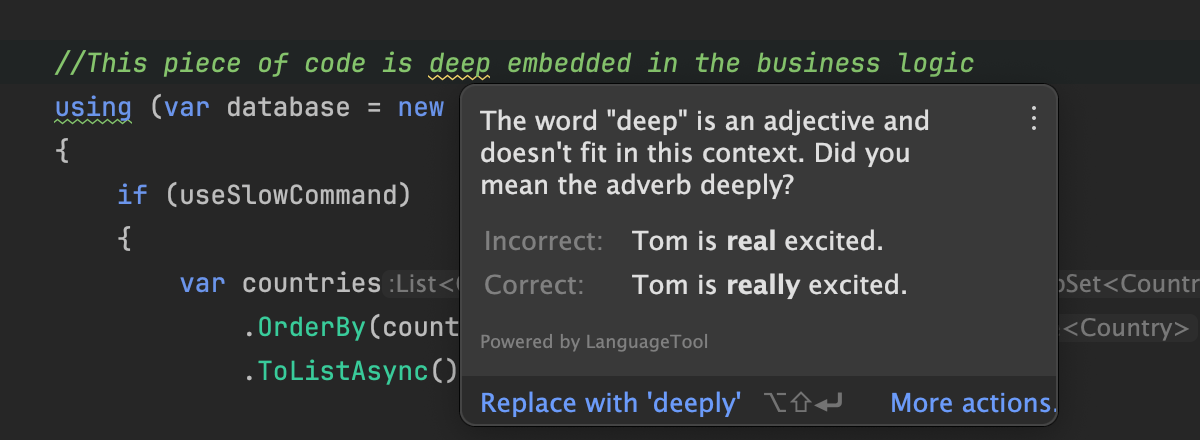
Smart spellchecker
Following the lead of ReSharper, Rider also receives an upgraded spelling and grammar checker. The new spellchecker supports over 20 languages and catches natural language errors within programming languages supported by Rider (C#, C++, VB.NET), markup languages (HTML, XML, XAML), and comments.
.NET debugging
Collections visualizer
The collections visualizer in Rider 2024.1 provides graphical representations of collections (arrays, lists, dictionaries, and other enumerable types), allowing you to expand and collapse elements, view individual values, and easily navigate through the data structure. It’s helpful for understanding the state of your program's data during debugging and for diagnosing issues related to collection, manipulation, or data processing.
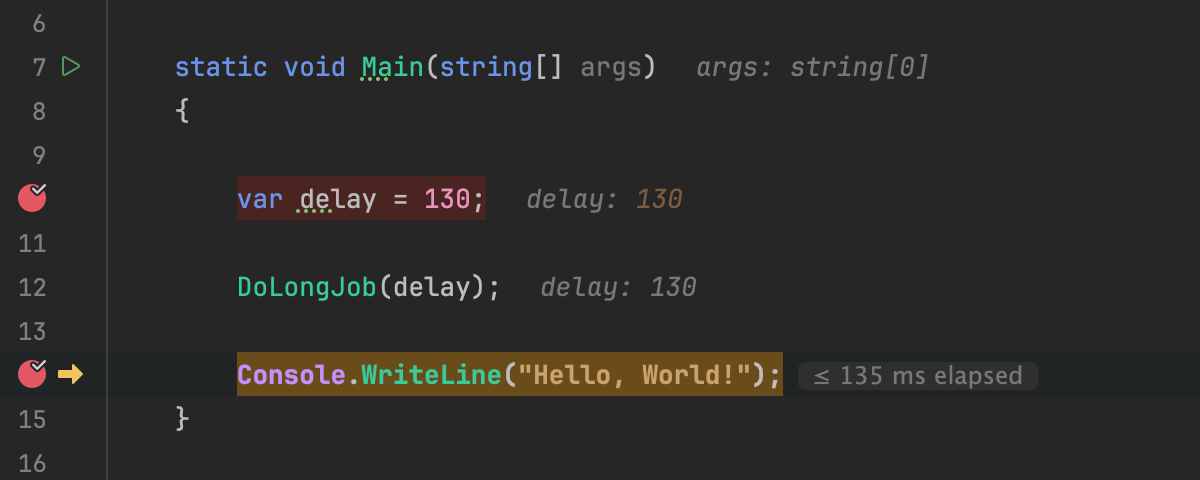
Stepping time
Being able to evaluate the time it takes for the debugger to execute the code between two breakpoints can be extremely valuable when debugging. If you find that the stepping time is excessively long, this might indicate performance issues in your code. When debugging an application with Rider, you will now see an inline hint displaying the time that elapsed between the last and current breakpoints.
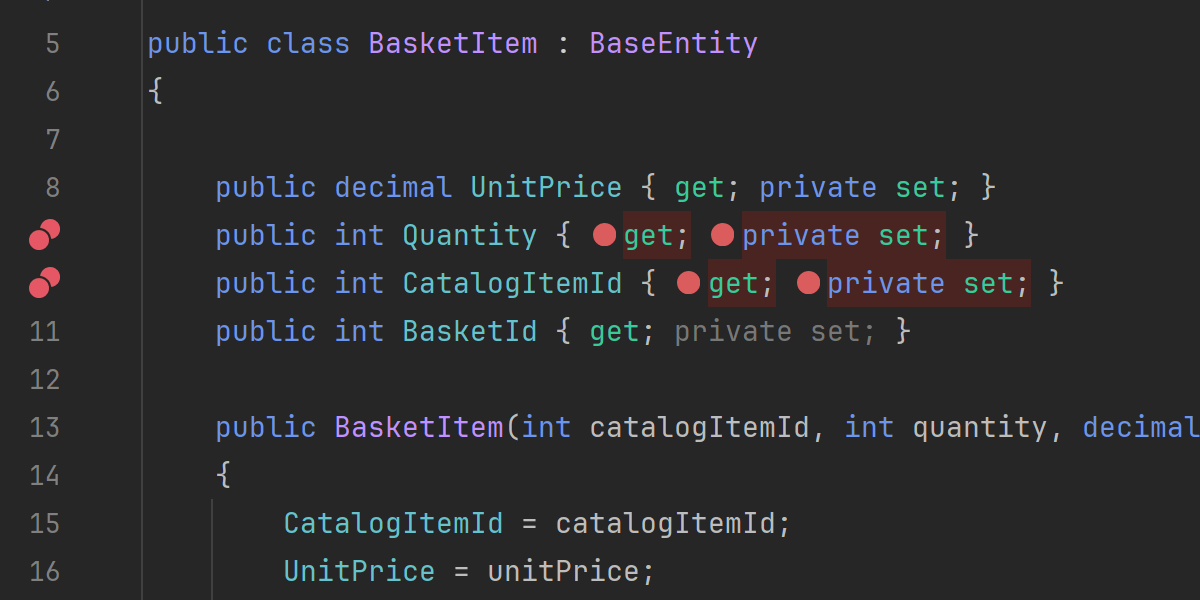
Inline breakpoints
Starting with this update, Rider will allow you to set up multiple breakpoints on a single line of code if several statements are present. You can set the breakpoints either by using the relevant inline hints or via a key shortcut (Ctrl + F8).
Reworked Run to cursor inlay option
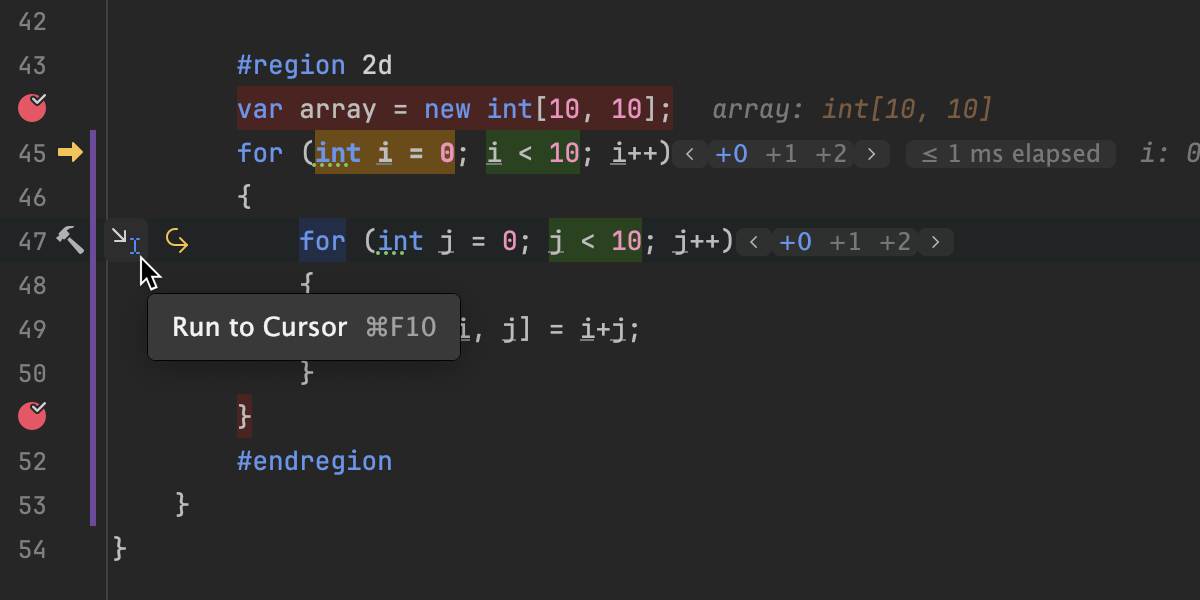
With the 2024.1 release, we’re bringing our Skip to cursor option in line with how it works in IntelliJ IDEA. The new Run to Cursor inlay offers a quick way to navigate to a specific line of code while debugging. Once your program is suspended, you can hover over the line of code to which you wish to continue execution. You can then utilize the Run to Cursor popup to execute your code until it reaches the line where your cursor is placed.
Hot Reload for Blazor WASM
Hot Reload is now available for running and debugging Blazor
WebAssembly (WASM) applications. Hot Reload works for
.cs, .razor, and .css
files (including scoped .razor.css files).
The functionality is enabled by default. You can configure it by going to Settings/Preferences | Build, Execution, Deployment | Hot Reload.
Support for .NET process dumps
When you’re debugging, process dumps are crucial because they allow you to examine the program's state at the time of an error, even if the issue is not easily reproducible. Previously, Rider was only able to process C++ core dumps. Now, the IDE will also allow you to import dumps for .NET processes.
To import a process dump, go to Run | Debug Core Dump or simply drag and drop the dump file into the editor.
AI Assistant
Explain with AI
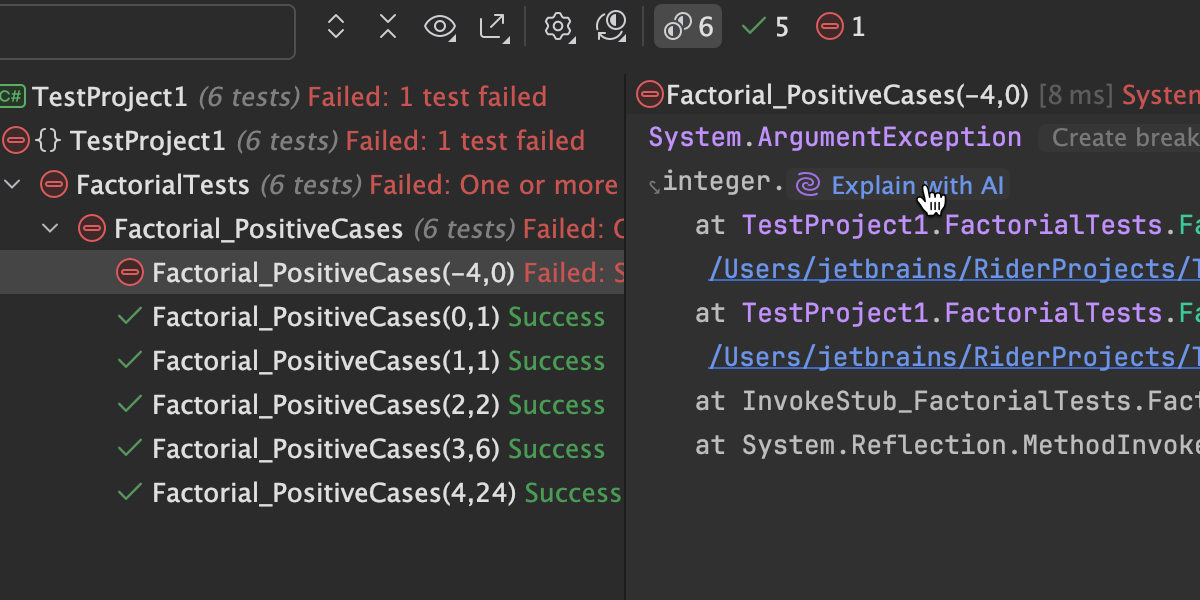
We’ve added a new Explain with AI button right next to an exception or error message thrown for a failed unit test, failed build, or during a debug session.
Rename with AI
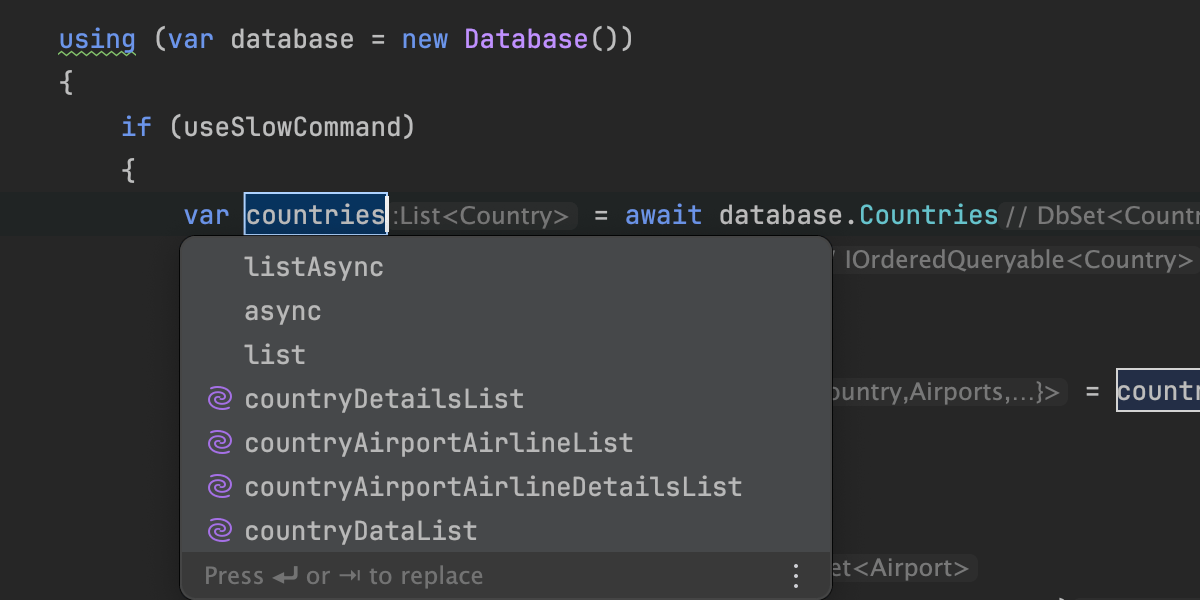
When renaming a local variable, you will get name suggestions powered by AI in the code completion popup.
AI Assistant plugin
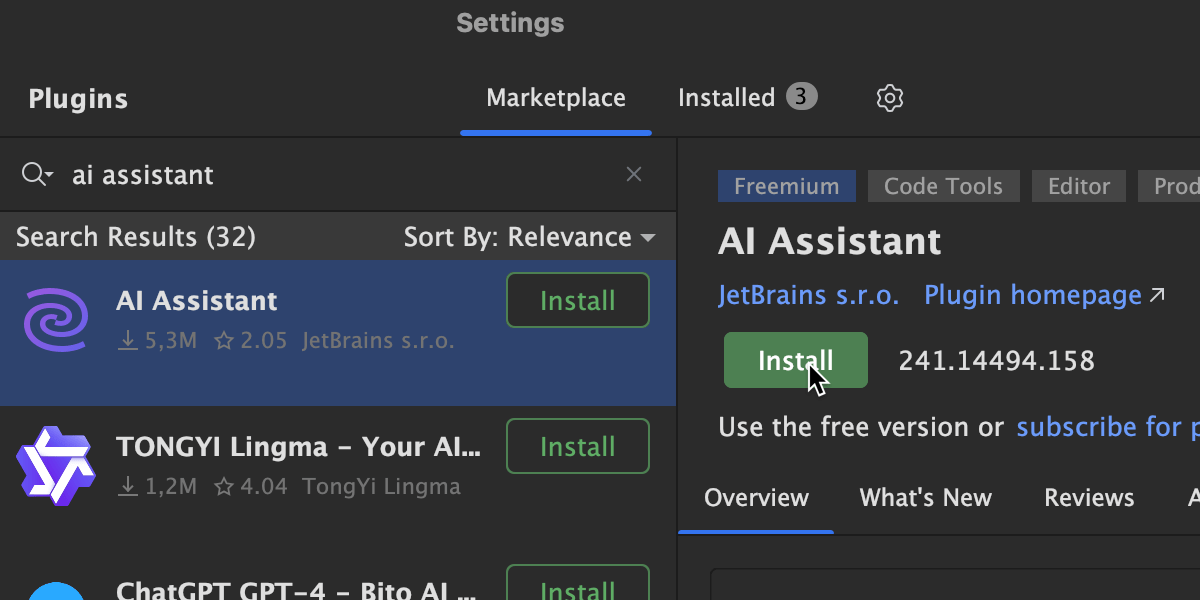
Please note that in version 2024.1, AI Assistant has been unbundled and is now available as a separate plugin. This change is driven by the need to offer greater flexibility in decision-making regarding the use of AI-powered technologies, providing you with more control over your preferences and requirements in your working environments. AI Assistant still requires an active JetBrains AI subscription.
Game development
Unreal Engine
C++ support
Notable enhancements in C++ support include:
- Change Signature offers new features, including the ability to change a parameter type between a pointer, a reference, or a value type.
- Call Tracking now supports outgoing call chains.
- You can now easily customize the style of generated documentation comments. Additionally, grammar inspections are available inside documentation comments.
- The reworked implementation of C++20 modules improves performance and provides support for internal module partitions.
Rider’s C++ support is powered by ReSharper C++. Check out What’s New in ReSharper C++ 2024.1 for more details.
Blueprint debugger call stacks
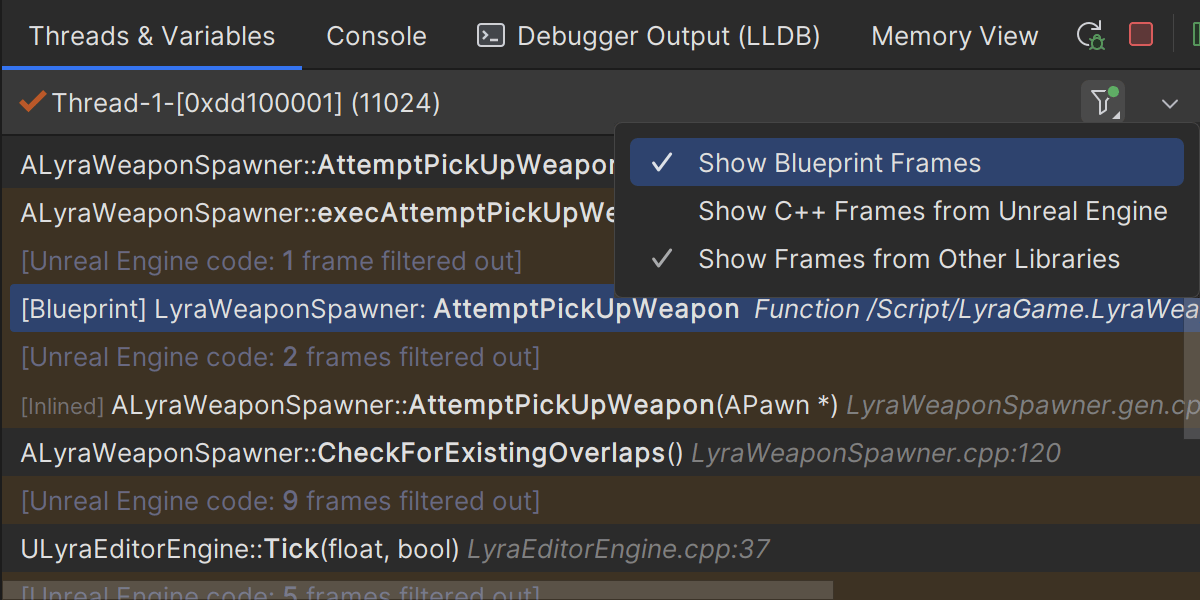
We’re excited to add Blueprint support to the debugger call stack. Instead of seeing an anonymous memory address in the call stack, Rider will now show information about the Blueprint call, interleaved with your existing C++ code. Please make sure to update to the latest version of the RiderLink plugin !
Slate formatting and smart navigation
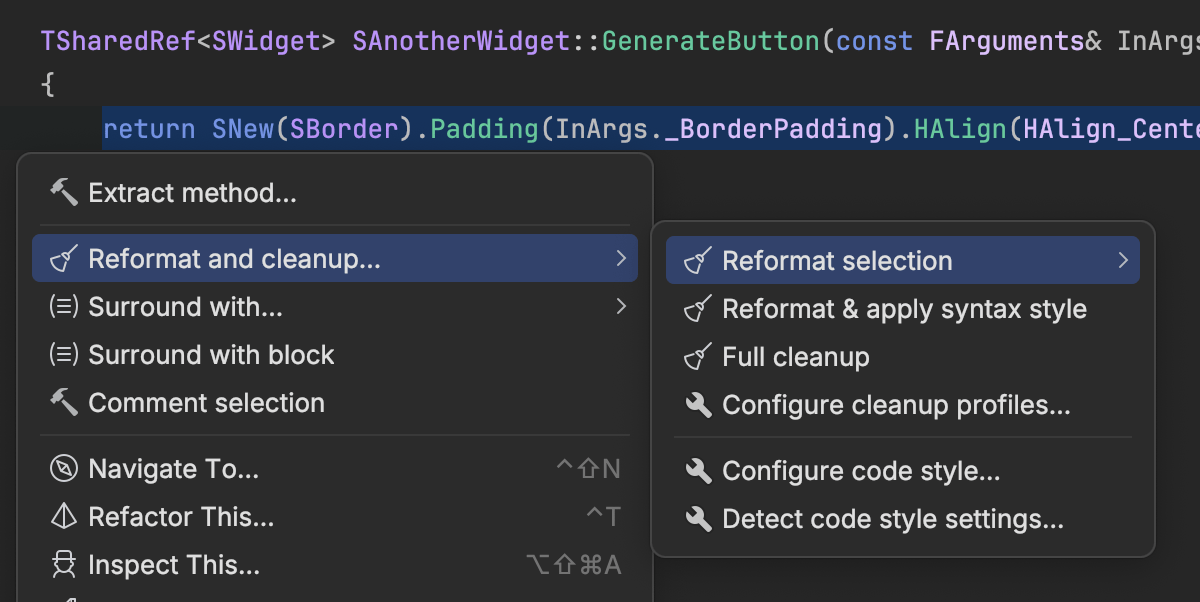
This release adds support for Unreal Engine’s Slate UI framework, teaching Rider how to use the Go to Definition and Find Usages commands, as well as the Rename refactoring to rename the symbols declared by the Slate macros.
Rider will now format Slate DSL code correctly, either when invoked directly as a reformat action, or as you type.
Smart Blueprint features
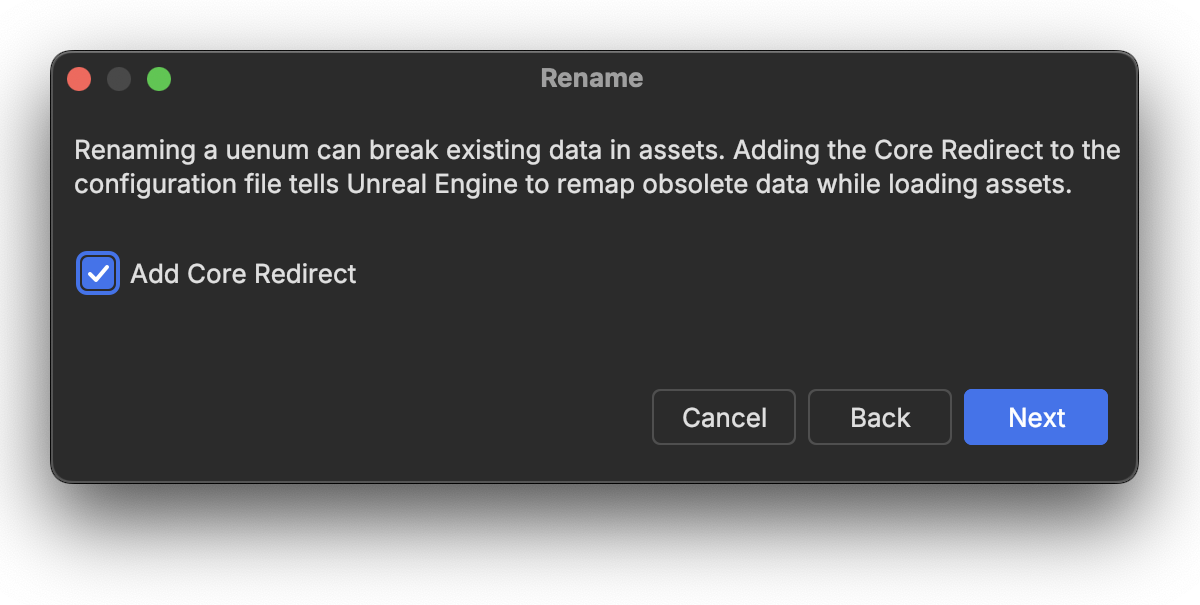
Rider’s smart integration with Blueprint functionality continues
with support for adding core redirects when renaming a UENUM
instance, as well as completion of asset paths for resource
names in C++ code.
Perforce updates, Visual Studio interop, and more
We’re continuing to work on Perforce support, with some helpful quality-of-life improvements to make it easier to log in when your session expires and to put files in the right changelist during a Rename refactoring.
We also fixed the issue with UnrealBuildTool that sometimes caused the full rebuild of a project that had been previously built in Visual Studio. This greatly improves the experience of using both IDEs. The fix is in Unreal Engine 5.4 and all versions of Rider.
And don’t forget to check out all the C++ changes in the ReSharper C++ engine.
Unity
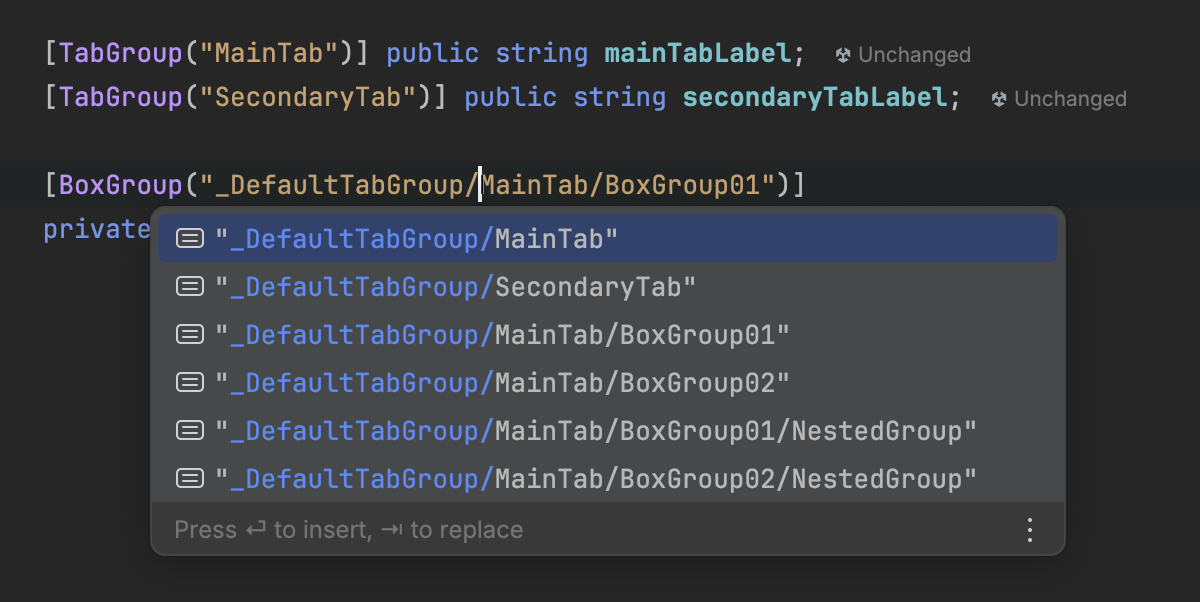
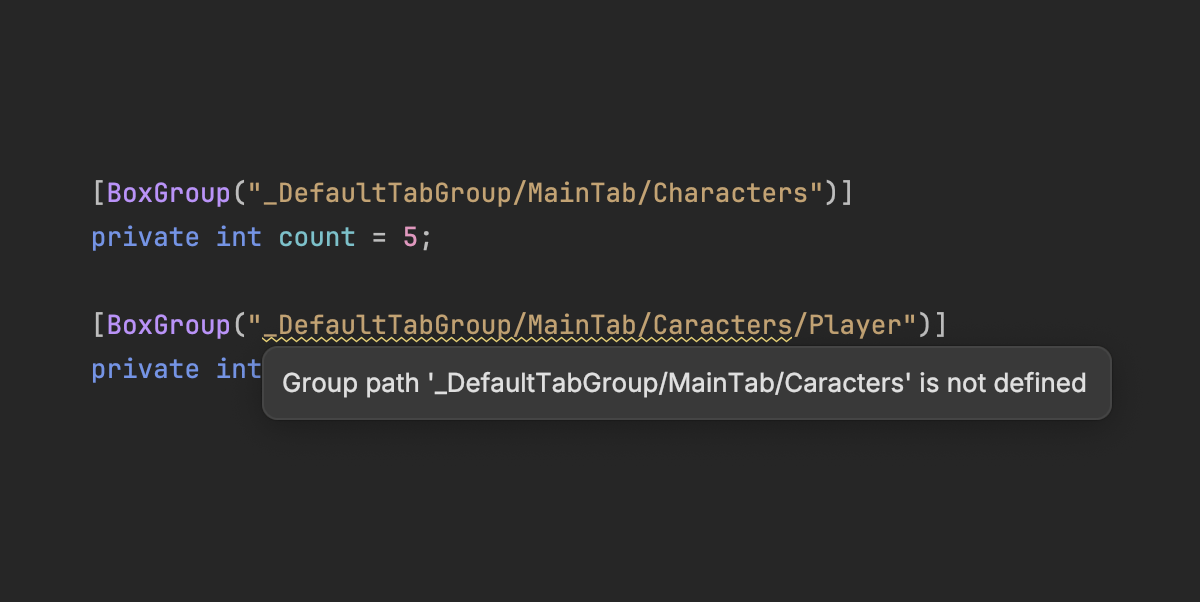
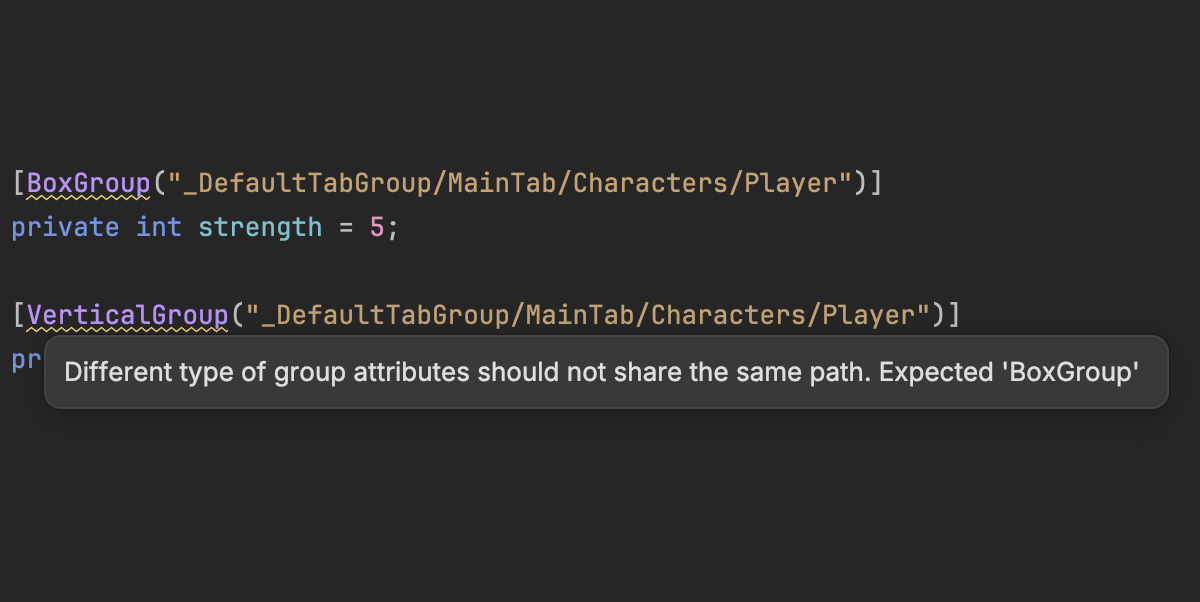
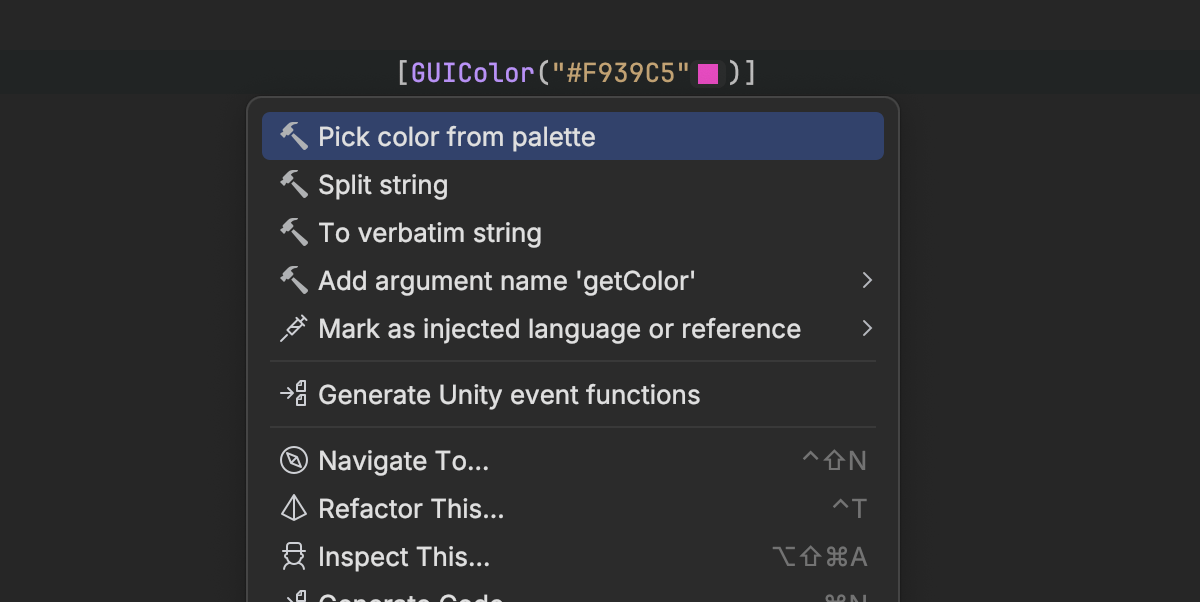
Odin Inspector support
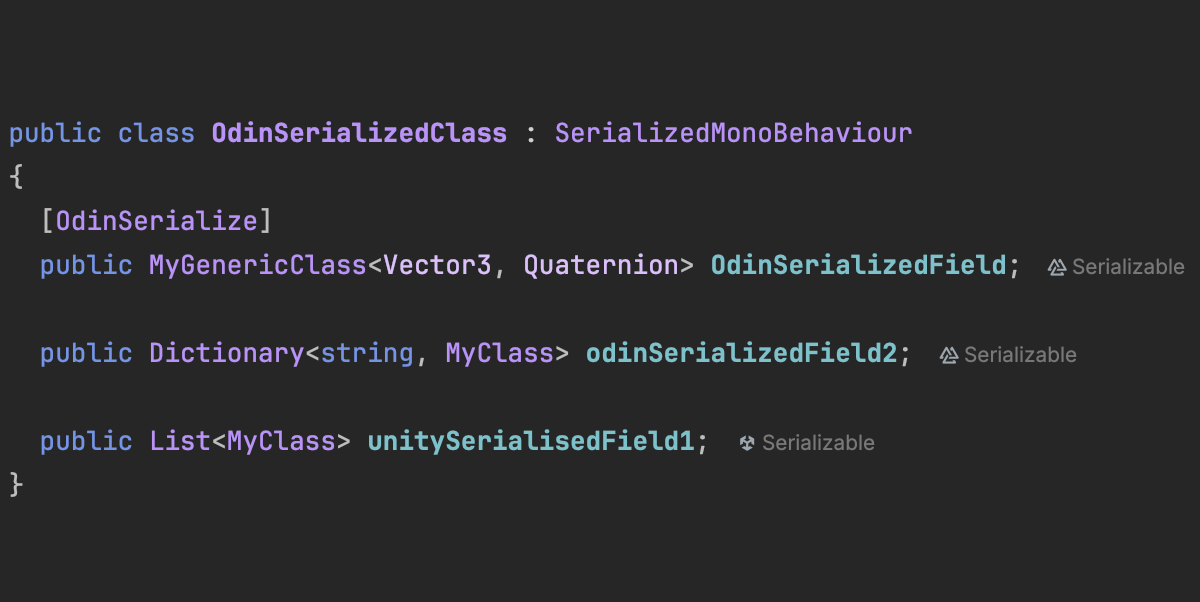
We’re very pleased to announce that we’ve been working with our
friends at Sirenix to provide support for the popular
Odin Inspector
Unity asset. Rider will recognize and highlight fields and
properties serialized by Odin Inspector, provide completion
and inspections for group names in layout attributes, and show
previews of Odin’s GUIColor class. It will also
recognize Odin’s range attributes and use those values in
Rider’s own integer value analysis, warning you if a value
goes out of range.
Shader variant improvements
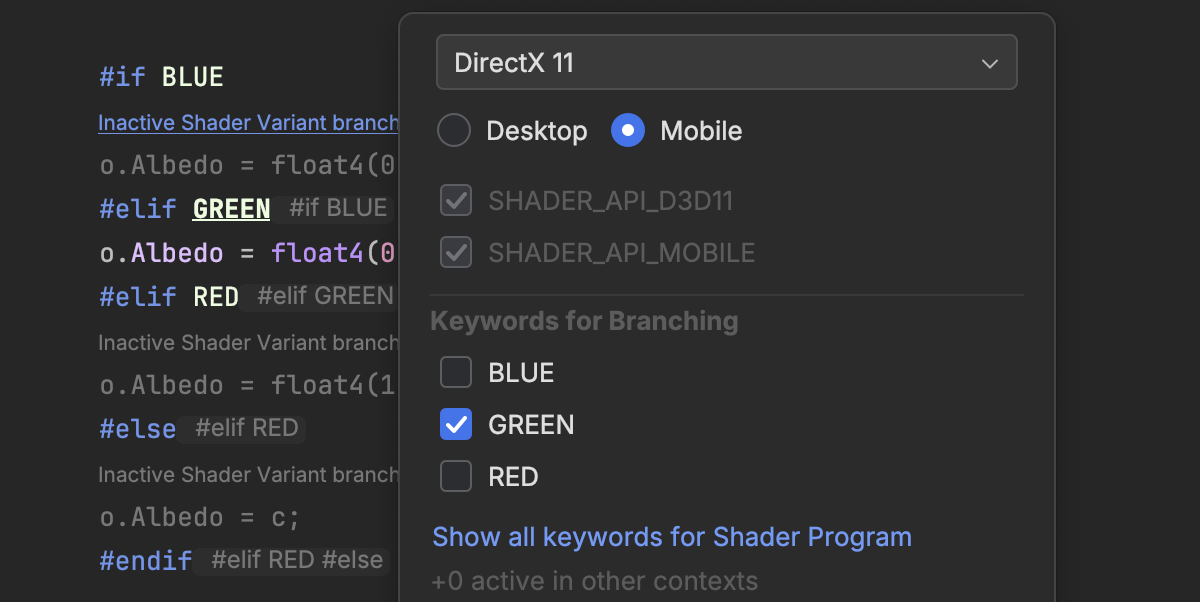
Rider 2024.1 builds on the support for shader keywords introduced
in the 2023.3 version. You can enable or disable different
keywords while editing your shader files, which in turn enables
and disables highlighting and code analysis in different preprocessor
branches. This release adds support for implicit shader keywords,
stage-specific local keywords, and preprocessor directives with
the _KEYWORD_DEFINED suffix.
Null analysis and object lifetime checks
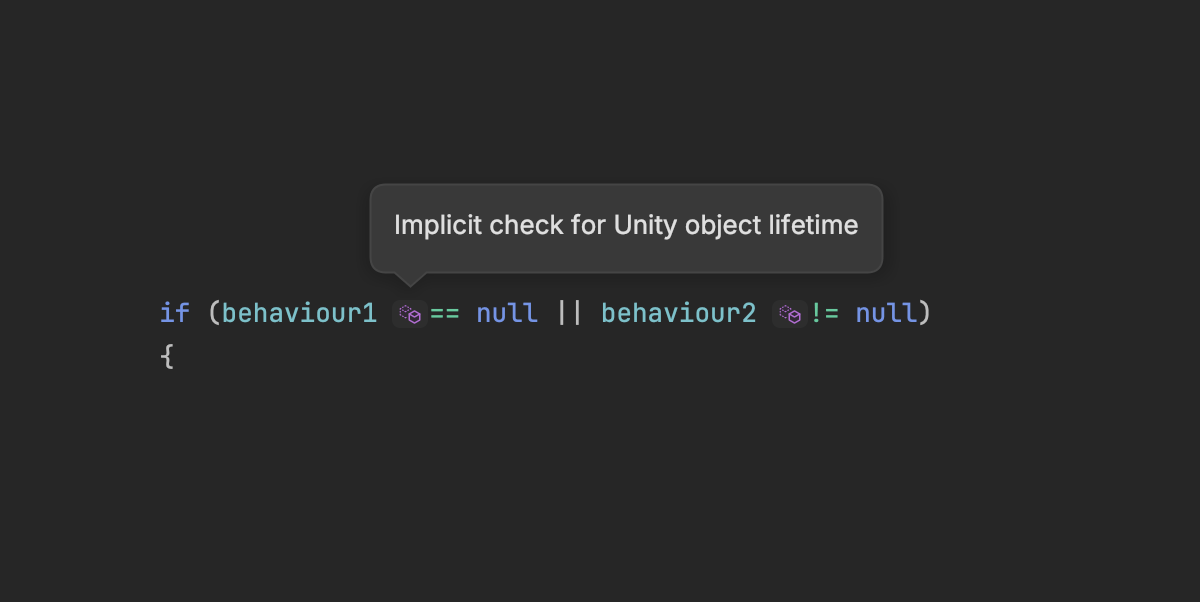
This release updates how Rider highlights Unity’s possibly
unexpected handling of null equality comparisons for
checking the lifetime of the underlying game object. Instead of
showing a warning if a modern C# null check bypasses
the lifetime check, Rider will now highlight when a null
comparison performs the check.
We’ll dive into this in more detail in a forthcoming blog post.
Debugging, asset indexing, and more
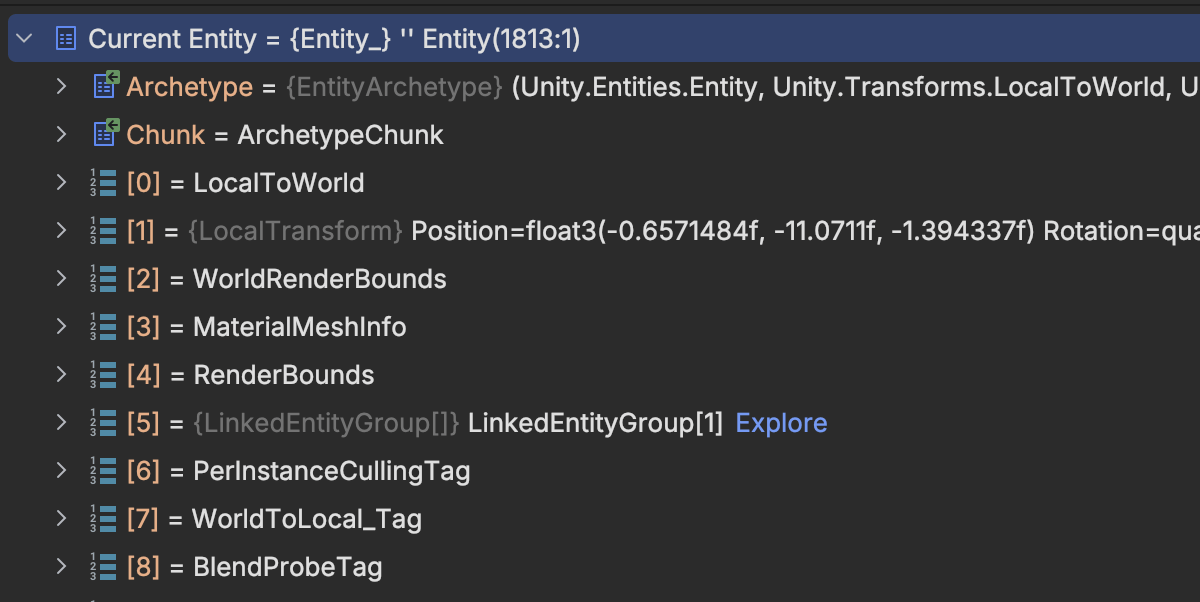
Debugging gets a boost thanks to Rider providing more DOTS-specific
support, such as adding an Entity child node
when examining an instance of IJobEntity in the
Watches pane.
Pausepoints
have been updated to work with DOTS systems, too. The texture
debug value visualizer has had a few bug fixes, and the new
collections visualizer will help with collections of game objects.
There have also been some performance improvements to asset parsing, fixes to recognizing serialized fields, and plenty of other small fixes and updates. You can read more in the changelog.
Godot
We’re continuing our support of Godot with more updates to the optional plugin that you can install from the Plugins tab in the settings. The recent changes include:
-
Syntax highlighting for more Godot file types, including
.gd,.tscn,.tres,.godot, and improved highlighting for.gdshader. -
Rider will now automatically detect the correct .NET runtime
for running or debugging Godot tests from
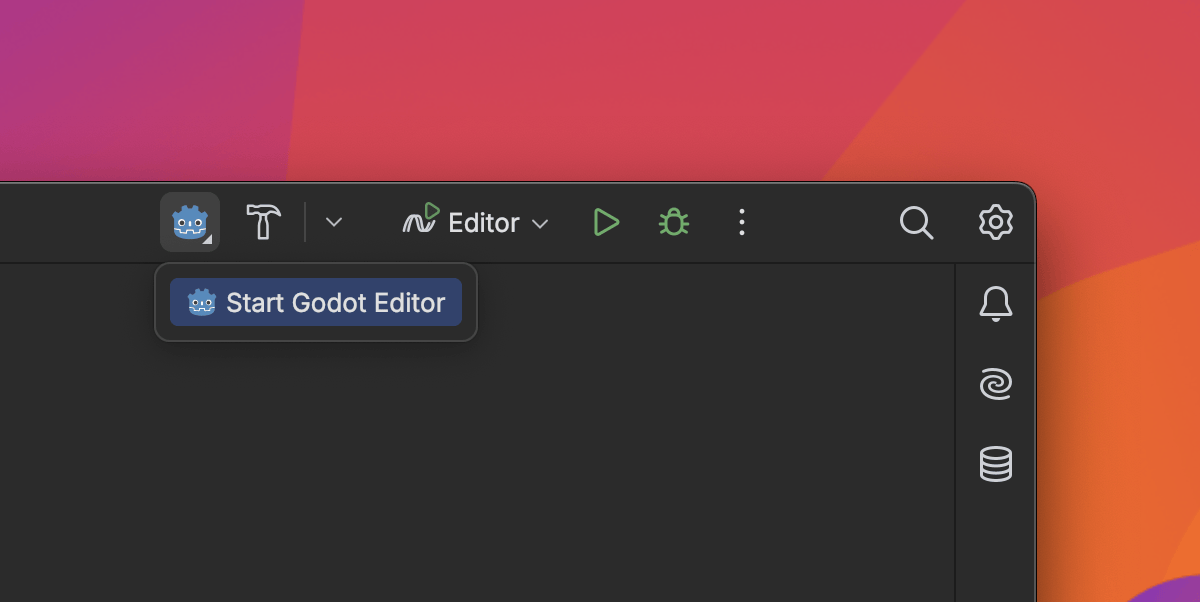
launchSettings.json(JetBrains/godot-support#125). - We’ve added a Start Godot Editor button to the main toolbar, similar to the action available for Unity (JetBrains/godot-support#119).
Web development
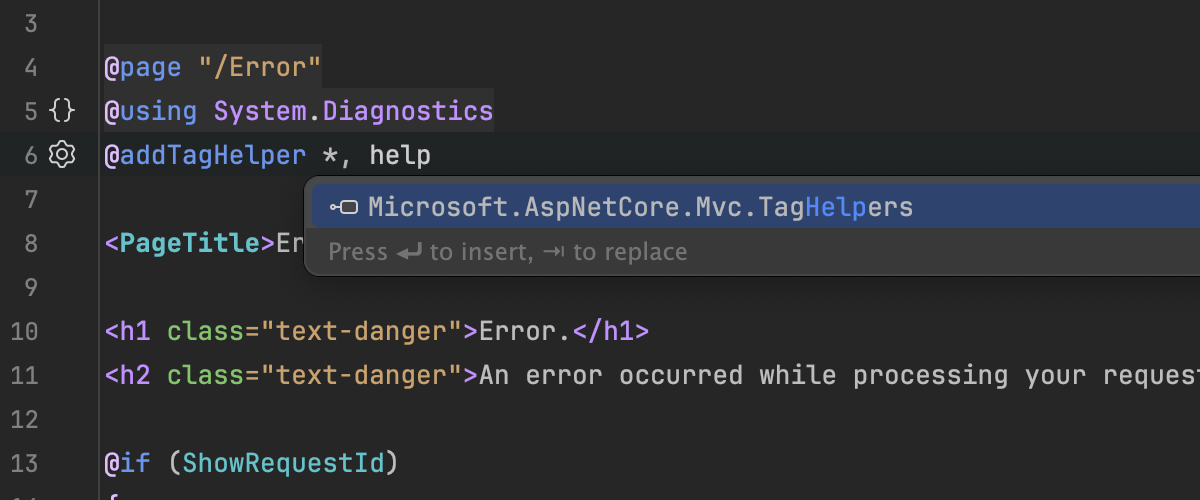
Resolve references for @addTagHelper and @removeTagHelper directives
Rider now resolves references for assembly names specified within
@addTagHelper and @removeTagHelper directives in your
Razor views. As a result, you can now benefit from code completion,
the ability to find usages, and the ease of code navigation.
Moreover, Rider highlights any unresolved assembly names as warnings, so you can easily recognize them in your Razor views.
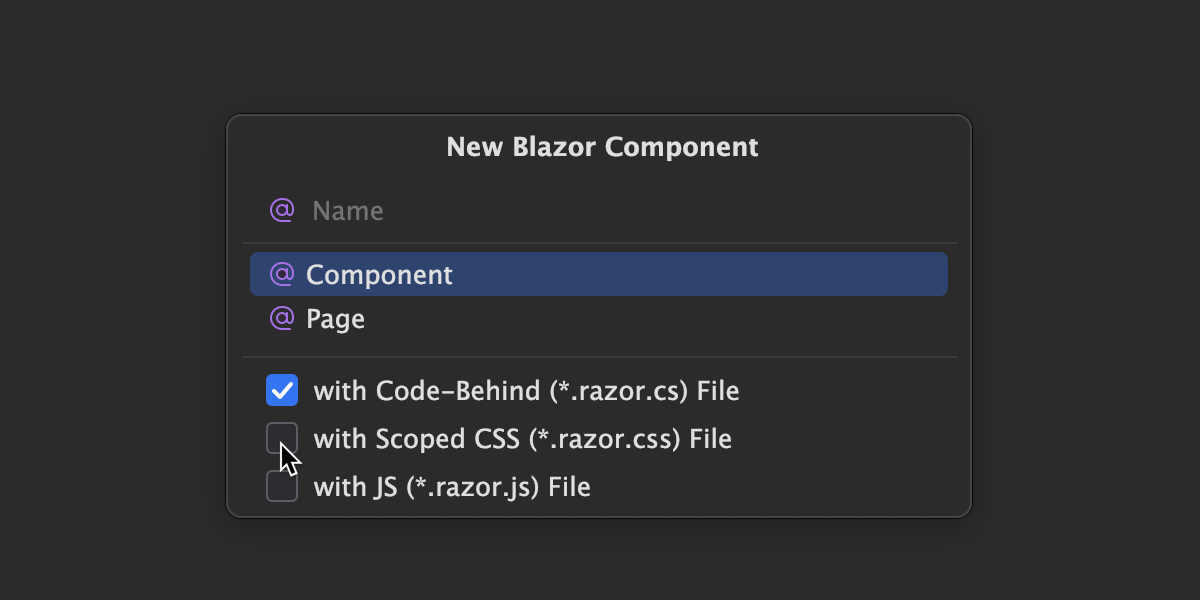
Blazor Component file template
You can now generate additional files like .razor.cs,
.razor.css, .razor.js when generating
a Blazor Component file template.
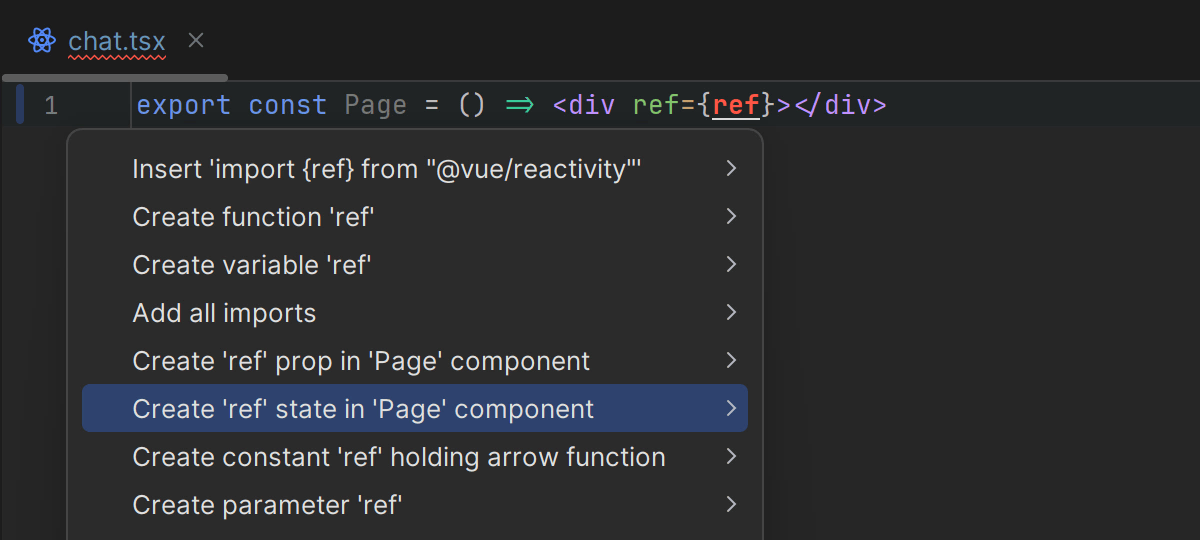
Quick-fixes for React props and state creation
Rider 2024.1 introduces several new quick-fixes for React that let you create props and states on the fly. You can apply these quick-fixes using the shortcut Alt + Enter.
For more information on the improvements in web development, please refer to this page.
Version control
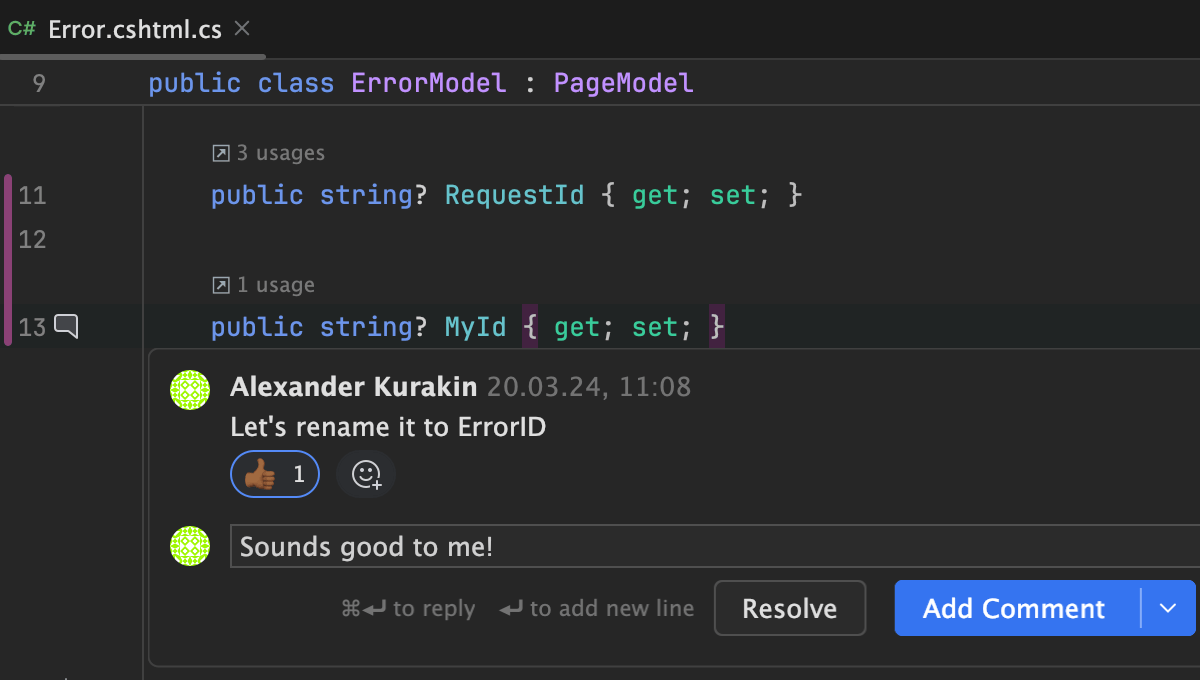
This release brings updates to VCS support in Rider, including:
- In-editor code reviews for GitLab and GitHub repos.
- CI status checks in the Git tool window.
- Prevention of large file commits to repositories.
- New Stash tab in the Commit tool window.
- Option to exclude folders and files from comparisons.
- And more!
Learn about all the changes here.
Working with databases
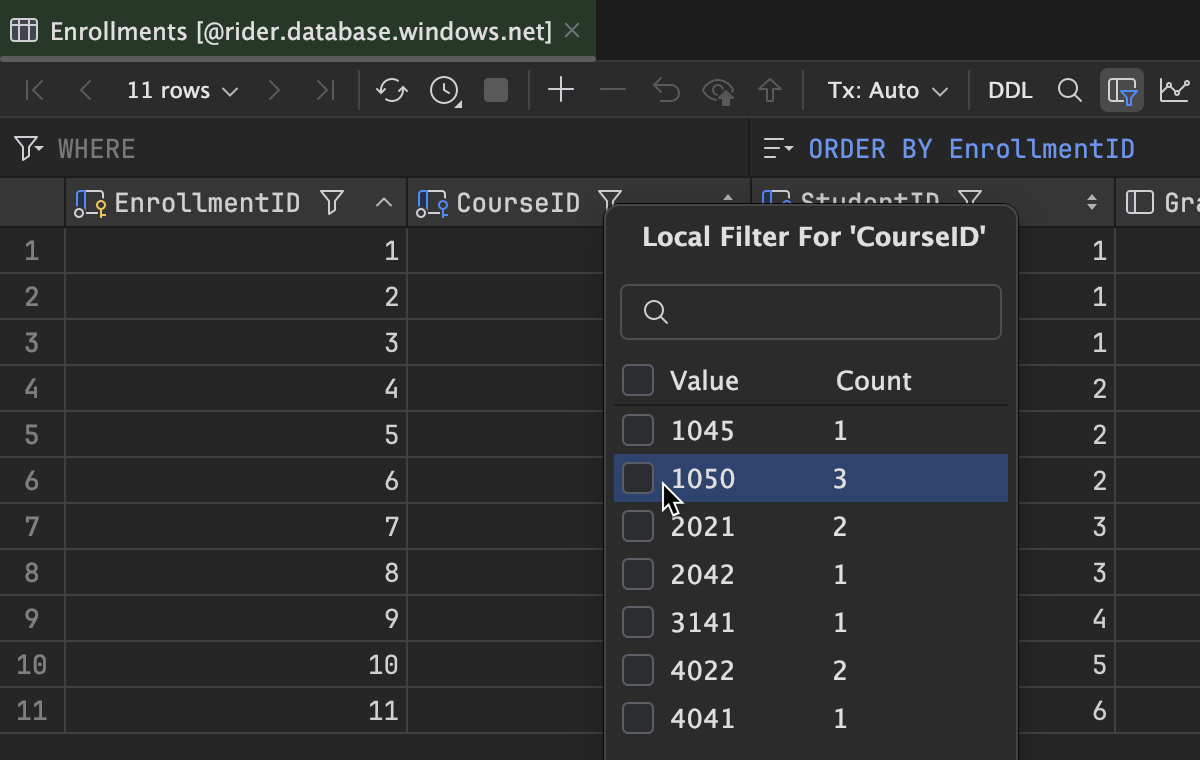
Some of the most notable improvements for working with databases using Rider 2024.1 are:
- Local filter in the data editor.
- Single record view.
- Ability to move columns in CSV files.
- More features for UUIDs.
- Aligned code style for multi-row
INSERTS. - Column completion for
GROUP BYclauses.
For more information on the improvements for working with databases, please refer to this page.
Plugins
.NET Aspire
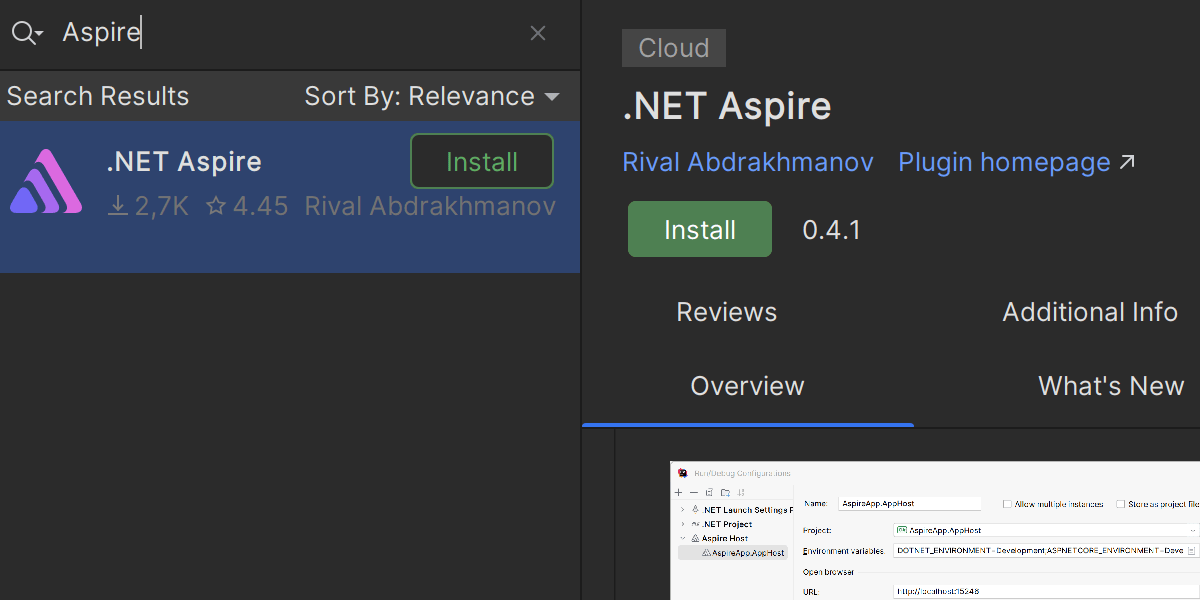
The .NET 8 SDK introduced .NET Aspire – a new approach to tackling the complex issues around building distributed applications on the .NET stack. In response to this innovation, we’re offering new integrated tooling – the .NET Aspire plugin for Rider.
The plugin is available for Rider 2024.1 and can be downloaded directly from JetBrains Marketplace or via Settings/Preferences | Plugins.
Learn all about .NET Aspire and the new plugin from this blog post.
Support for Frozen Object Heap (FOH) dotUltimate
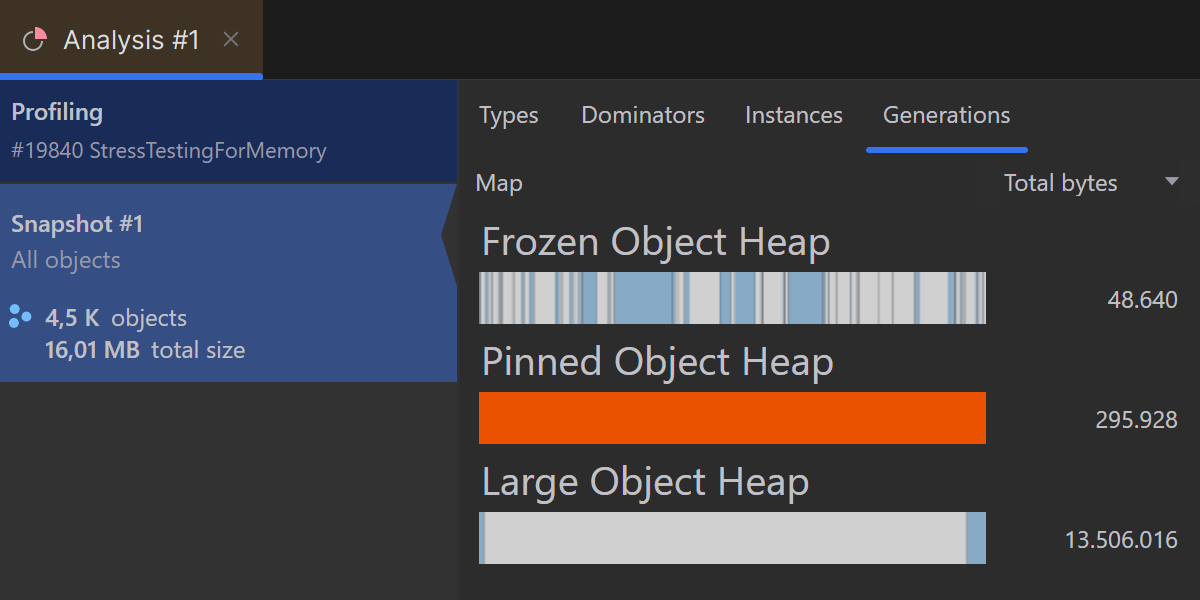
The built-in dotMemory profiling tool now offers support for Frozen Object Heap (FOH) – a feature first introduced with the .NET 6 SDK as part of the performance improvements for garbage collection.
FOH allocates a dedicated memory area for immutable objects. These objects are not changed after being allocated and are not subject to garbage collection. Support for this technology enables dotMemory to perform a more detailed analysis of memory used by immutable objects in the FOH, boosting the optimization of memory usage.
Performance and memory profiling for desktop MAUI apps dotUltimate
The built-in dotTrace and dotMemory profilers now support MAUI and .NET macOS applications.
Supported target frameworks:
- MAUI Windows:
net8.0-windows,net7.0-windows. - MAUI Mac:
net8.0-maccatalyst,net7.0-maccatalyst. - macOS applications:
net8.0-macos,net7.0-macos.
Click here for more information on the available profiling modes.
New Azure Toolkit plugin
The new Azure Toolkit for Rider plugin is an open-source project that helps .NET developers easily create, develop, configure, test, manage, and deploy highly available and scalable web apps to Azure.
The plugin can be downloaded and installed inside JetBrains Rider and is available from JetBrains Marketplace.
Miscellaneous
Enhanced GitHub Actions support
We've enhanced support for GitHub Actions in this release. Our development focus is on enriching your CI/CD workflows by providing increased efficiency and intelligent features designed specifically for GitHub Actions.
The list of enhancements includes:
- Extensive autocompletion support for various GitHub Action contexts.
- Branding feature for
action.yml. - Docker image completion.
- JavaScript file path completion.
For more information, check out this post on the IntelliJ IDEA blog.
Type dependency diagram enhancements
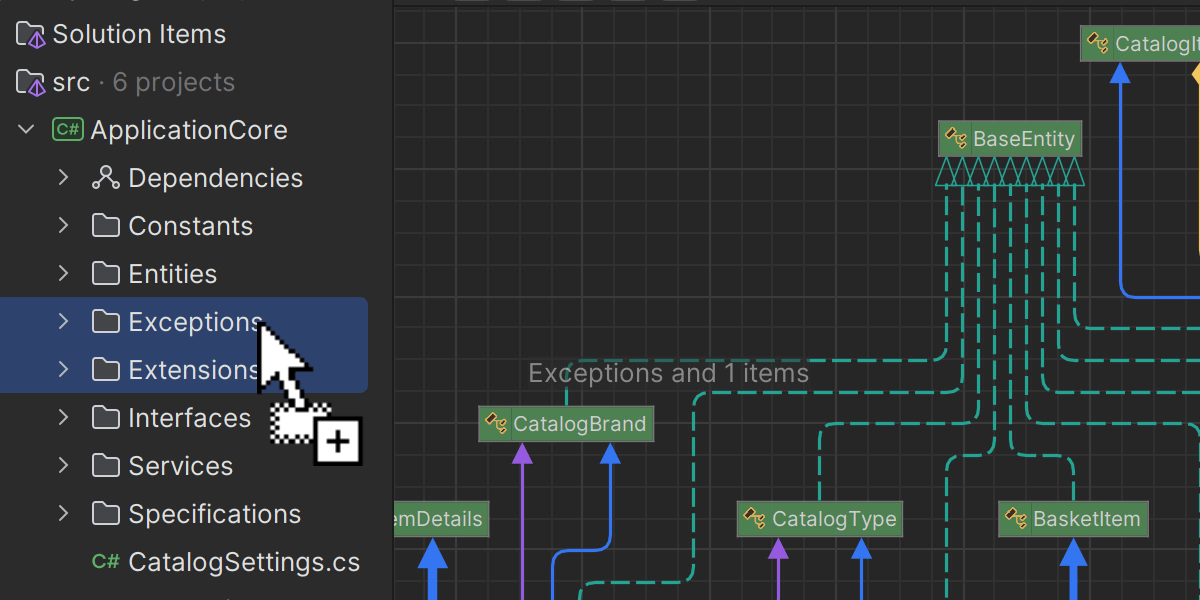
The type dependency diagrams introduced in the 2023.3 release are getting a functional upgrade with new ways of configuring the diagrams, namely:
- Option to add a node to a diagram using Search.
- Option to remove nodes from the view of the diagram.
- Ability to add related types for a specific type in a diagram.
- Option to drag and drop project files onto the Type dependency diagram.
To discover more ways to generate type dependency diagrams for your application, see this blog post.
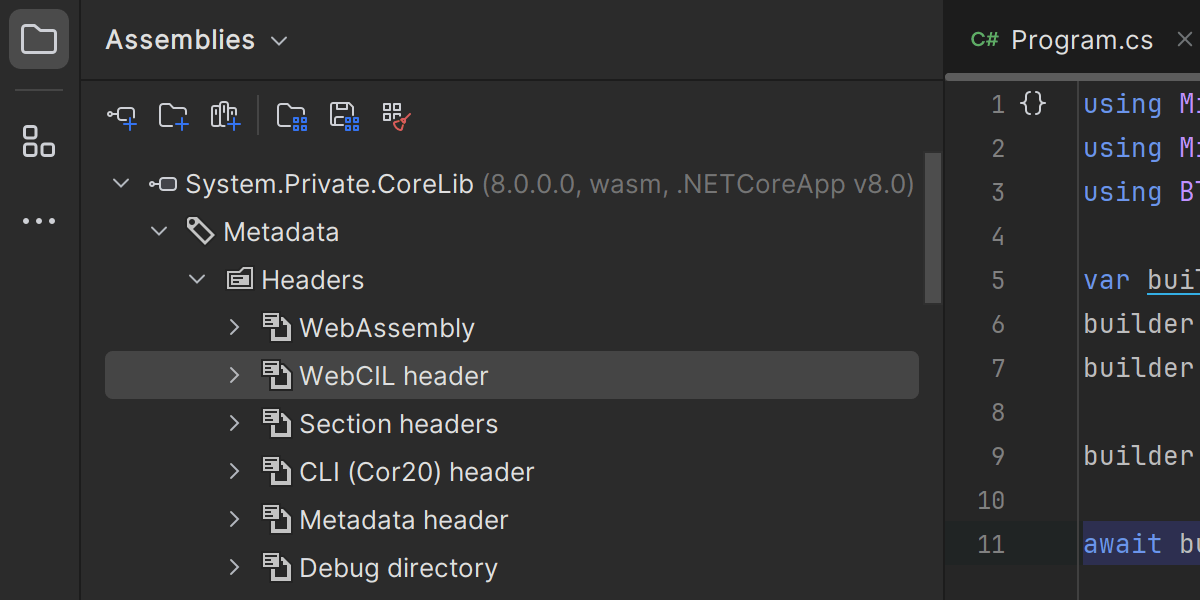
Decompiler
The Assembly Explorer inside Rider now supports the WebCIL packaging format for WebAssemblies.
The support covers:
- Decompilation for WebCIL.
-
The ability to view
.wasmfiles in the Assembly Explorer. - Metadata subtrees for WASM nodes in the Assembly Explorer, including WASM and WebCIL headers.
