Measure CI/CD Performance With DevOps Metrics
How can you ensure you’re reaping all the benefits of CI/CD? Measuring the performance of your CI/CD pipeline will help you optimize your process and demonstrate its value to the wider business.

Continuous improvement is one of the cornerstones of the DevOps philosophy. It’s an approach that can help you effect significant changes sustainably. The strategy applies as much to the product or service you’re building as to how you create it.
As the name suggests, continuous improvement is an ongoing process that involves:
- Collecting and analyzing feedback on what you’ve built or how you’re working.
- Identifying what is performing well and what could be improved.
- Making incremental changes based on those insights to try to optimize things further.
- Continuing to collect feedback so you can confirm whether those changes are helping.
One key benefit of CI/CD is that it facilitates the continuous improvement of your software. A CI/CD pipeline allows you to release more often and get regular feedback on what you’ve built so you can make informed decisions about what to prioritize next.
Likewise, the rapid feedback you get from each stage of automated building and testing makes it easier to address bugs and improve the quality of your software.
However, continuous improvement in CI/CD does not stop there. By collecting DevOps metrics, you can apply the same techniques to the CI/CD process itself.
Why are DevOps metrics important?
When you first start building a CI/CD pipeline, there are plenty of things to do, from writing automated tests to making your pre-production environments refresh automatically. If you’re searching for ideas on how to improve the process at this stage, check out our CI/CD best practices guide.
Once you have an automated pipeline up and running, it’s time to explore how to make it work more effectively. This stage is when the cycle of continuous improvement begins – with the help of your CI/CD pipeline metrics.
Peter Drucker once said, “You can’t manage what you don’t measure.” Metrics are essential for continuous improvement. The data helps identify where you can add value and offer a baseline against which to measure the impact of the changes you make.
By monitoring important DevOps metrics, you can determine whether extending your automated test coverage, improving throughput, or breaking down development tasks will have the biggest impact on your CI/CD pipeline’s performance.
Each time you optimize a stage of your CI/CD pipeline, you amplify the effect of that feedback loop. This refinement improves your ability to release changes more frequently while maintaining quality and keeping the defect rate low.
Releasing more often means you can keep improving key features, run experiments to validate assumptions, and promptly address any problems. As the market evolves and demand for features shifts, you can respond quickly – keeping yourself on par or even ahead of the competition.
What’s more, monitoring your CI/CD metrics is a great way to demonstrate the value of your pipeline to the broader business, including stakeholders and other development teams.
Top-level DevOps performance metrics
Google’s DevOps Research and Assessment team (DORA) has identified the following four high-level metrics that accurately indicate software development teams' performance.
You can learn more about the research that informed these choices in the book Accelerate, by Nicole Forsgren, Jez Humble, and Gene Kim.
Deployment frequency
Deployment frequency records the number of times you use your CI/CD pipeline to deploy to production. DORA selected deployment frequency as a proxy for batch size, as a high deployment frequency implies fewer changes per deployment.
Deploying a smaller number of changes lowers the risk associated with releasing, as fewer variables can combine to yield unexpected results. Deploying more frequently also provides more immediate feedback on your work.
A low deployment frequency can signify that the pipeline is not fed with regular commits, perhaps because you don’t break tasks down enough. Building a DevOps culture in which all team members understand the benefits of CI/CD can help your team adapt to working in smaller increments.
Sometimes, a low deployment frequency results from batching changes into larger releases as part of a continuous delivery strategy. If you need to batch changes for business reasons (such as user expectations), consider measuring the frequency of deployments to staging sites instead.
Lead time
Lead time (also known as time to delivery or time to market) is the time from when working on a feature begins until it is released to users. However, the time involved in ideation, user research, and prototyping can vary greatly.
For this reason, DORA measures the time from the last code commit to deployment. This timeframe allows you to focus on the stages within the scope of your CI/CD pipeline.
A long lead time means that you don’t regularly get code changes in front of users. As a result, you can’t take advantage of usage statistics and other feedback to refine what you’re building.
Extended lead times are common in pipelines with multiple manual steps. These stages could include large numbers of manual tests or a deployment process that requires environments to be refreshed manually.
Investing in automated tests and a CI server to coordinate build, test, and deployment tasks will reduce the time it takes to deliver software. At the same time, you can use a CI server to collect metrics that demonstrate the return on your investment.
Suppose you have already started to automate your continuous integration and deployment process, but the steps are slow or unreliable. In that case, you can use build duration metrics to pinpoint the bottlenecks.
If your organization requires risk assessments or change review boards before each release, this can add days or weeks to each deployment. Using metrics to demonstrate the reliability of the process can help build stakeholders’ confidence and remove the need for these manual approval steps.
Change failure rate
Change failure rate refers to the proportion of changes deployed to production that result in outages or bugs – and require either rollbacks or hotfixes. It does not include issues discovered before you deploy code changes to production.
This metric's advantage is that it puts failed deployments in the context of the volume of changes made. A low change failure rate should give you confidence in your pipeline; it indicates that the earlier stages are doing their job and catching most defects before your code is released.
If your change failure rate is high, it’s time to examine your automated test coverage. Do your tests cover the most common use cases? Are your tests reliable? Can you enhance your testing regime with automated performance or security testing?
Mean time to recovery
Mean time to recovery or resolution (MTTR) measures the time it takes to address a production failure. Highlighting MTTR recognizes that, in a complex system with many variables, some failures in production are inevitable. Rather than aiming for perfection (and forfeiting the benefits of frequent releases), the focus is on whether you can respond to issues quickly.
Keeping your MTTR low requires proactive production monitoring to alert you to problems as they emerge, along with the ability to either roll back changes or deploy hotfixes via the pipeline.
A related metric, mean time to detection (MTTD), measures the time between deploying a change and your monitoring system detecting an issue introduced by that change. By comparing MTTD and build duration, you can determine if either area would benefit from an investment to reduce MTTR.
Operational and CI metrics
In addition to high-level measurements, you can use a range of operational and continuous integration metrics to better understand how your pipeline is performing and identify opportunities for improvement.
Code coverage
Automated tests in a CI/CD pipeline should provide most of your test coverage. The first layer of automated tests should be unit tests, which are quickest to run and deliver the most immediate feedback.
Code coverage is a metric provided by most CI servers that calculates the proportion of your code covered by unit tests. It’s worth monitoring this metric to ensure you maintain adequate test coverage as you write more code. If your code coverage starts trending downward, it’s time to invest some effort in this first line of feedback.
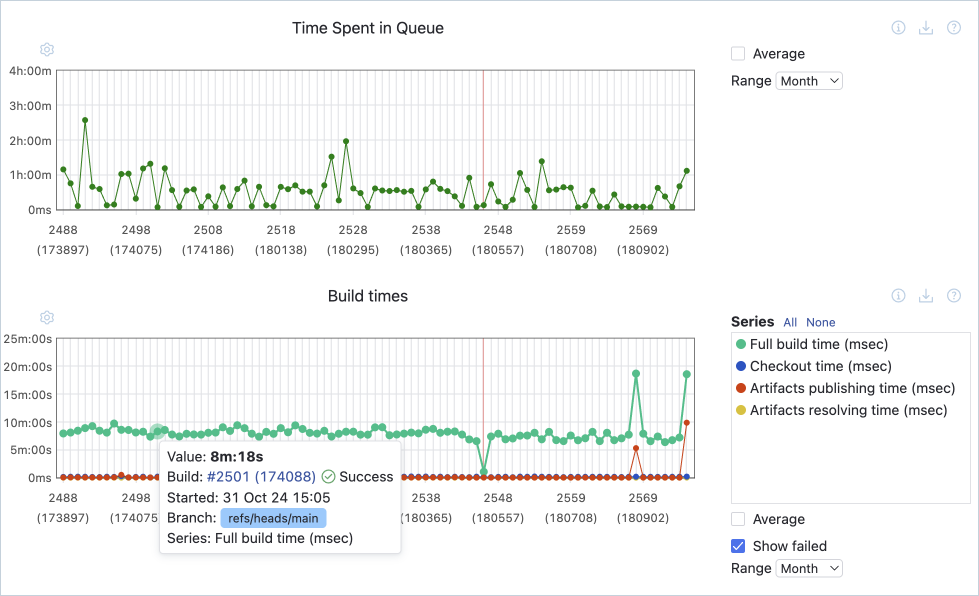
Build duration
Build duration or build time measures the time taken to complete the various stages of the automated pipeline. Analyzing the time spent at each stage of the process helps spot pain points or bottlenecks that might increase the time it takes to get test results or deploy to production.
Test pass rate
The test pass rate is the percentage of cases that passed successfully for a given build. Provided you have a reasonable level of automated tests, the metric indicates each build’s quality. You can use the data to understand how often code changes introduce new bugs.
Although catching failures with automated tests is preferable to relying on manual tests or discovering issues in production, if a particular set of automated tests regularly fails, it’s time to investigate the root cause of those failures.
Time to fix tests
Time to fix tests is the time between a build reporting a failed test and the same test passing on a subsequent build. This metric gives you an indication of how quickly you can respond to issues identified in the pipeline.
A low resolution time shows you’re using your pipeline effectively. Fixing issues as soon as you find them is more efficient, as the changes are still fresh in your mind. By fixing issues quickly, you also guarantee that you and your teammates avoid building more functionality on top of unstable code.
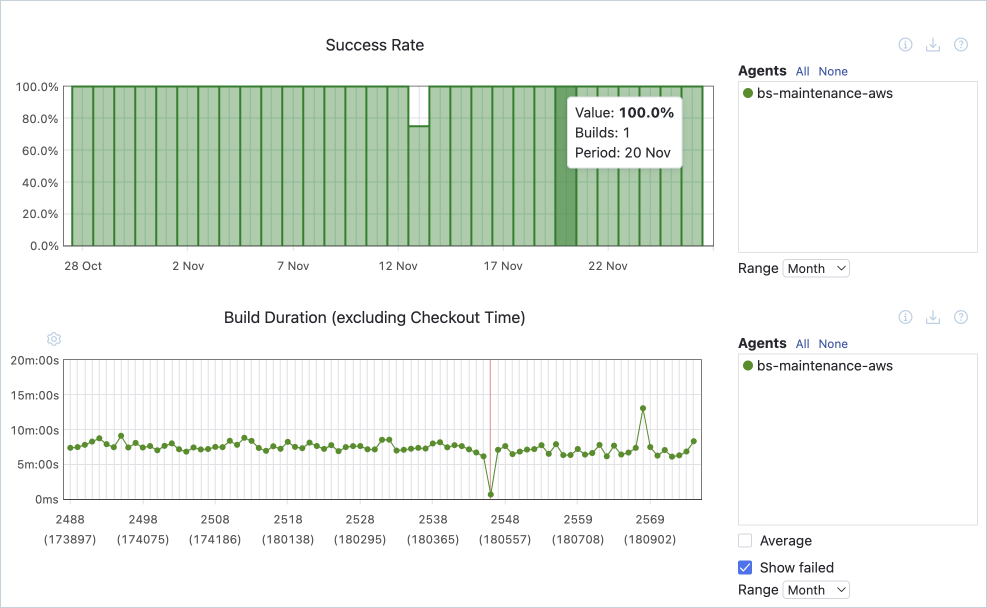
Failed deployments
Failed deployments result in unintended downtime, require rolling back the deployments, or require urgent fixes. The count of failed deployments is used to calculate the change failure rate.
Monitoring the proportion of failures out of the total number of deployments helps measure your performance against SLAs.
However, remember that a target of zero (or very few) failed deployments is not necessarily realistic and can encourage teams to prioritize certainty instead of consistently delivering a quality product. This mindset can result in longer lead times and larger deployments as changes are batched together. Because larger deployments contain a higher number of variables, there is a higher likelihood of failures in production that are harder to fix (due to there being more changes to wade through).
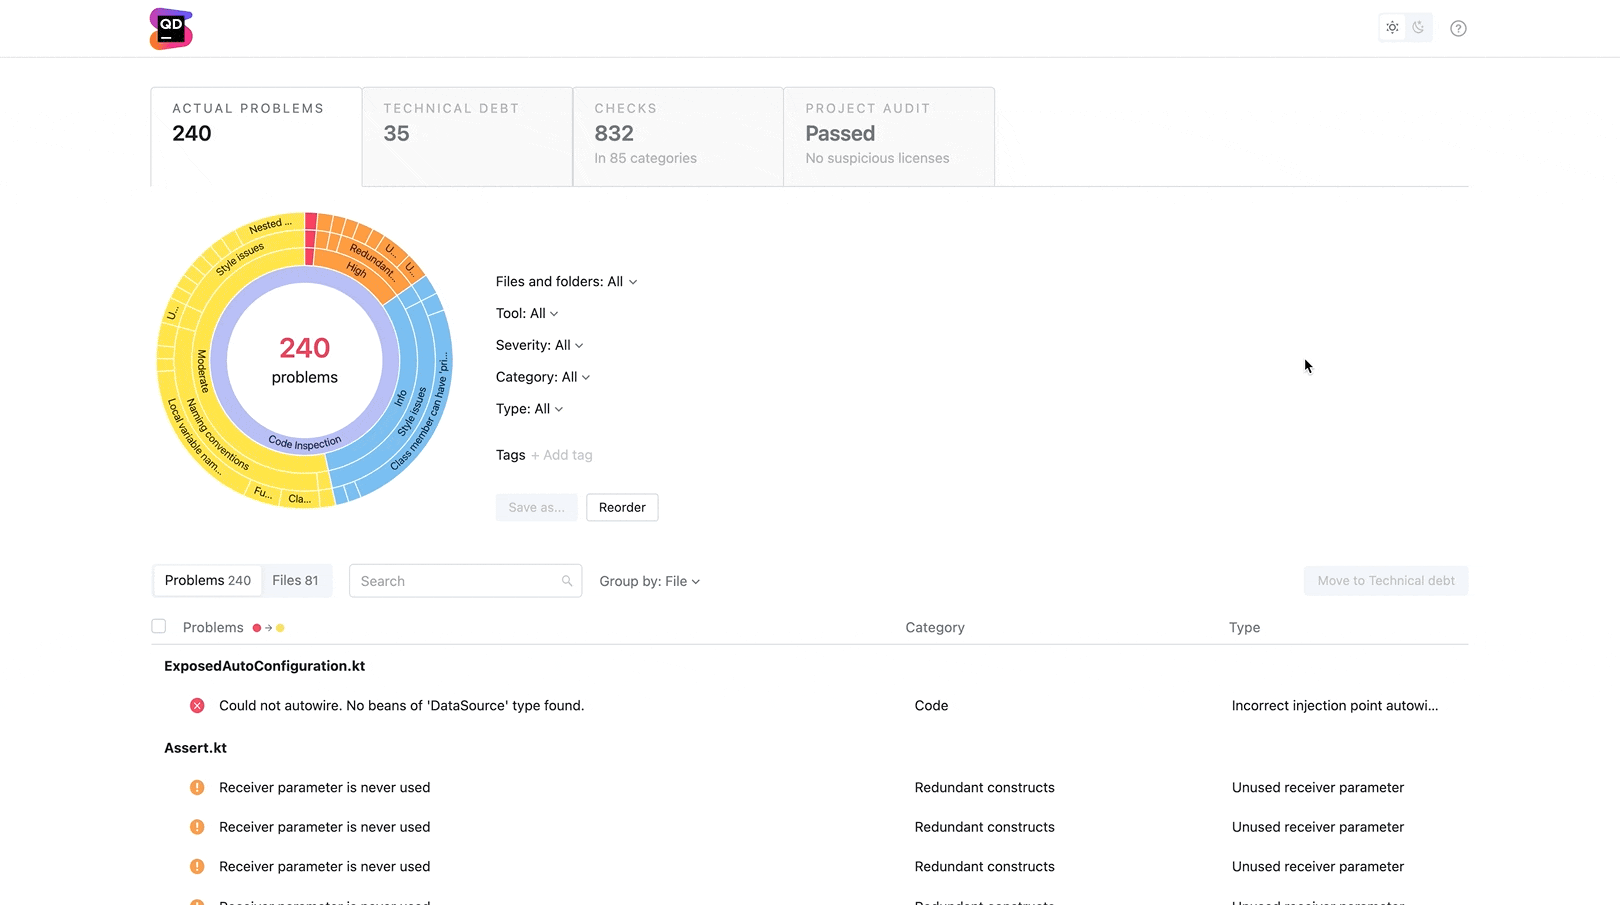
Defect count
In contrast to the failed deployment metric, the defect count refers to the number of open tickets in your backlog classified as bugs. This CI metric can be further divided into issues found in testing, staging, and production.
Monitoring the number of defects helps alert you if a general upward trend develops, indicating that bugs may be getting out of hand. Keep in mind, however, that making this metric a target can lead your team to focus more on classifying tickets than fixing them.
Deployment size
As a result of deployment frequency, deployment size – as measured by the number of story points included in a build or release – can be used to monitor batch size within a particular team.
Keeping deployments small shows your team is committing changes regularly, with all the benefits that entails. However, as story estimates are not comparable across development teams, this metric should not be used to measure overall deployment size.
Conclusion
These DevOps metrics allow you to better understand how well your CI/CD pipeline is performing in terms of deployment speed and software quality.
By tracking these metrics, you can identify the areas of your process that need your attention the most. Once you’ve made changes, continue monitoring the relevant metrics to verify whether they had the intended effect.
However, while metrics can serve as useful performance indicators, it’s important to read the numbers in context and consider which behaviors a particular metric might incentivize.
Bear in mind that the goal is not the numbers themselves but keeping your pipeline fast and reliable so that you can continue delivering value to users and, in turn, support your organization’s goals.