Quick start guide
0. Before you start
Is CLion a cross-platform IDE?
Yes, you can install and run CLion on Windows, macOS, and Linux.
See Install CLion for OS-specific instructions.
See CLion keyboard shortcuts for instructions on how to choose the right keymap for your operating system, and learn the most useful shortcuts.
What compilers and debuggers can I work with?
CLion supports GCC, Clang, and Microsoft Visual C++ compiler.
CLion bundles GDB and LLDB debuggers, and you can switch to a custom GDB binary (see the Debug chapter for details).
What build systems are supported? What are the project formats?
CLion fully integrates with the CMake build system: you can create, open, build and run/debug CMake projects seamlessly. CMake itself is bundled in CLion, so you don't need to install it separately unless you decide to use a custom version.
Apart from CMake, CLion supports compilation database, Gradle, and Makefile projects. Currently, you cannot create a new project of these types within CLion, but you can open and manage an existing one with full code insight available.
Refer to Project Formats for more detail.
Do I need to install anything in advance?
For C/C++ projects, CLion uses GCC/G++, Clang, or MSVC toolset.
On Windows, it means that you can select between the MinGW/ MinGW-w64 or Cygwin environment, WSL, or Visual Studio if you plan to use Microsoft Visual C++ compiler. For details, refer to Tutorial: Configure CLion on Windows.
On macOS, the required tools might be already installed. If not, update command line developer tools as described in Configuring CLion on macOS.
On Linux, compilers and make might also be pre-installed. Otherwise, in case of Debian/Ubuntu, install the build_essentials package and, if required, the llvm package to get Clang.
Are other languages besides C++ supported as well?
Yes, CLion fully supports Python, Objective-C/C++, HTML (including HTML5), CSS, JavaScript, and XML. Support for these languages is implemented via the bundled plugins, which are enabled by default. See CLion features in different languages for more details.
You can install other plugins to get more languages supported in CLion (such as Rust, Swift, or Markdown). See Valuable language plugins and explore the Plugins page in Ctrl+Alt+S.
1. Open/Create a project
Open a local project
For CMake projects, use one of the following options:
Select File | Open and locate the project directory. This directory should contain a CMakeLists.txt file.
Select File | Open and point CLion to the top-level CMakeLists.txt file, then choose Open as Project.
Select File | Open and locate the CMakeCache.txt file then choose Open as Project.
To open a compilation database project, go to , point CLion to the folder containing compile_commands.json or to the compile_commands.json file itself (then select Open as Project).
To open a Makefile project, go to , point CLion to the folder containing the top-level Makefile or to the Makefile itself (then select Open as Project).
To open a Gradle project, go to , point CLion to the folder containing build.gradle or to the build.gradle file itself (then select Open as Project).
Checkout from a repository
Click Checkout from Version Control on the Welcome screen or select VCS | Checkout from Version Control from the main menu and choose your version control system.
Enter the credentials to access the storage and provide the path to the sources. CLion will clone the repository to a new CMake project.
Create a new CMake project
Select from the main menu or click New Project on the Welcome screen.
Set the type of your project: C or C++, an executable or a library.
Note that STM32CubeMX and CUDA are also CMake-based project types.
Provide the root folder location and select the language standard.
CLion creates a new CMake project and fills in the top-level CMakeLists.txt:

The initial CMakeLists.txt file already contains several commands. Find their description and more information on working with CMake in our tutorial.
2. Take a look around
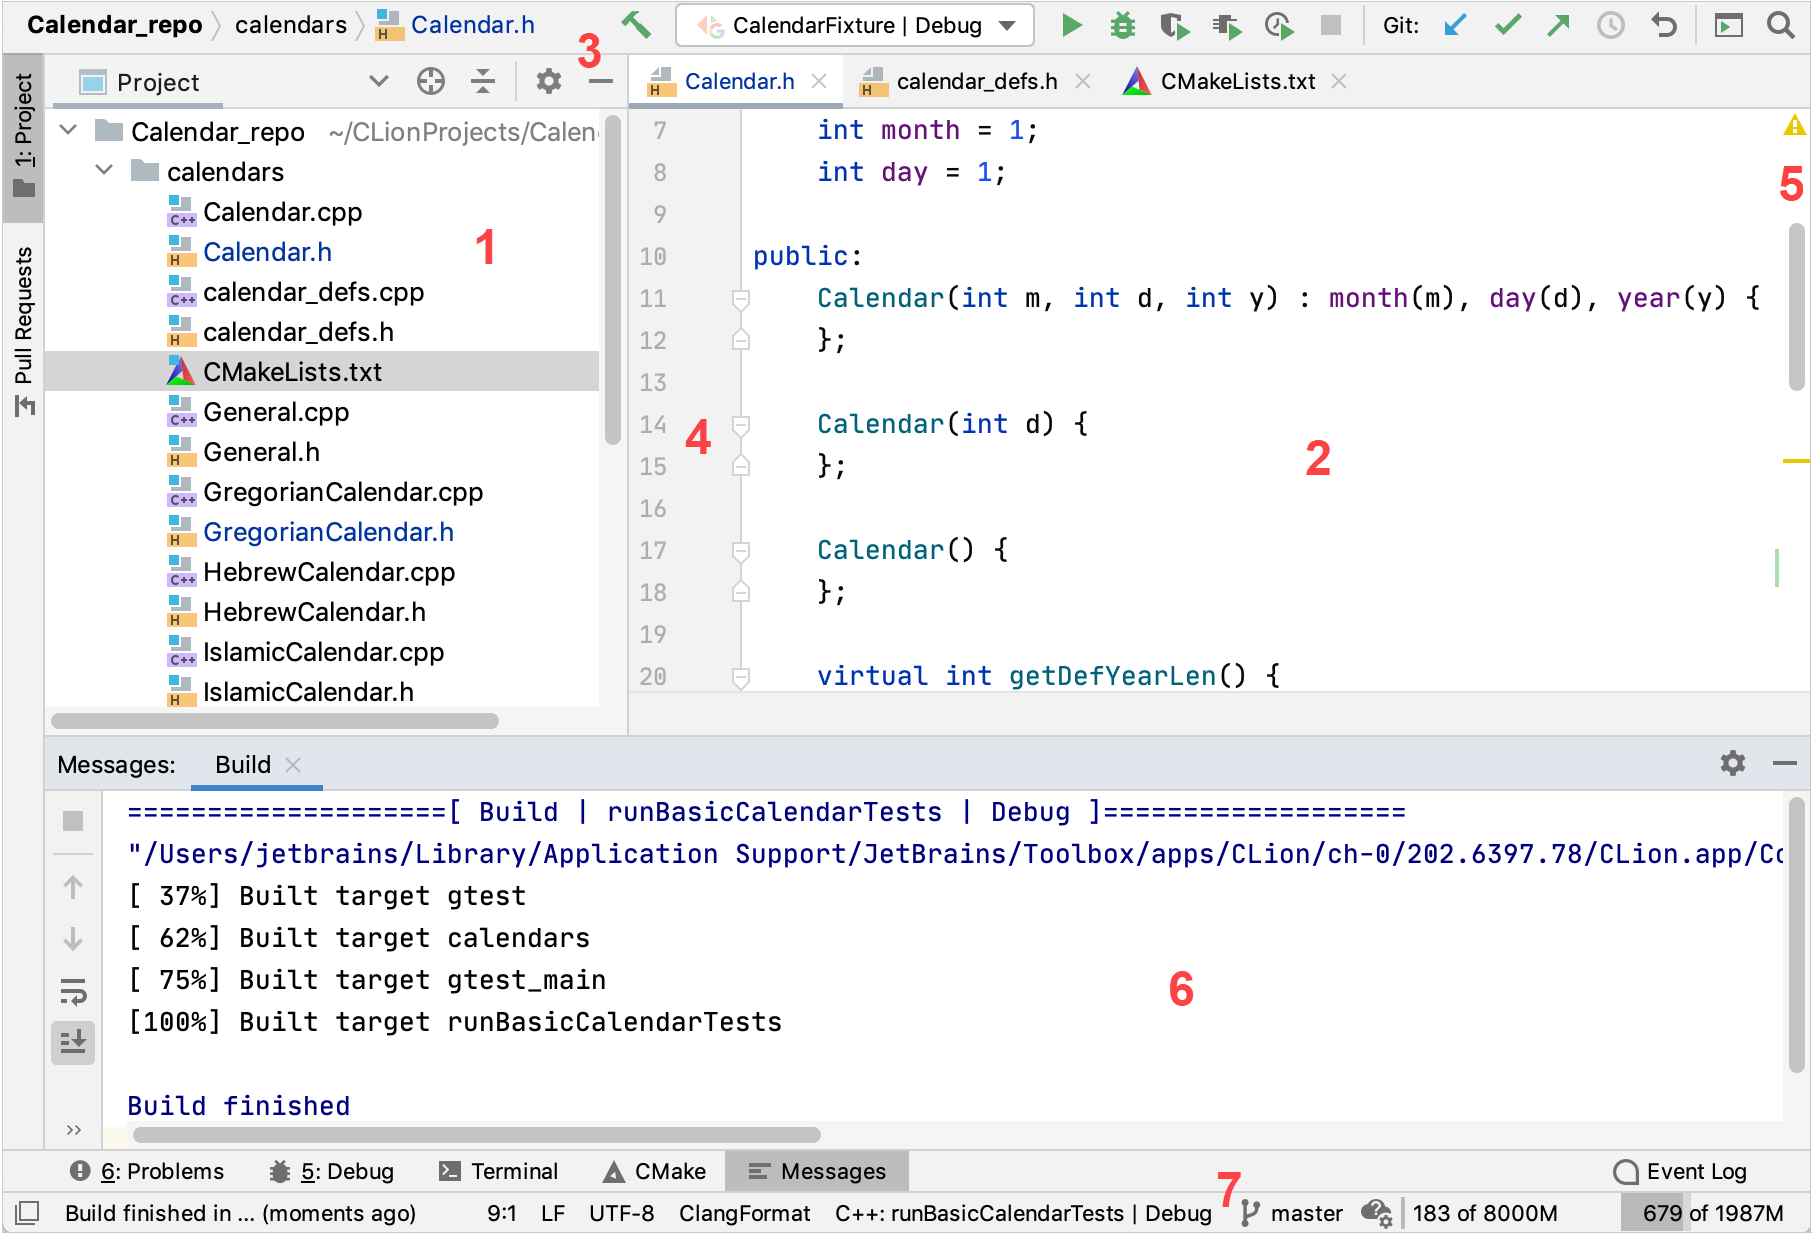
Project view shows your project files and directories. From here, you can manage project folders (mark them as sources, libraries, or excluded items), add new files, reload the project, and call for other actions such as Recompile.
Editor is where you view, write, and edit your code. The editor shows each file in a separate tab. You can also split the editor vertically
or horizontally
to view several tabs simultaneously.
Navigation bar helps you switch between the files' tabs, and the Toolbar provides quick access to run/debug and VSC-related actions.
Left gutter- the vertical stripe to the left of the editor - shows breakpoints and clickable icons to help you navigate through the code structure (for example, jump to a definition or declaration) and run
main()or tests.Right gutter shows the code analysis results with the overall file status indicator at the top.
Tool windows represent specific tools or tasks such as TODOs, CMake, terminal, or file structure.
Status bar shows various indicators for your project and the entire IDE: file encoding, line separator, memory usage, and others. Also, here you can find the resolve context switcher.
Any time you need to find an IDE action, press Ctrl+Shift+A or go to and start typing the name of a command, setting, or even a UI element that you are looking for: 
3. Customize your environment
Change the IDE appearance
The quickest way to switch between the IDE's color schemes, code styles, keymaps, viewing modes, and look-and-feels (UI themes) is the Switch... pop-up. To invoke it, click or press Ctrl+`: 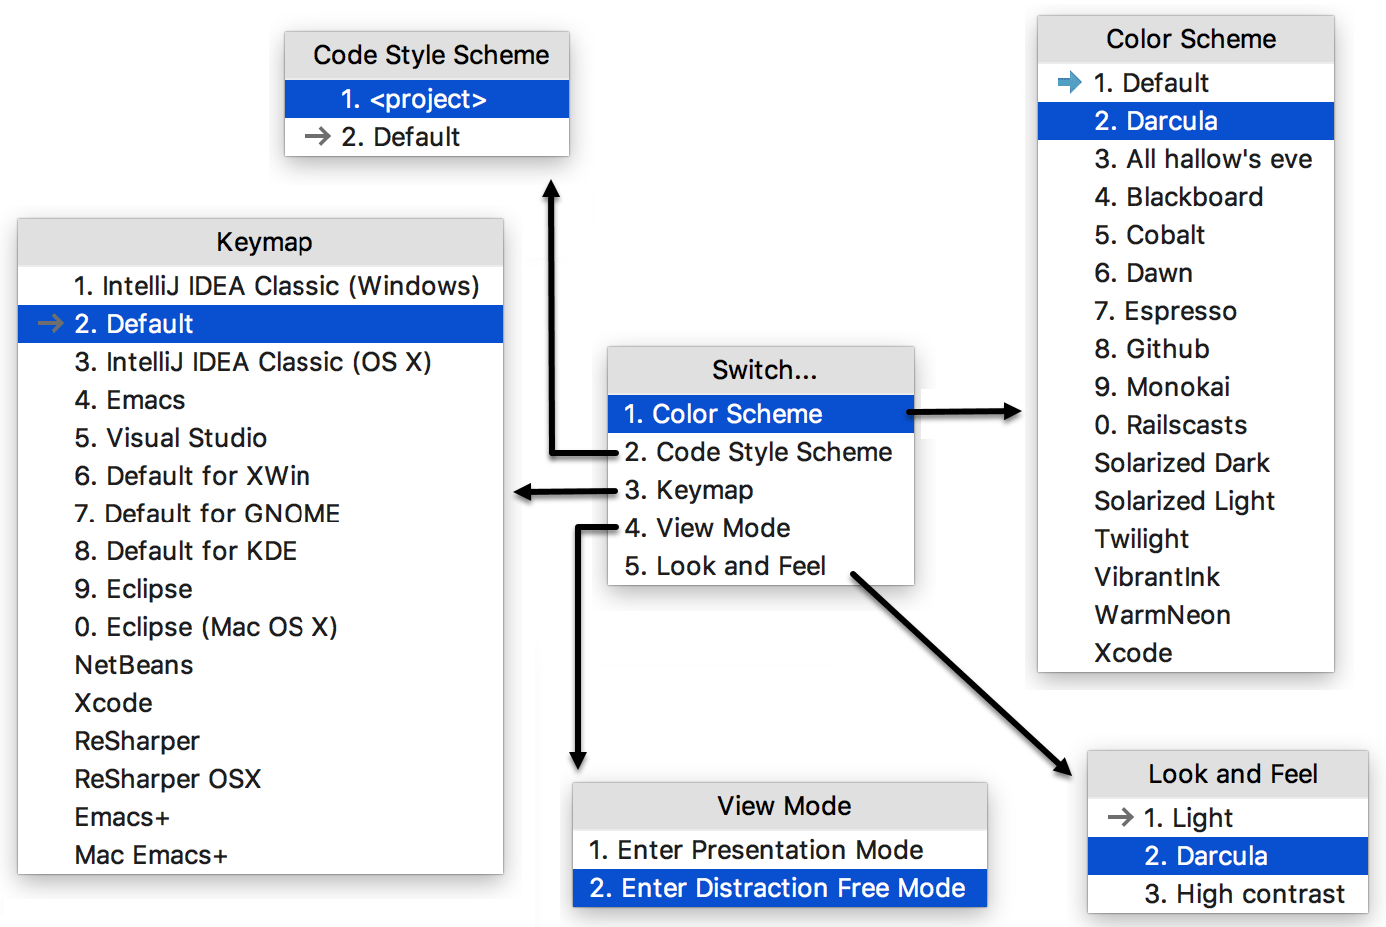
To explore all the customizable options, go to the dedicated pages in Ctrl+Alt+S.
Tune the editor
Pages under the Editor node of the dialog help you adjust the editor’s behavior, from the most general settings (like Drag'n'Drop enabling and scroll configuration) to highlighting colors and code style options.
Code styles are configurable for each language separately in the pages under the node. For C/C++, you can set one of the predefined code styles or provide your own, and configure the desired naming convention including the header guard template: 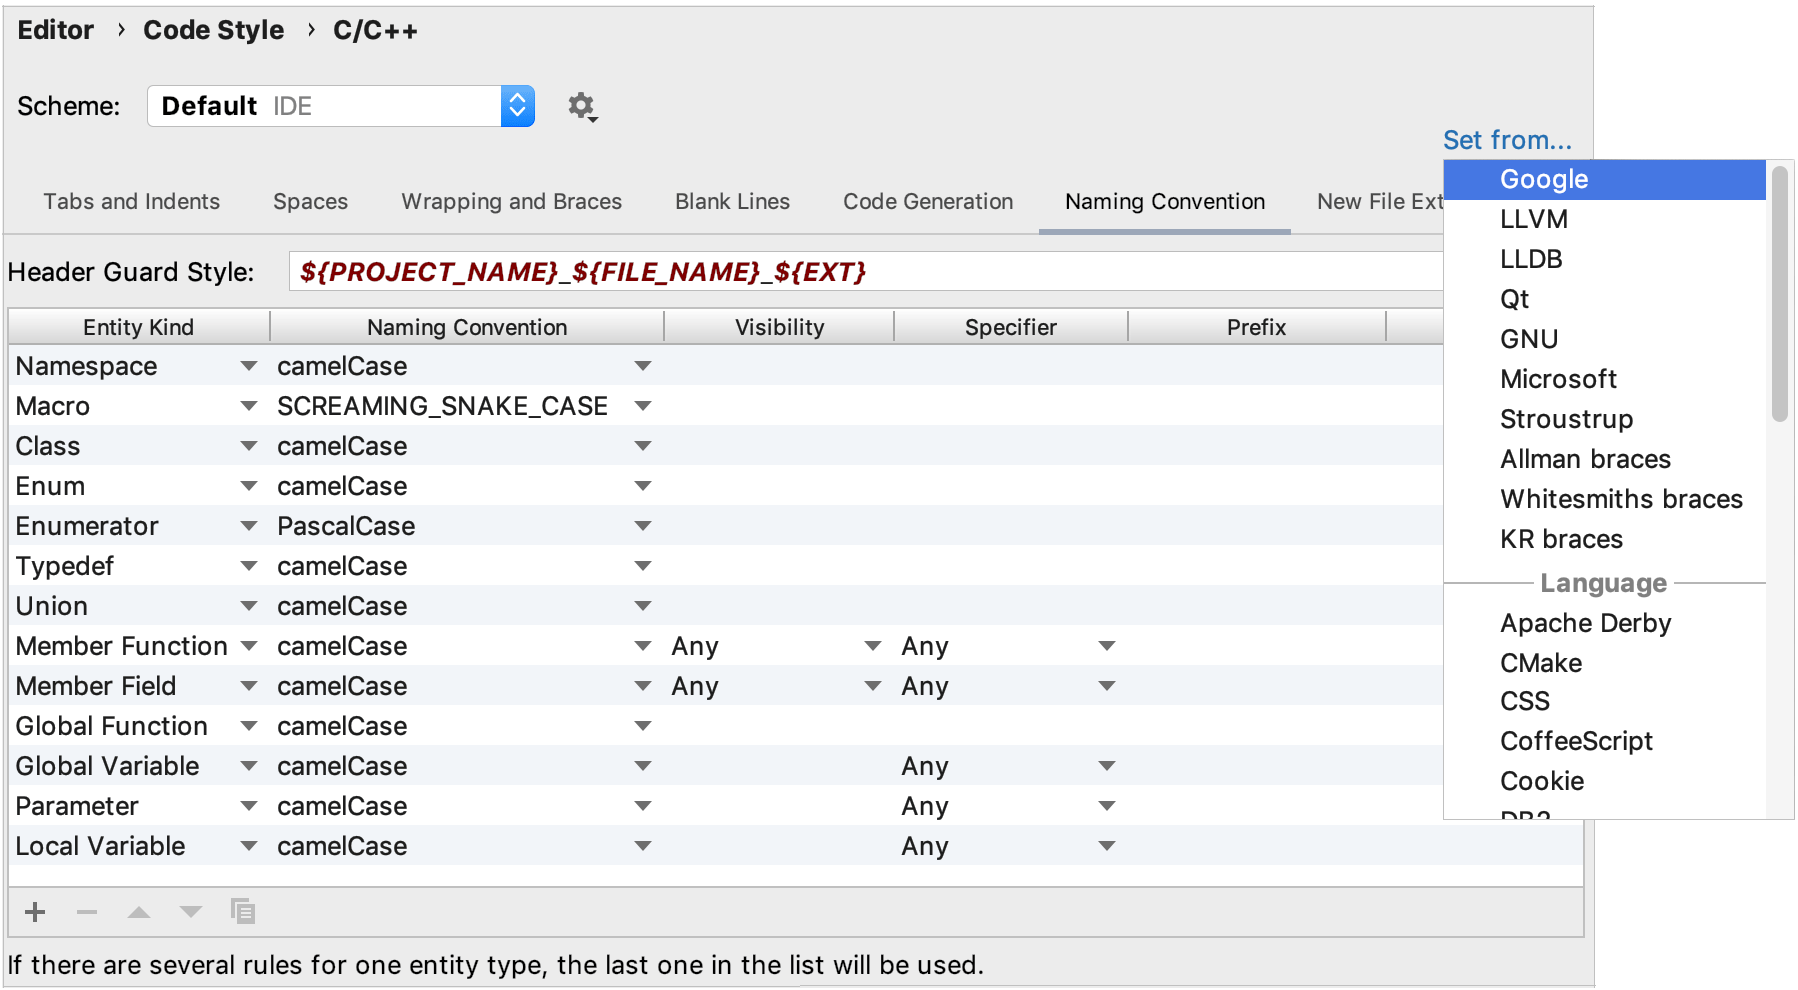
Adjust the keymap
In CLion, almost every action possible in the IDE is mapped to a keyboard shortcut. To view the default mapping, call .
You can customize the shortcuts in . Use one of the predefined keymaps (Visual Studio, Emacs, Eclipse, NetBeans, Xcode, and others) and tune it as required, or create your own keymap from scratch.
There are also plugins that extend the list of available keymaps. For example, VS Code Keymap or Vim emulation (which includes the Vim keymap). Find more useful plugins for the CLion editor in Valuable non-bundled plugins.
4. Code with assistance
Auto-completion
Basic completion Ctrl+Space in CLion works as you type and gives a list of all available completions. To filter this list and see only the suggestions that match the expected type, use Smart completion Ctrl+Shift+Space: 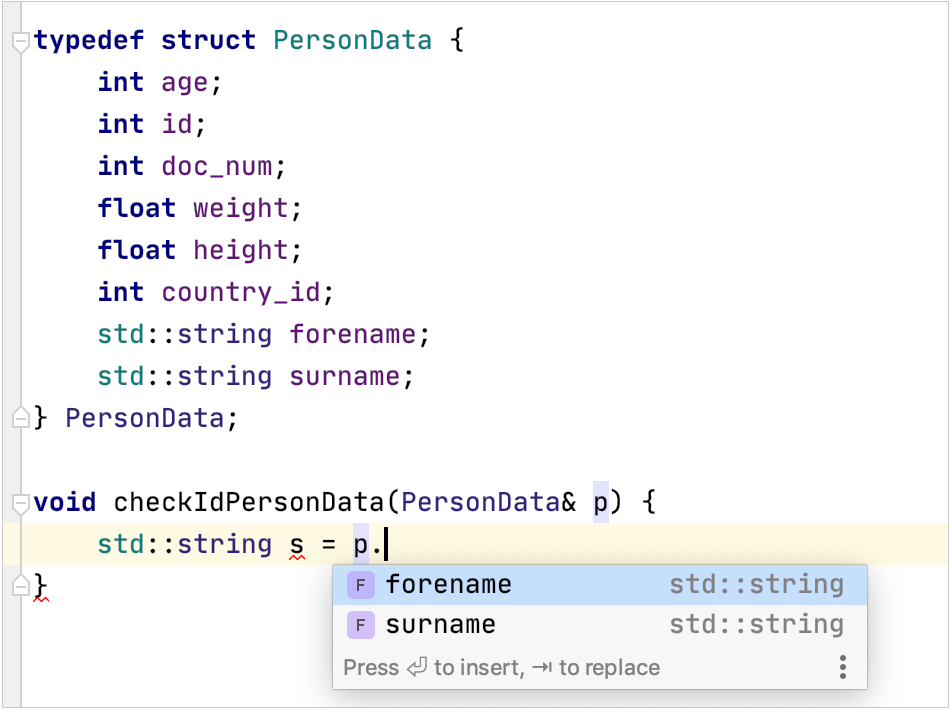
Code generation
Even an empty class or a new C/C++ file contains boilerplate code, which CLion generates automatically. For example, when you add a new class, CLion creates a header with stub code and header guard already placed inside, and the corresponding source file that includes it.
One of the most useful code generation features is create from usage. It helps you focus on the ideas as they come up and takes care of the routine. For example, when you call a function that is not yet implemented, there is no need to break the flow: press Alt+Enter to generate stub code that you can come back to later. Create from usage works for variables and classes as well: 
To get the list of code generation options at any place in your code, press Alt+Insert to invoke the Generate menu: 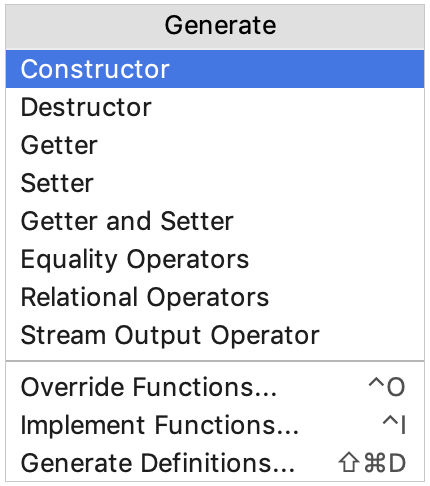
These options can help you skip a lot of code writing. In addition to generating constructors/destructors, getters/setters, and various operators, you can quickly override and implement functions: 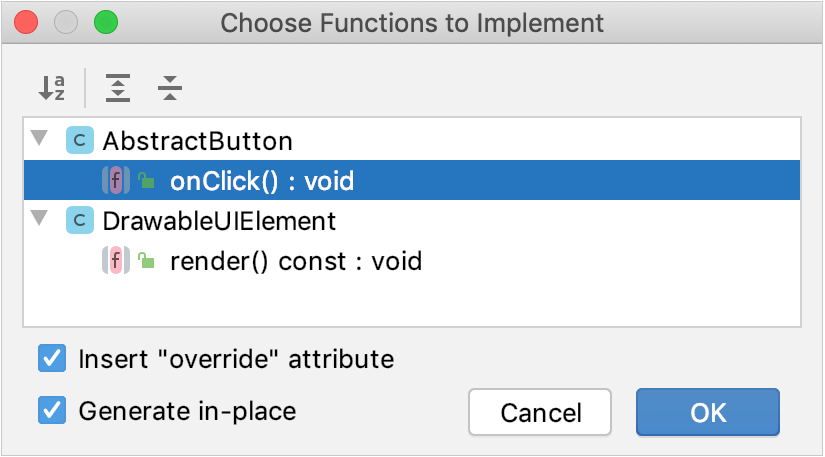
Live templates are the tool to generate entire code constructs. Find the list of ready-to-use templates in . To paste a template in your code, call or press Ctrl+J, for example: 
To quickly surround your code with loops and conditional statements like if, while, for, #ifdef, call or press Ctrl+Alt+T: 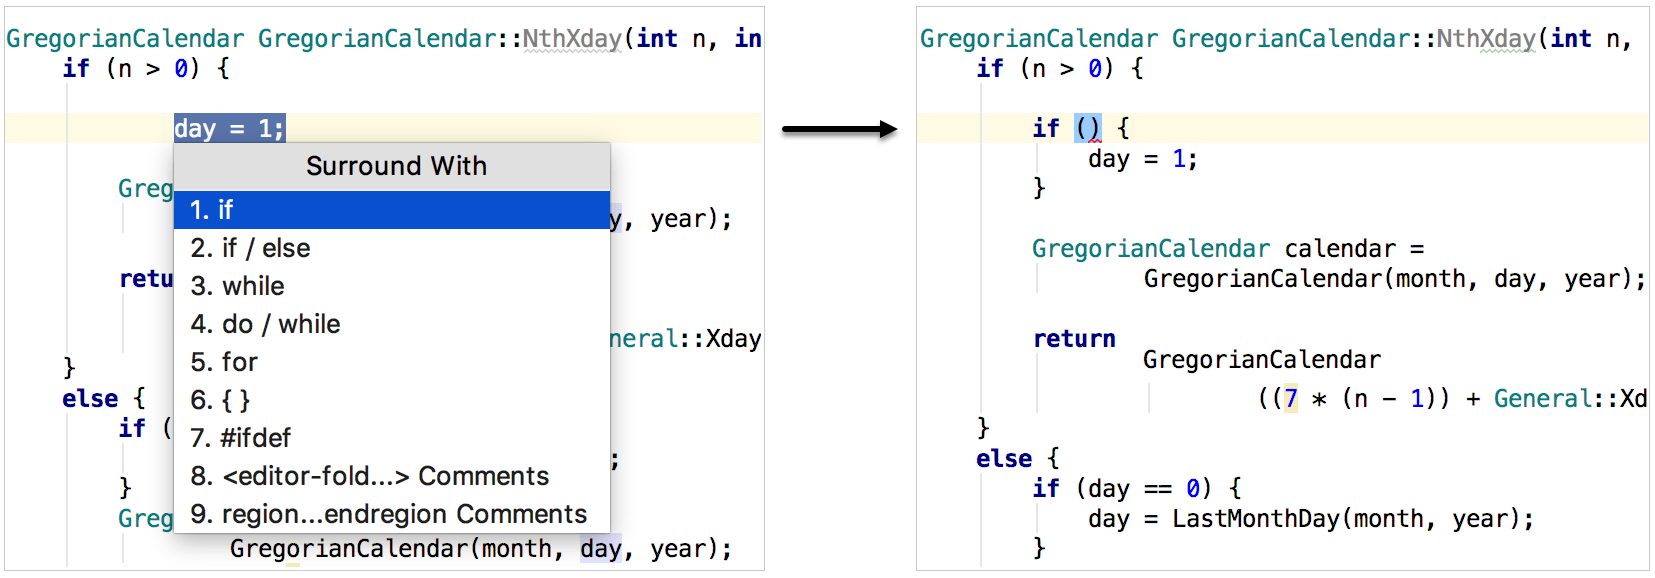
Intentions and quick-fixes
When you see a light bulb next to a symbol in your code, it means that CLion's code analysis has found a potential problem or a possible change to be made:
indicates an error and lets you choose a quick fix for it,
indicates that one or several intention actions are available.
Click the light bulb icon (or press Alt+Enter) and choose the most suitable action or quick-fix: 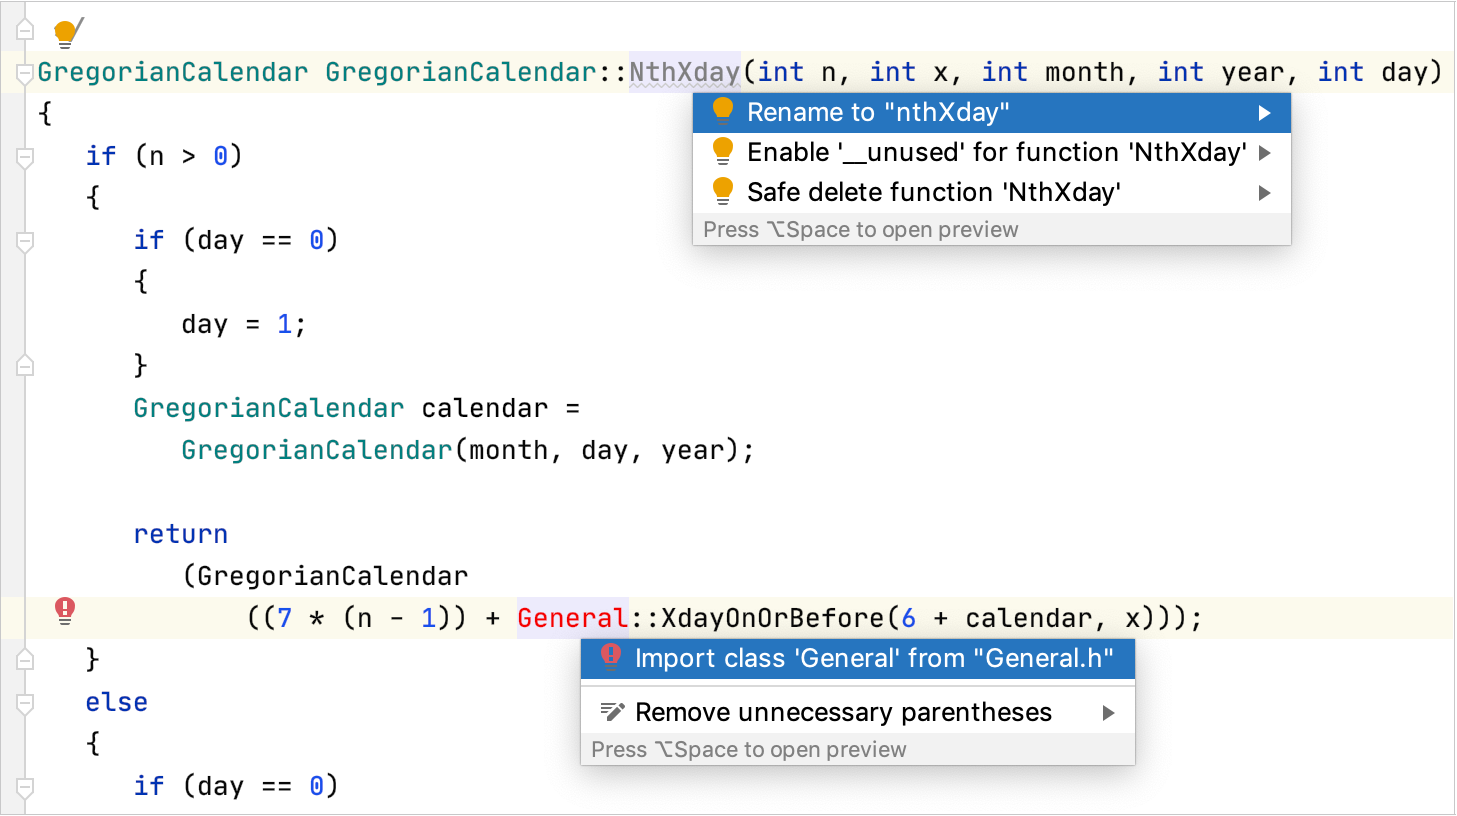
Inspections
During on-the-fly code analysis, CLion highlights suspicious code and shows colored stripes in the right-hand gutter. You can hover the mouse over a stripe to view the problem description and click it to jump to the corresponding issue. The sign at the top of the gutter indicates the overall file status: 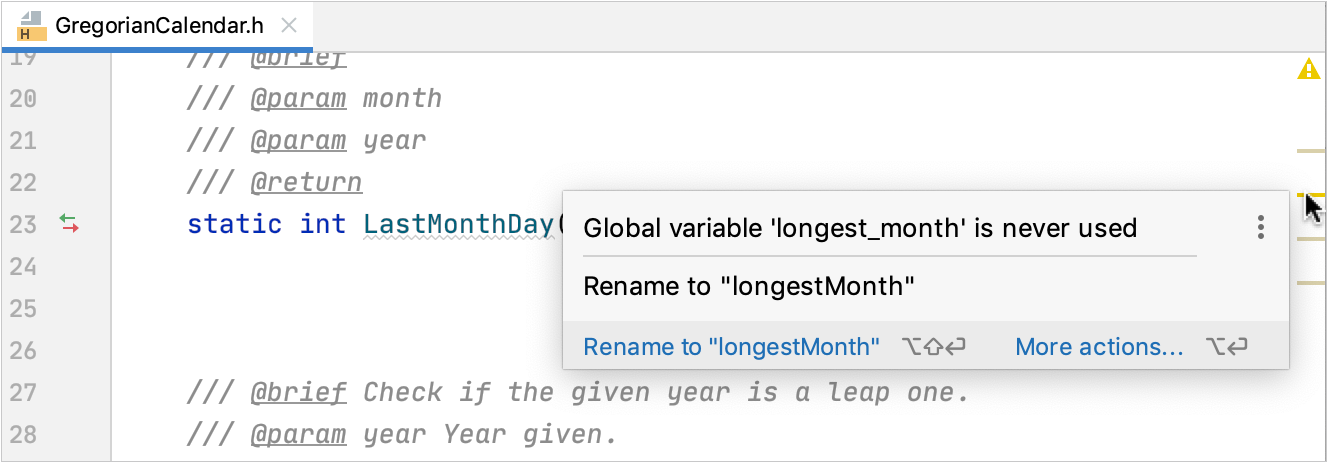
CLion detects not only compilation errors but also code inefficiencies like unused variables or dead code. Also, it integrates a customizable set of Clang-tidy checks.
To enable or disable inspections, configure their severity levels (whether an inspection should raise an error or just be shown as a warning) and set the scopes, go to .
You can also run inspections on demand for the whole project or a custom scope, and view the results in a separate window. For this, call or use Ctrl+Alt+Shift+I for a particular inspection. From the results window, you can batch-apply quick-fixes to several issues at a time: select the issues, click the bulb button (or press Alt+Enter) and select the resolution to be applied.

Refactorings
Refactorings help improve your code without adding new functionality, making it cleaner and easier to read and maintain. Use the Refactor menu or call Refactor This... Ctrl+Alt+Shift+T to get the list of refactorings available at the current location: 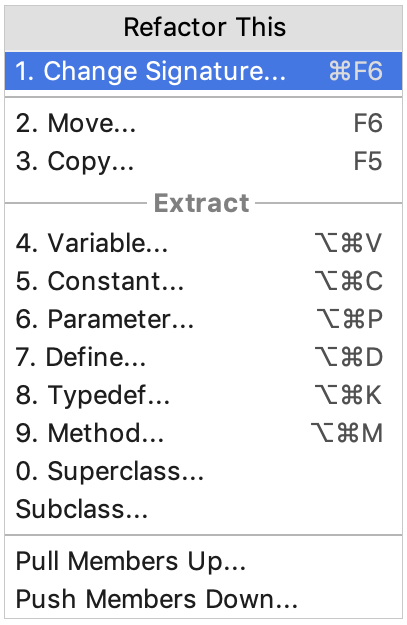
For example,
Rename Shift+F6 renames a symbol in all references;
Change Signature Ctrl+F6 adds, removes, or reorders function parameters, changes the return type, or updates the function name (affecting all usages);
Inline Ctrl+Alt+N/ Extract inlines or extracts a function, typedef, variable, parameter, define, or constant;
Pull Members Up/Down() safely moves class members to the base or subclass.
5. Explore your code
Search everywhere
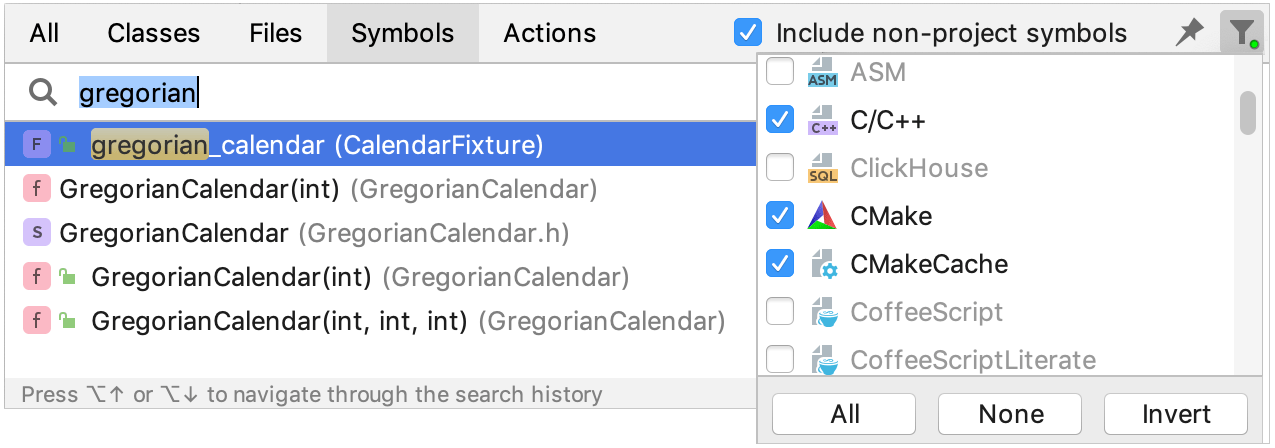
To search for anything in CLion, be it an item in your codebase, action, or UI element, press Shift twice and start typing what you are looking for in the Search Everywhere dialog. Use the filter menu to narrow your search:
Find usages
To locate the usage of any code symbol, call Find Usages(Alt+F7 or ). You can filter the results and jump back to the source code: 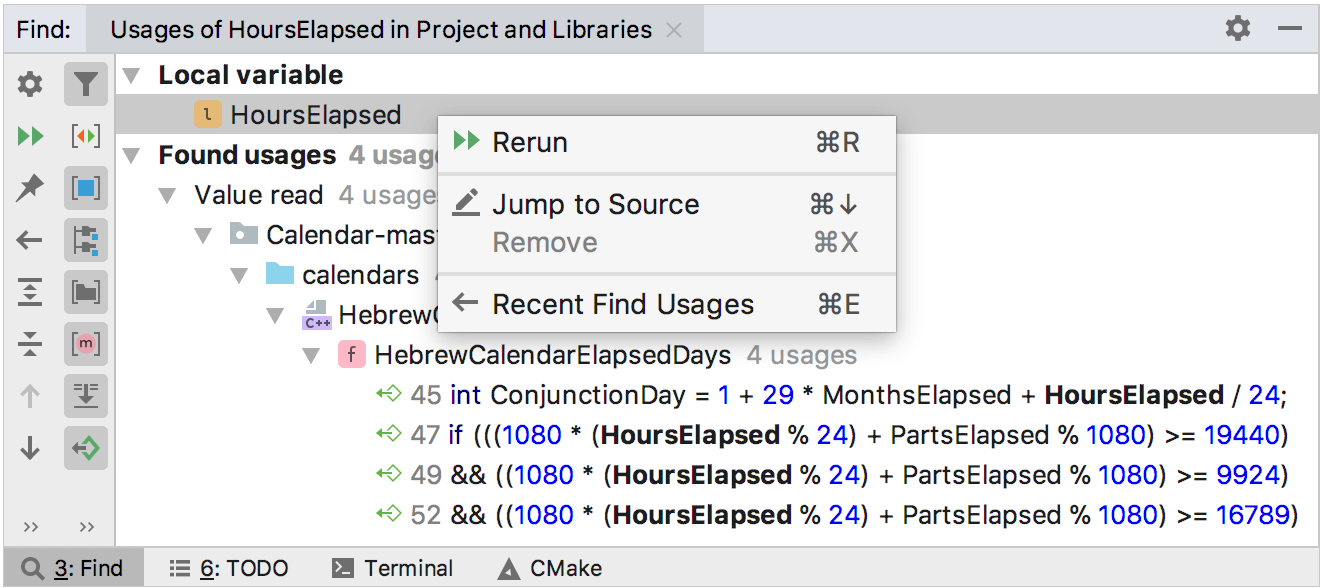
Navigate in the code structure
Switch between header and source file Ctrl+Alt+Home
Go to declaration/definition Ctrl+BCtrl+Alt+B
Show file structure Alt+7
View type hierarchy Ctrl+H
View call hierarchy Ctrl+Alt+H
View import hierarchy Alt+Shift+H
For your code, CLion builds the hierarchies of types, call, imports, and functions. To view them, use the shortcuts given above or the commands in the menu. For example, type hierarchy helps you not only to navigate the code but also to discover what type relationships exist in the your codebase: 
To explore the structure of the currently opened file, call or press Alt+7: 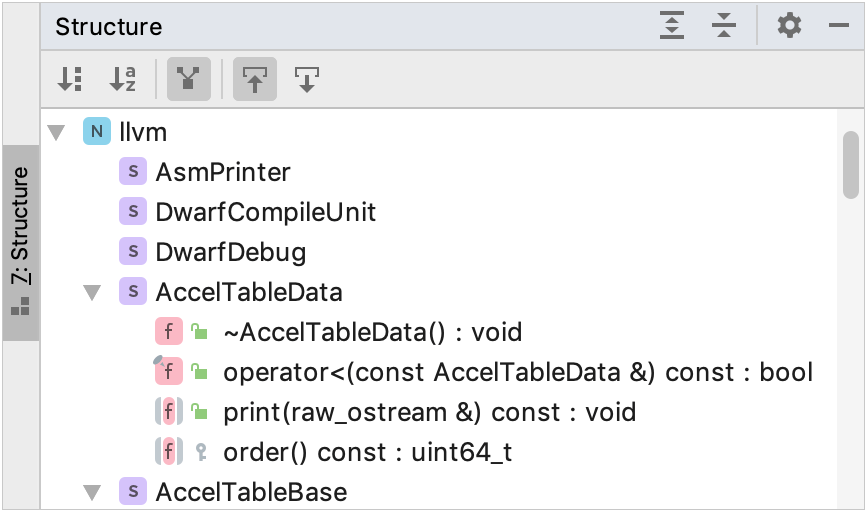
Also, use the left gutter icons to quickly jump to a declaration/definition or navigate through the class hierarchy (/
,
/
).
View pop-up documentation
Quick Documentation popup (available on mousehover or via the Ctrl+Q shortcut) helps you get more information on a symbol at caret without leaving the current context. Depending on the element you invoke it for, the popup shows:
function signature details,
code documentation (either regular or Doxygen comments),
inferred types for variables declared as
auto:
formatted macro expansions:

Besides, you can instantly view the definition of a symbol at caret. Press Ctrl+Shift+I to invoke the Quick Definition popup: 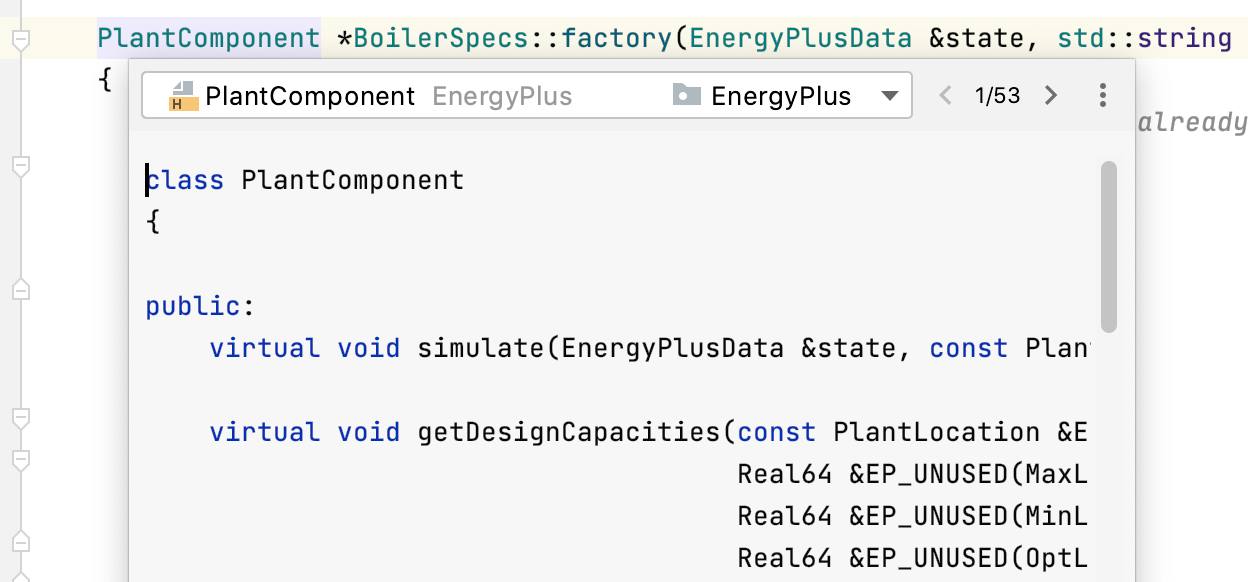
6. Build and run
Run/Debug configurations
For each target in a CMake or Gradle project, CLion creates a Run/Debug configuration. It is a named run/debug setup that includes target, executable, arguments to pass to the program, and other options.
Run/Debug configurations are generated from templates, such as CMake Application, Google Test, or Remote GDB Debug. The templates are customizable: when you edit a template parameter, you change the default settings of all configurations that will be created from this template later.
dialog is accessible from the Run menu or the configuration switcher. Here you can manage the templates and add, delete, or edit your configurations. For example, you can customize the steps to be taken Before launch- call external tools (including the remote ones), use CMake install, or even run another configuration. 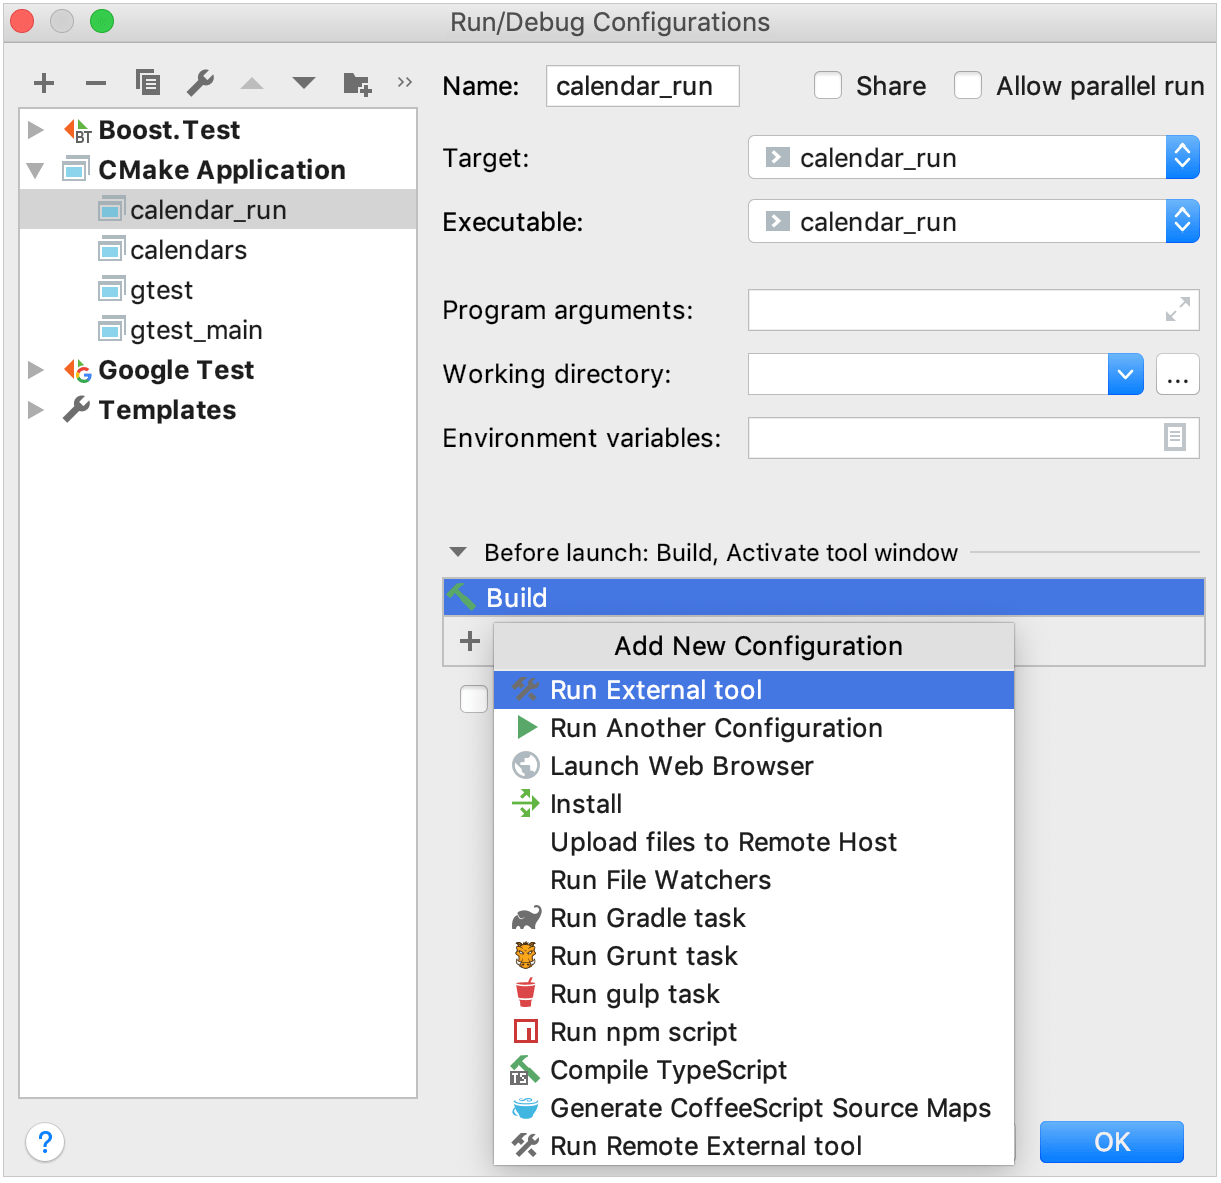
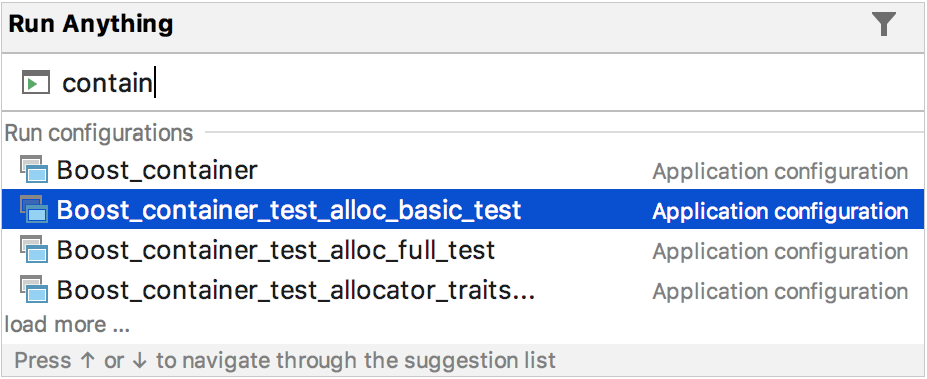
To launch your program, select the desired configuration and use commands from the Run menu or press Shift+F10. Alternatively, invoke the Run Anything dialog by pressing Ctrl twice and start typing the configuration name:
Build actions
Build is included in many Run/Debug configuration templates as a default pre-launch step. However, you can also perform it separately by calling the desired action from the Build menu: 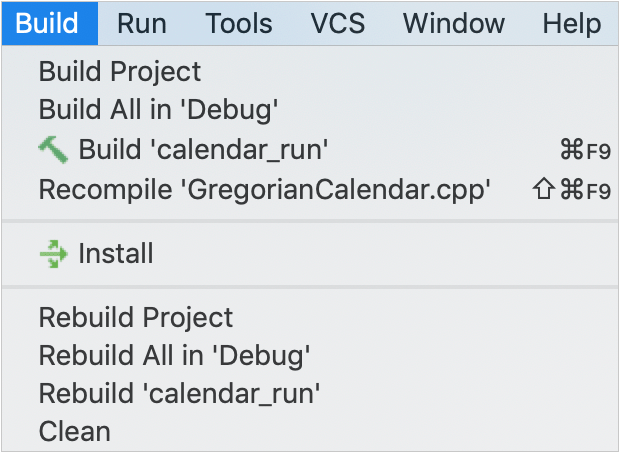
Notice the Recompile option that compiles a selected file without building the whole project.
Remote and embedded development
With CLion, you can also build and run/debug on remote machines including embedded targets. Refer to Remote development and STM32CubeMX projects for details.
7. Debug
CLion integrates with the GDB backend on all platforms (on Windows, the bundled GDB is available only for MinGW) and LLDB on macOS/Linux. You can switch to a custom version of GDB on all platforms. Also, CLion provides an LLDB-based debugger for MSVC on Windows.
Currently, the versions of the bundled debuggers are the following:
LLDB v 10.0.1 for macOS/Linux and 9.0.0 for Windows (MSVC)
GDB v 10.1 for macOS
GDB v 10.1 for Windows
GDB v 10.1 for Linux
Custom GDB v 7.8.x-10.1
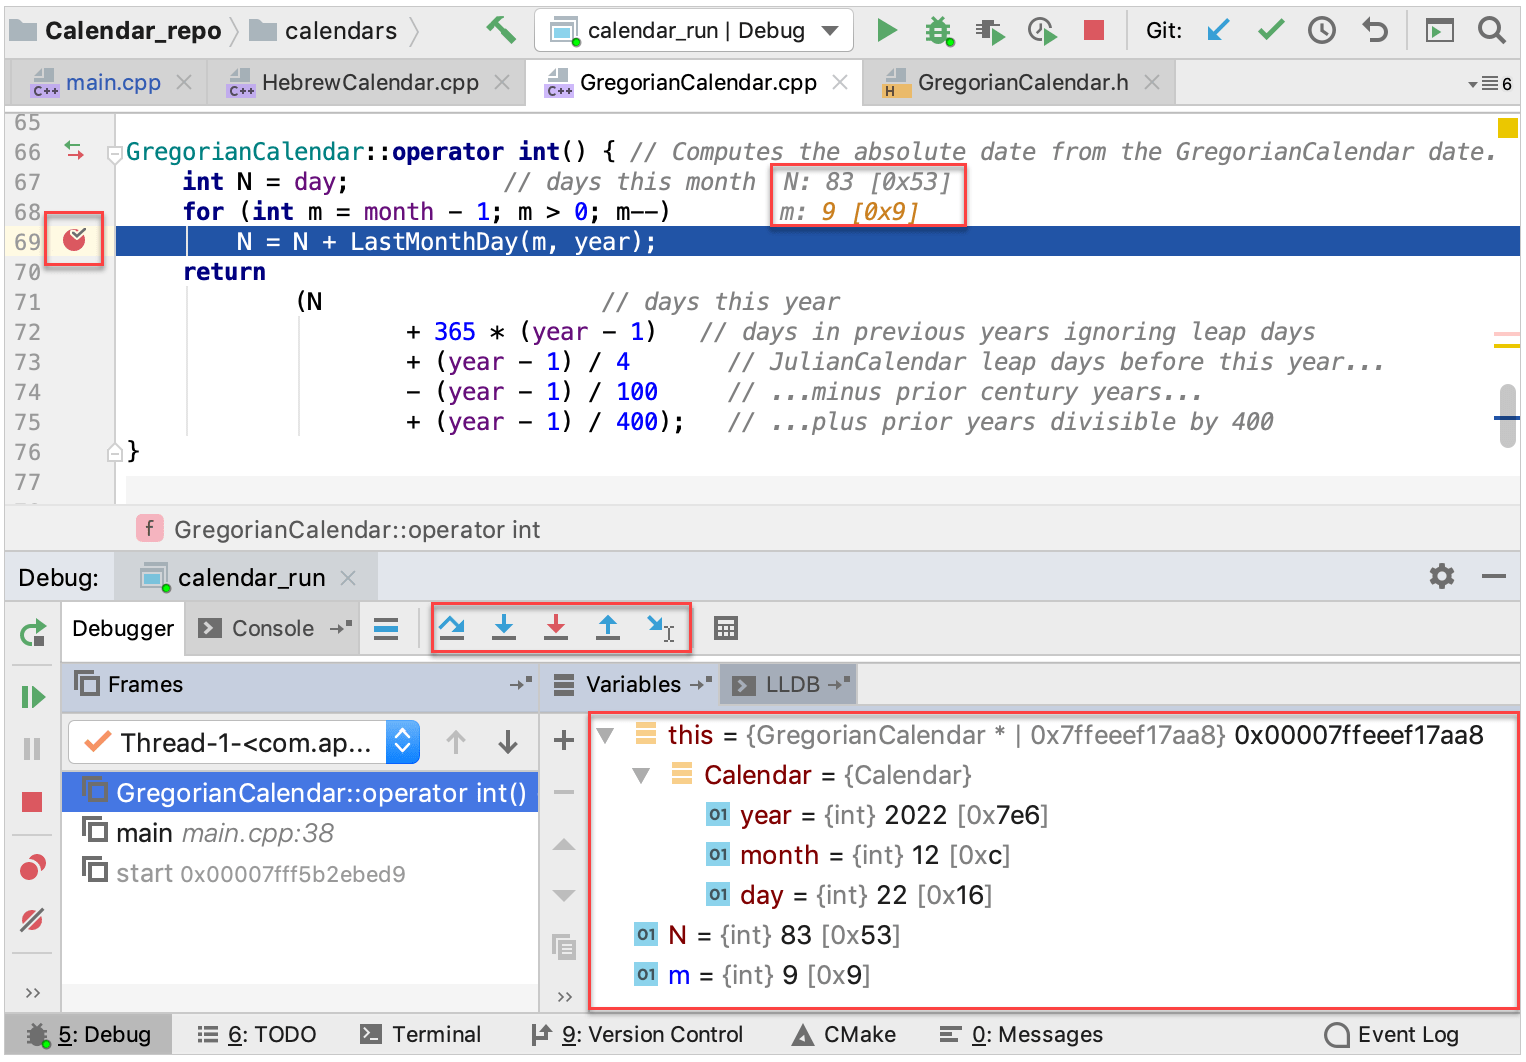
To start a debug session, select the desired configuration and press Shift+F9 or click . You can set breakpoints by clicking the gutter next to a code line. To follow through the execution process, use debugger's stepping actions
![]() .
.
In the Variables tab of the debugger tool window, you can explore the values and change them without interrupting your debug session. To evaluate an expression, click or press Alt+F8. CLion also shows the current variables' values right in the editor, and in case you enable hex view, it is shown inlined as well:
| Useful debugger shortcuts | |
|---|---|
| Toggle breakpoint | Ctrl+F8 |
| View breakpoint details/all breakpoints | Ctrl+Shift+F8 |
| Step over | F8 |
| Step into | F7 |
| Stop | Ctrl+F2 |
| Resume program | F9 |
| Debug code at caret | Shift+F9 within main() |
Besides, CLion debugger enables you to step into Disassembly, invoke Memory view, attach to a local process, and debug remotely using GDB/gdbserver.
8. Analyze at run-time
Some vulnerabilities and bugs can only be revealed during the program's execution: memory leaks, uninitialized accesses, concurrency issues, undefined behavior, and others. To help you catch run-time problems, CLion integrates Valgrind Memcheck and Google Sanitizers. Also, you can analyze your application performance using the built-in CPU Profiler and measure code coverage. For these tools, CLion provides visualized output and handy features like the option to import/export analysis results.
Settings for Valgrind, Sanitizers, and Profile are located under .
Valgrind Memcheck
Valgrind Memcheck in CLion works on Linux, macOS, and Windows via WSL. You need to install Valgrind, point CLion to the binary, set up the analysis flags, and run the program using or .
Google Sanitizers
Google Sanitizers are supported on Linux for certain versions of Clang and GCC. Take a look at our detailed guide on using Sanitizers in CLion.
CPU Profiler
CLion’s profiler, available on Linux and macOS, collects performance data for both user and kernel code of your application. The profiler collects performance metrics and visualizes them in flame charts and statistic views. To run it, call or use the button in the navigation bar.
Code Coverage
Code Coverage integration in CLion is based on llvm-cov/ gcov tools and is available for CMake applications and tests. Coverage results show the percentage of files per folder and lines per file covered during a launch. To get coverage measurements, set the necessary compiler flags and call or click .
9. Add unit tests
CLion supports Google Test, Boost.Test, Catch(2), and Doctest testing frameworks with the built-in test runner and dedicated Run/Debug configurations. For CMake targets linked with gtest or gmock, CLion creates Google Test configurations automatically.
Running tests is similar to running a regular executable: CLion passes the specified test classes or methods to the test runner. Test runner shows the progress bar, output stream, and tree view of the running tests, and indicates their status and duration: 
You can rerun particular tests, all of them, or only the failed ones , export test results and open previous results from the history.
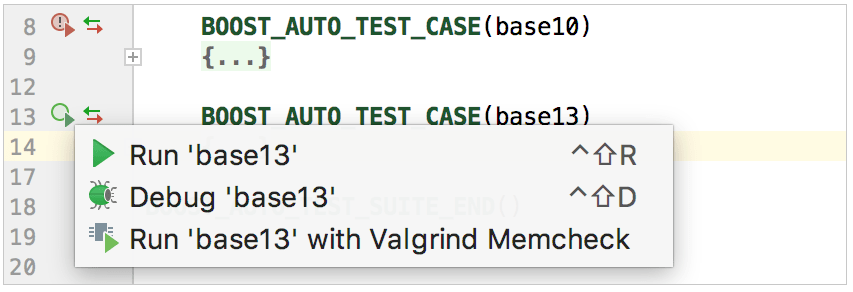
Icons in the left gutter help you quickly run/debug tests and check the test status, success or failure
:
10. Keep it under version control
VCS
CLion integrates with several version control systems: Git (or GitHub), Mercurial, Perforce, and Subversion. To manage the settings of a particular VCS, go to .
Use the VCS Operations Popup(Alt+` or ) to call version control commands. The list of actions in this popup includes both the currently enabled VCS and local history. For example:
| No VCS Enabled | VCS Enabled |
|---|---|
 |  |
You can find all the available VCS commands in the VCS section of the main menu. Also, some basic commands are accessible from the toolbar: 
Local history
In addition to full version control, you can go back and review changes step by step by browsing the local history. To view it for a file or folder, call . Here you can revert changes and create patches: 
11. Learn more
We hope this brief overview of the CLion essentials will give you a quick start. To dig deeper, take a look at other articles and sections in the webhelp, for example:
- Project formats
- Quick CMake tutorial
- Dynamic code analysis
- C++ Standards Compliance
- Remote development
- Embedded Development
- Unit testing tutorial
For news and useful tips, check our twitter and CLion blog.
Feel free to ask any questions on the community forum and don't hesitate to report problems in the CLion issue tracker.