FlexInspect
You can develop your own inspections specific to your project using the IntelliJ API and Kotlin. To run such inspections using Qodana, use the FlexInspect feature available on the Ultimate and Ultimate Plus licenses. To learn more about available Qodana licenses, visit the Subscription Options and Pricing page. You can also request a demo.
Using FlexInspect, You can:
Access the PSI representation of the source code
Debug new inspections on the fly
Observe your new custom inspections in action, including the highlighting of code fragments that don't behave as expected
With FlexInspect, you get access to the same API that is used by all IntelliJ IDEA and Qodana inspections. This allows you to run these inspections on your entire project using Qodana to ensure that your entire team follows the standards defined by you.
You can develop local inspections that run within a file scope and global inspections that run within a project scope as described in the Run Qodana locally section, and you can even analyze your code in CI pipelines. Currently, FlexInspect supports any language covered by IntelliJ IDEA either natively or through additional plugins. For example, Java, Kotlin, JavaScript, TypeScript, PHP, Go, Python, Ruby, SQL, XML, CSS, YAML, JSON, Shell, and Dockerfile are supported.
Prerequisites
Start by verifying that IntelliJ IDEA is installed on your machine.
Then, ensure that your version of IntelliJ IDEA supports the language for which you want to develop an inspection. Out of the box, IntelliJ IDEA supports Java and Kotlin. The Ultimate edition of IntelliJ IDEA also provides default support for JavaScript and TypeScript. To get support for other languages like PHP, Go, and Python, you can install plugins from JetBrains Marketplace. More detailed information about language support is available via the IntelliJ IDEA documentation portal.
Since all inspections are developed using the Kotlin language, you'll need to know the basics of Kotlin before you can begin developing your own inspections.
How FlexInspect works
You write your inspections in Kotlin and store them in the inspections directory of your project as .inspection.kts files. Each .inspection.kts file contains Kotlin code that analyzes your code using the API provided by the Program Structure Interface or PSI. IntelliJ IDEA reads .inspection.kts files, compiles the inspection code on the fly, and then executes the compiled inspections.
Program Structure Interface (PSI)
The PSI is an AST representation of your code corresponding to a source file's structure. In the case of Java code, the PSI reflects the basic blocks of a Java file like package and import statements, class statements, method invocations, and other nodes. FlexInspect uses the PSI tree representation of your code to get the list of the code nodes that can be inspected using your inspections.
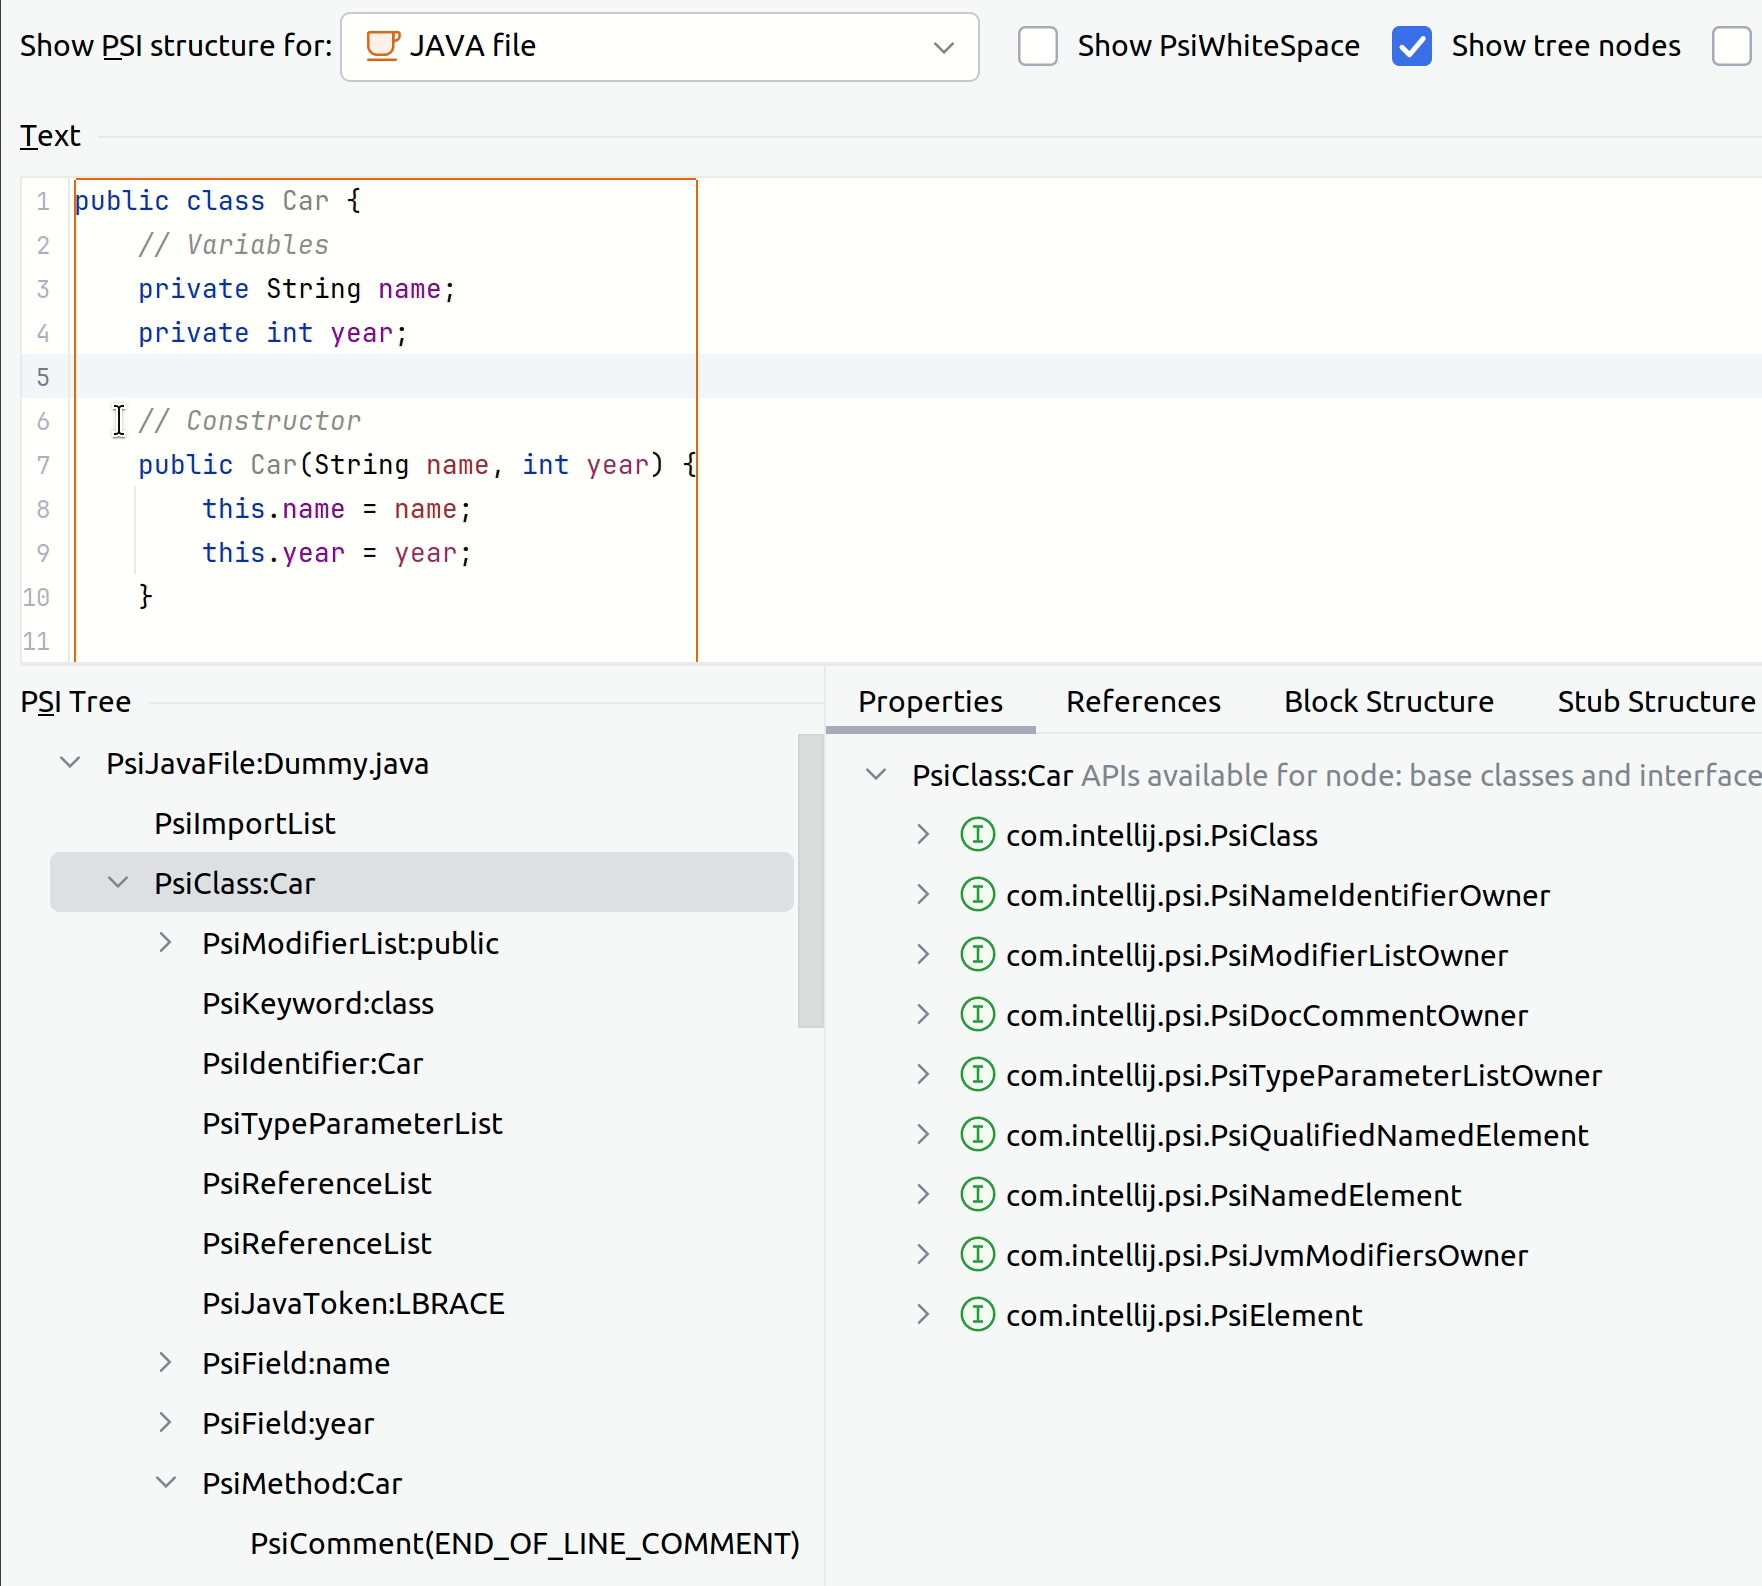
In IntelliJ IDEA, you can navigate through the PSI using the PSI Viewer tool window. To do this, open a file that you would like to view with the PSI Viewer, and then navigate to Tools | View PSI Structure of Current File.

Inspection types
With IntelliJ IDEA, you can create both local and global inspections.
Local inspections operate on the file level and analyze each file of your project individually. Once you create a local inspection, IntelliJ IDEA will run it on any file opened in the editor.
Global inspections operate on the project level and use the project scope as a basis for inspection. For example, you can create inspections that can check whether specific files exist in your project. See the Run Qodana locally section of the documentation for more information about how to run global inspections.
How to start
This section shows how to create an example inspection that will analyze whether a Java class has a constructor method.
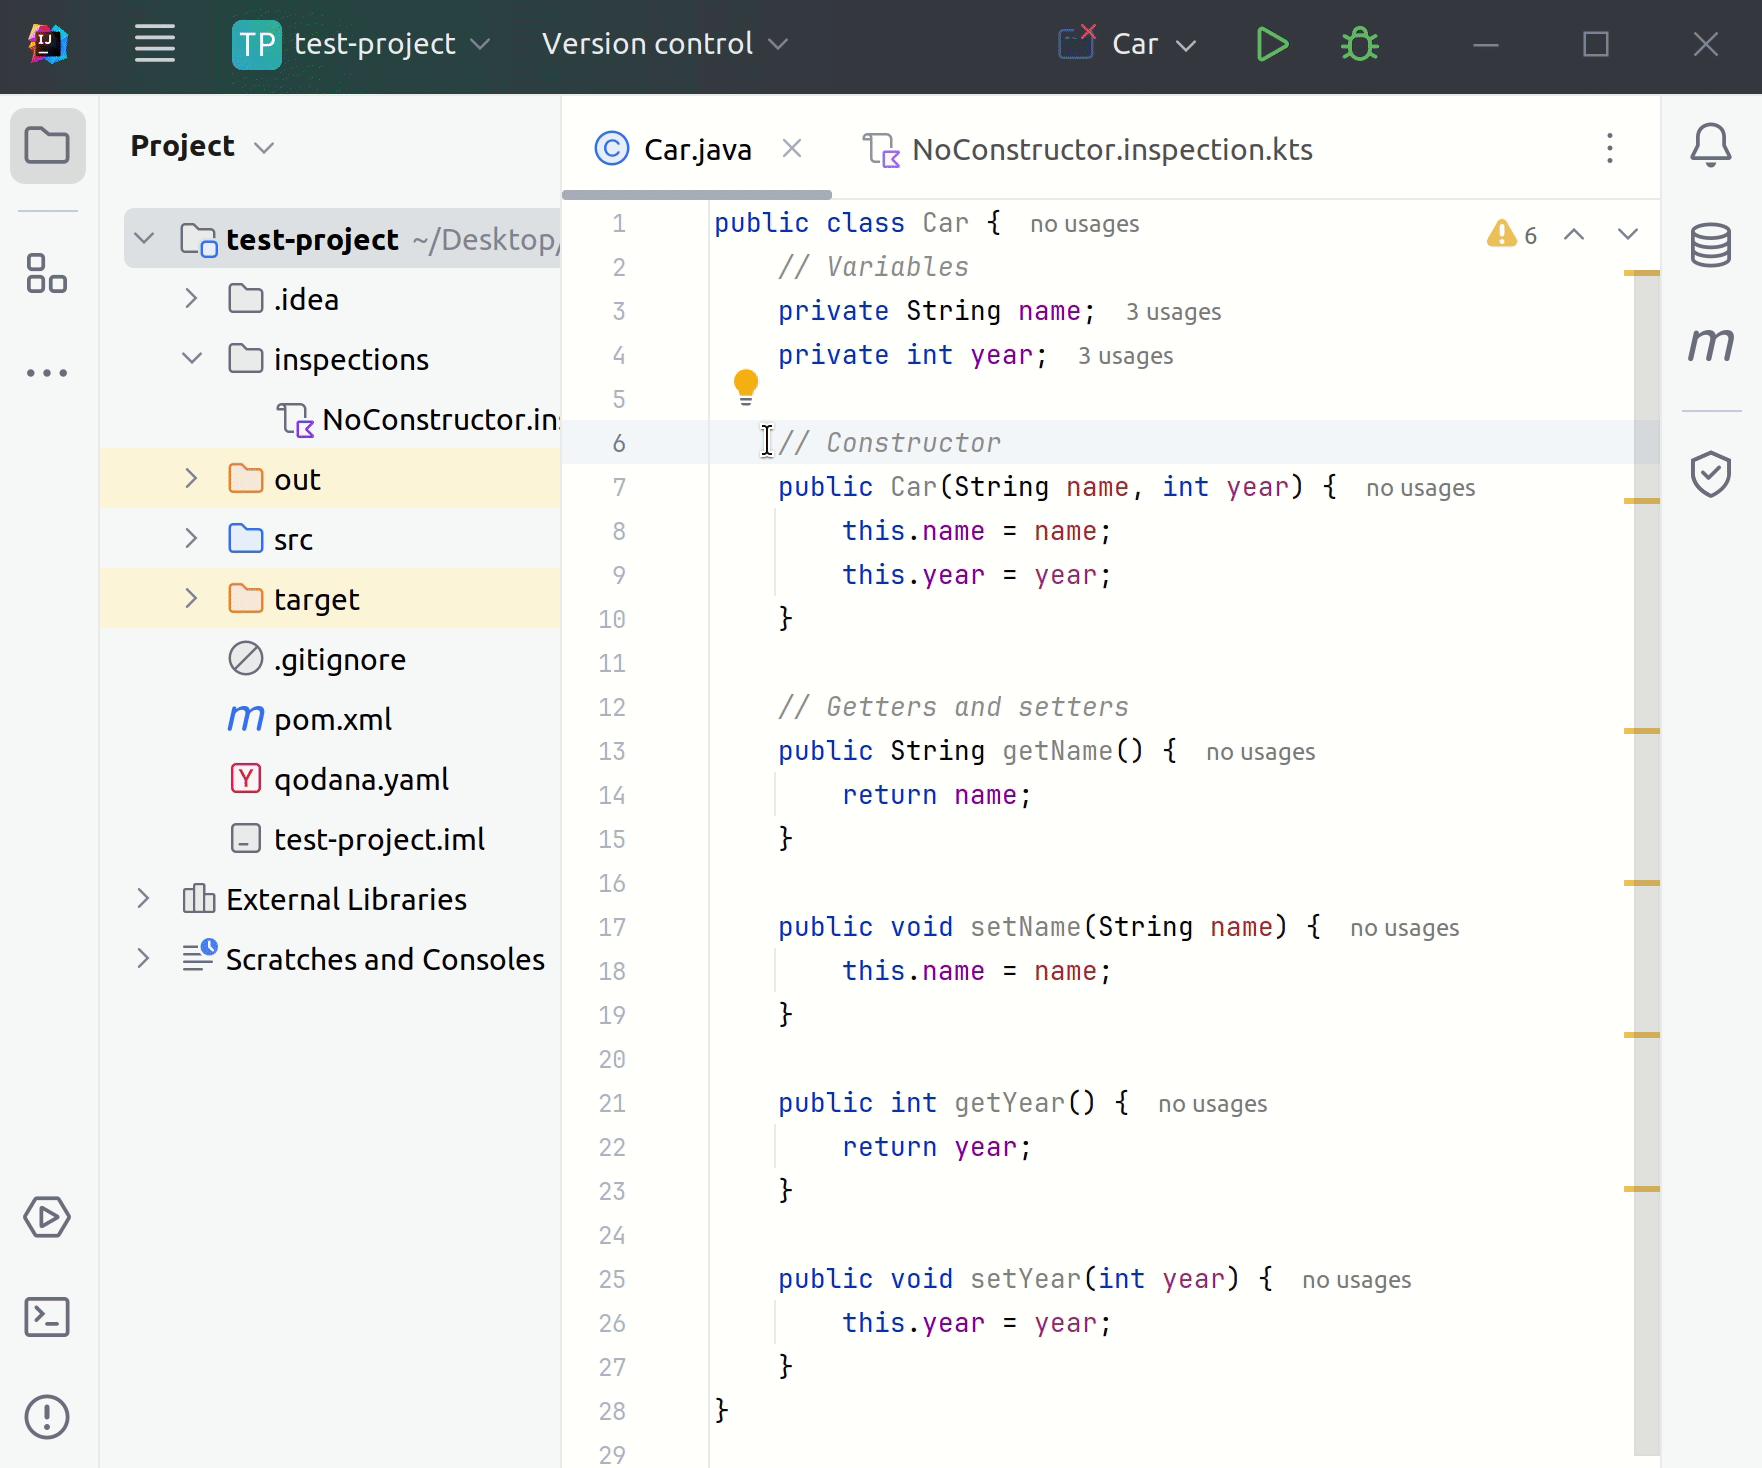
Create an inspection file
To create a new .inspection.kts template file, follow the procedure below.
In your project, create an
inspectionsdirectory.In the project navigator of IntelliJ IDEA, hover over the
inspectionsdirectory, right-click on the directory, and then navigate to .On the resultant dialog, you can choose from among various local and global inspection templates that you can use as a basis for your inspection. Empty local and global templates are universal for any language supported by FlexInspect, while the local Java, Kotlin, JavaScript, and TypeScript templates are language-specific.
Note that each file can contain multiple inspections, and CamelCase is the preferred naming method for
.inspection.ktsfiles.
Here's an animation showing you how to create an inspection following the above method.
The created file already contains code examples and explanations, which you can then use to develop your own inspection.
Review the PSI tree of your code
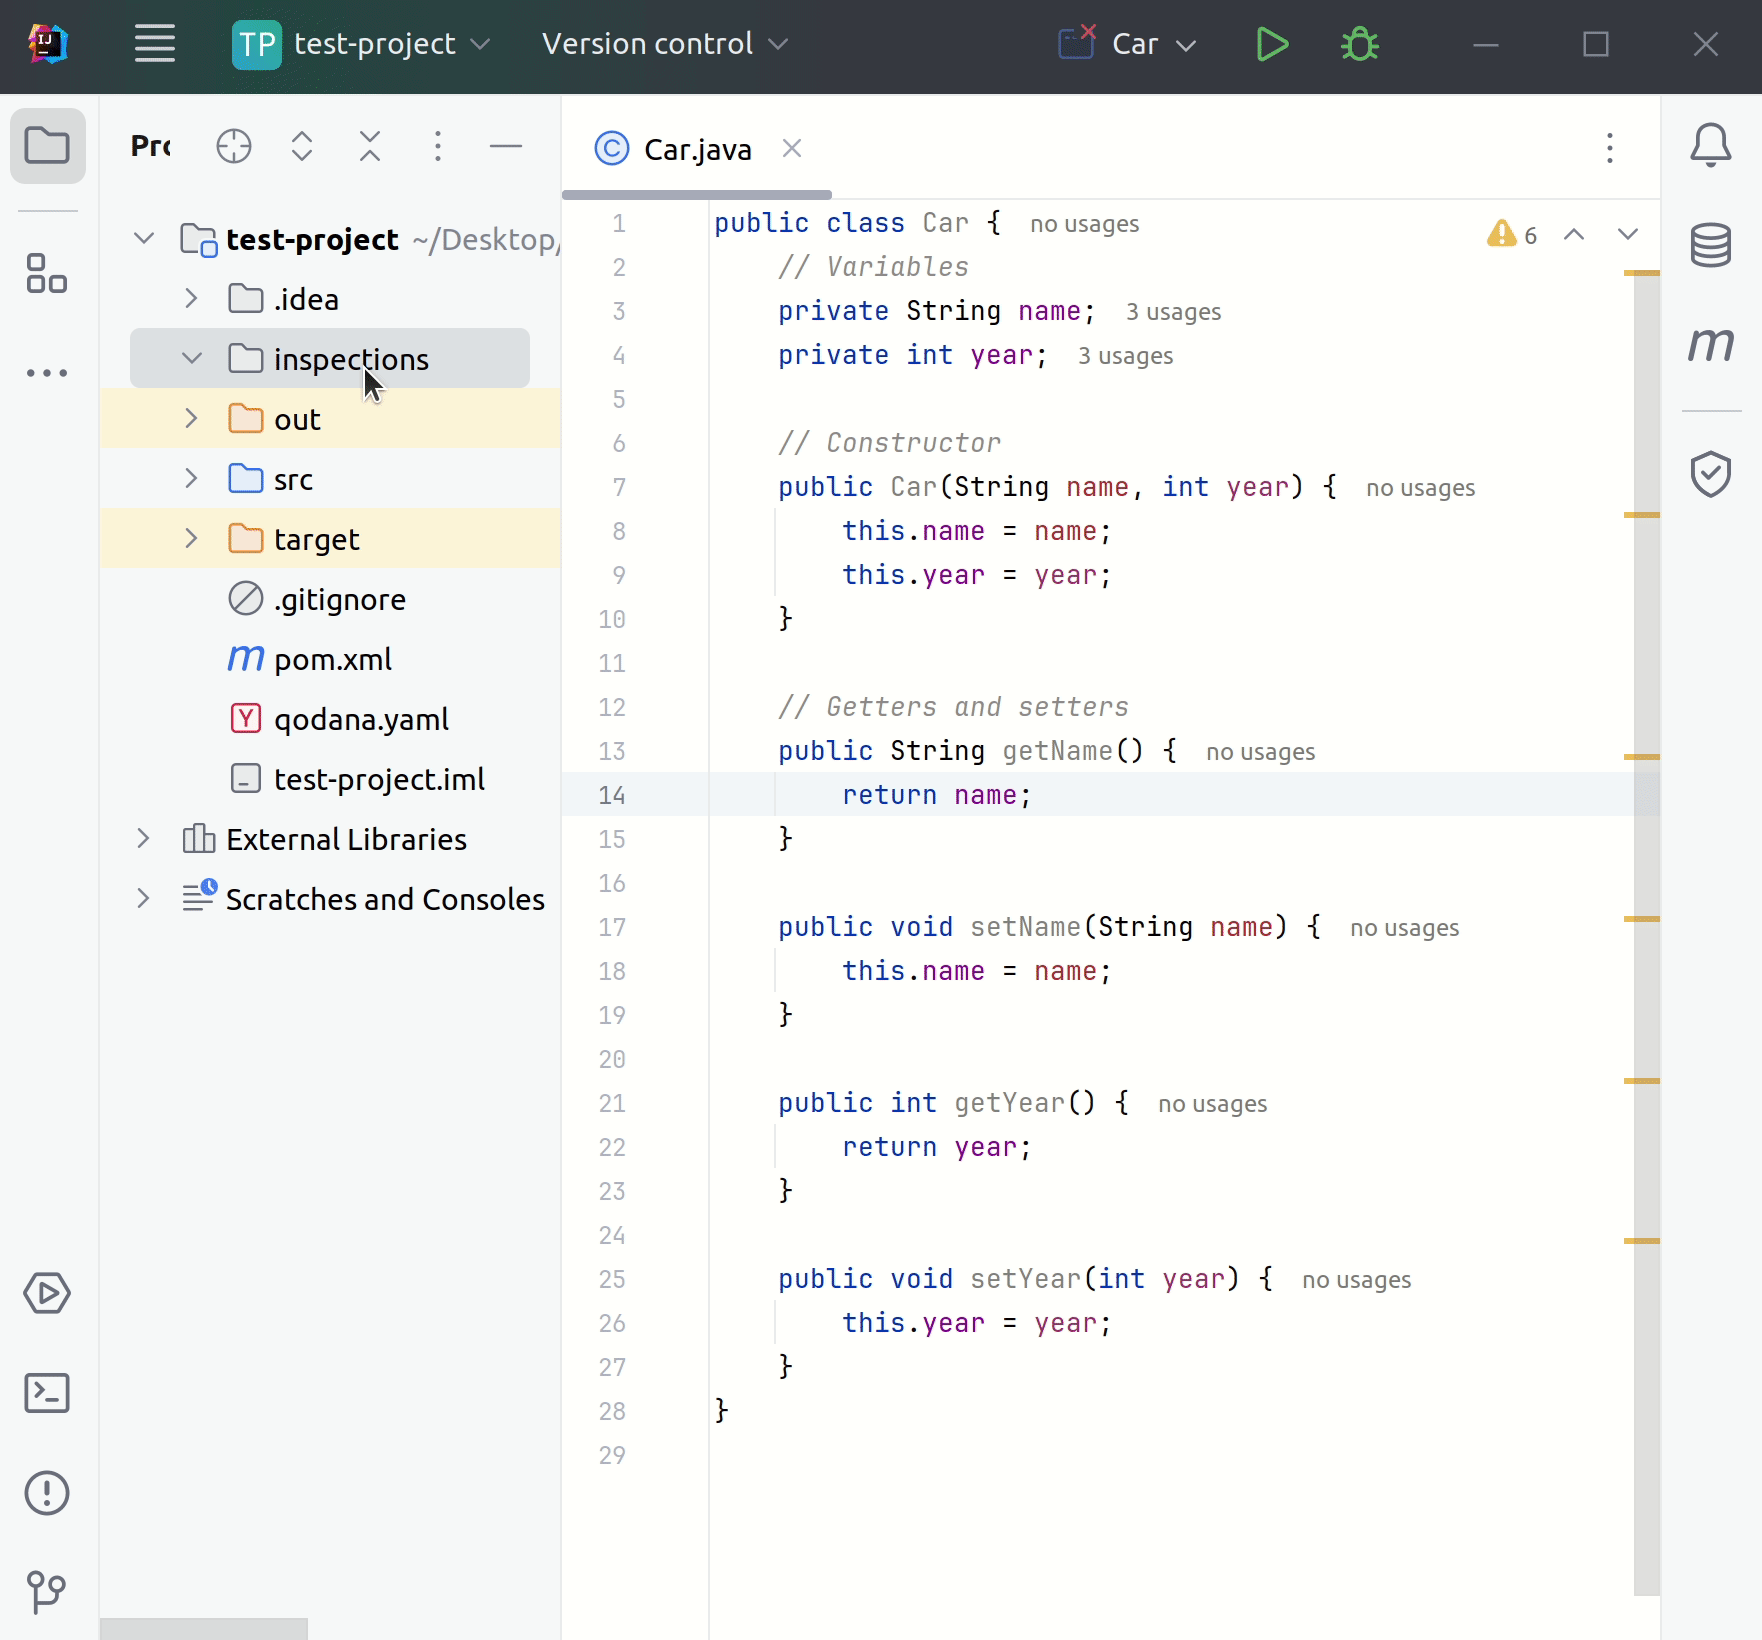
In IntelliJ IDEA, open the file that you would like to analyze using your inspection.
Navigate to . Here, you can explore the PSI tree of your file. APIs are available for PSI nodes contained in the file. These APIs can generate algorithms that would operate within the PSI tree.
For example, to check whether a method is a constructor, you can use the isConstructor() PSI method, which is available for each method of a class.
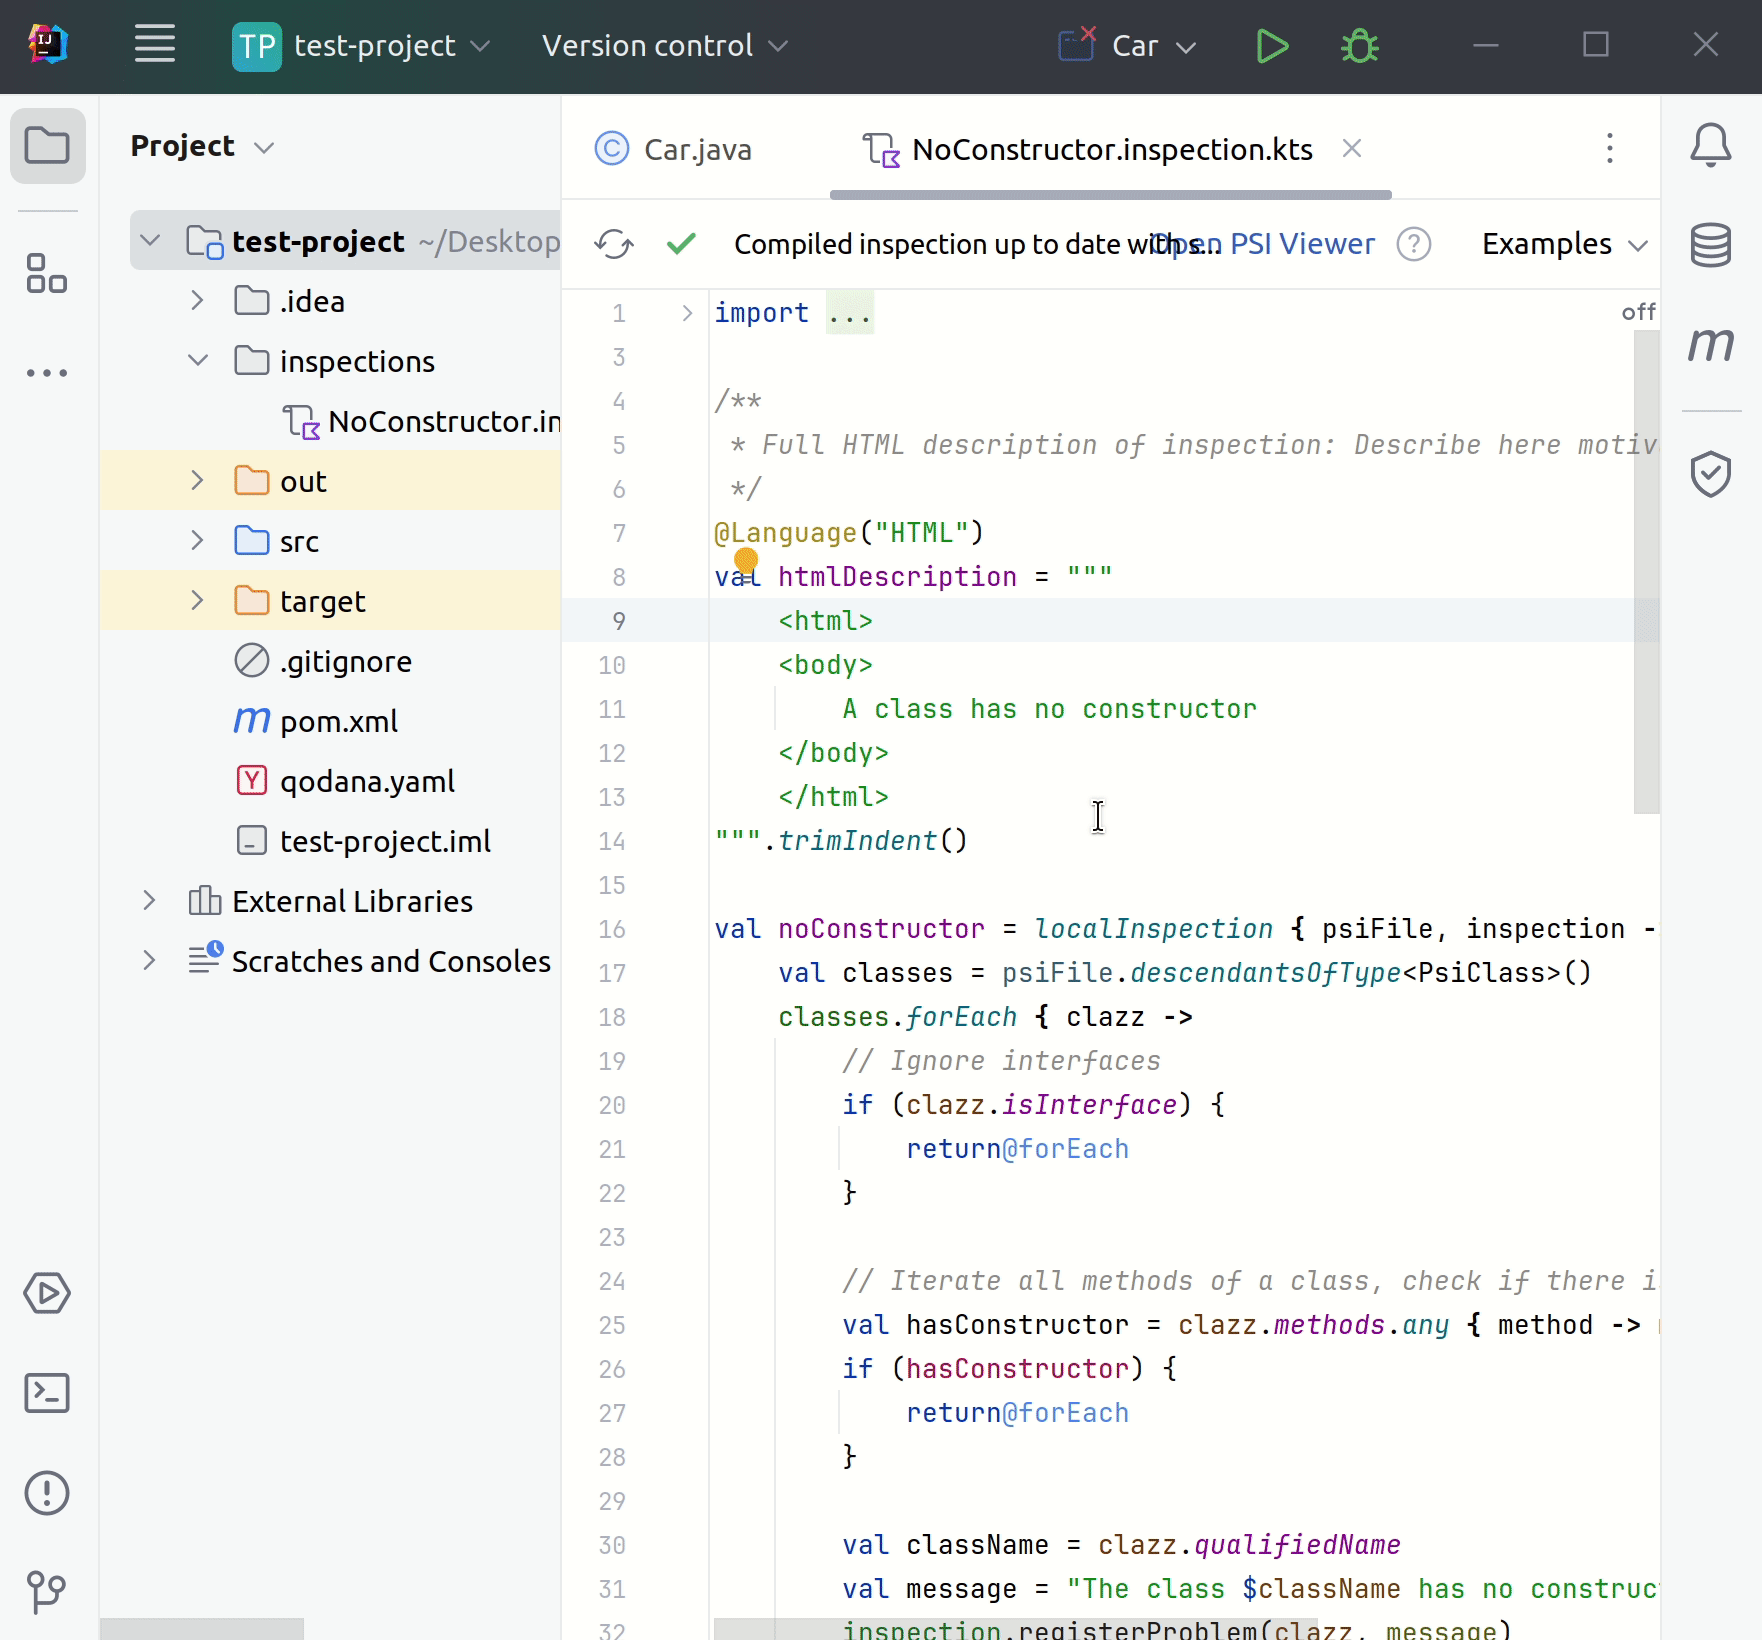
Create your inspection
You can develop your inspection using the template that you've already created. In this example, you can iterate over all methods and use the isConstructor() method to check whether a class has a constructor method. If there is no constructor method, the inspection generates an error showing that a class has no constructor method.
Here's the Kotlin snippet for the NoConstructor.inspection.kts file containing inline comments.
Test your inspection in the IDE
After creating the inspection, you can see the compilation status on the toolbar in the upper part of the inspection file. When you change the inspection code, you need to explicitly recompile the inspection using the recompile button in the left part of the toolbar or use the Alt+Shift+Enter (Windows) or ⌥⇧↩ (macOS) shortcut.
You can also open files using the PSI Viewer and review inspection examples.

You can learn how the new inspection functions on your code by opening a file containing a problem the inspection is supposed to highlight.
Run your custom inspection using Qodana
FlexInspect is supported by the default inspection profiles. In the qodana.yaml file, use the inspection name from the id field of the inspection file to disable or enable your custom inspection.
To analyze your entire project with the new inspection locally, run Qodana as explained in the Run Qodana locally section.
To run your custom inspection in a CI pipeline, you can visit the Overview of CI/CD support section and find the instructions for your specific CI/CD solution. Because your inspection is already contained in the inspections directory of your project, it's already available for inspecting your code.