Running and debugging TypeScript
With WebStorm, you can run and debug both server-side TypeScript code running on Node.js and client-side TypeScript code running in the browser.
Run and debug server-side TypeScript
With WebStorm, you can run and debug server-side TypeScript code without previously compiling it into JavaScript.
Before you start
Make sure you have Node.js 24 or higher on your computer.
Make sure the Node.js and JavaScript Debugger required plugins are enabled on the Settings | Plugins page, tab Installed. For more information, refer to Managing plugins.
Run server-side TypeScript code
You can run server-side TypeScript from the Project tool window (Alt+1) , from the editor, or from the Run widget.
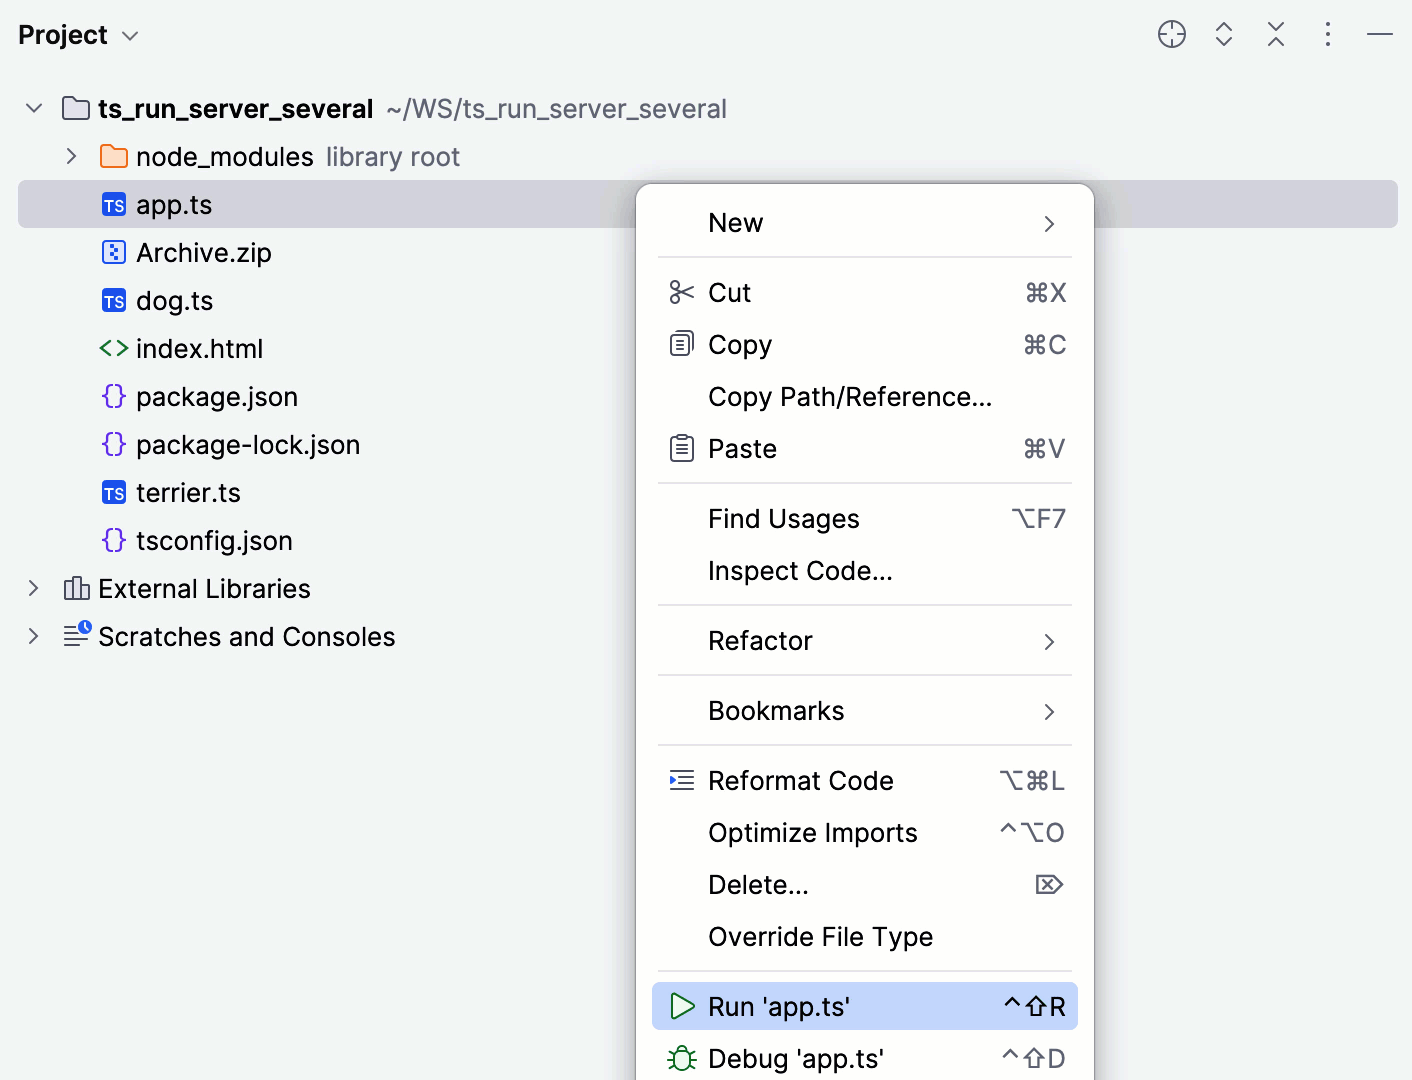
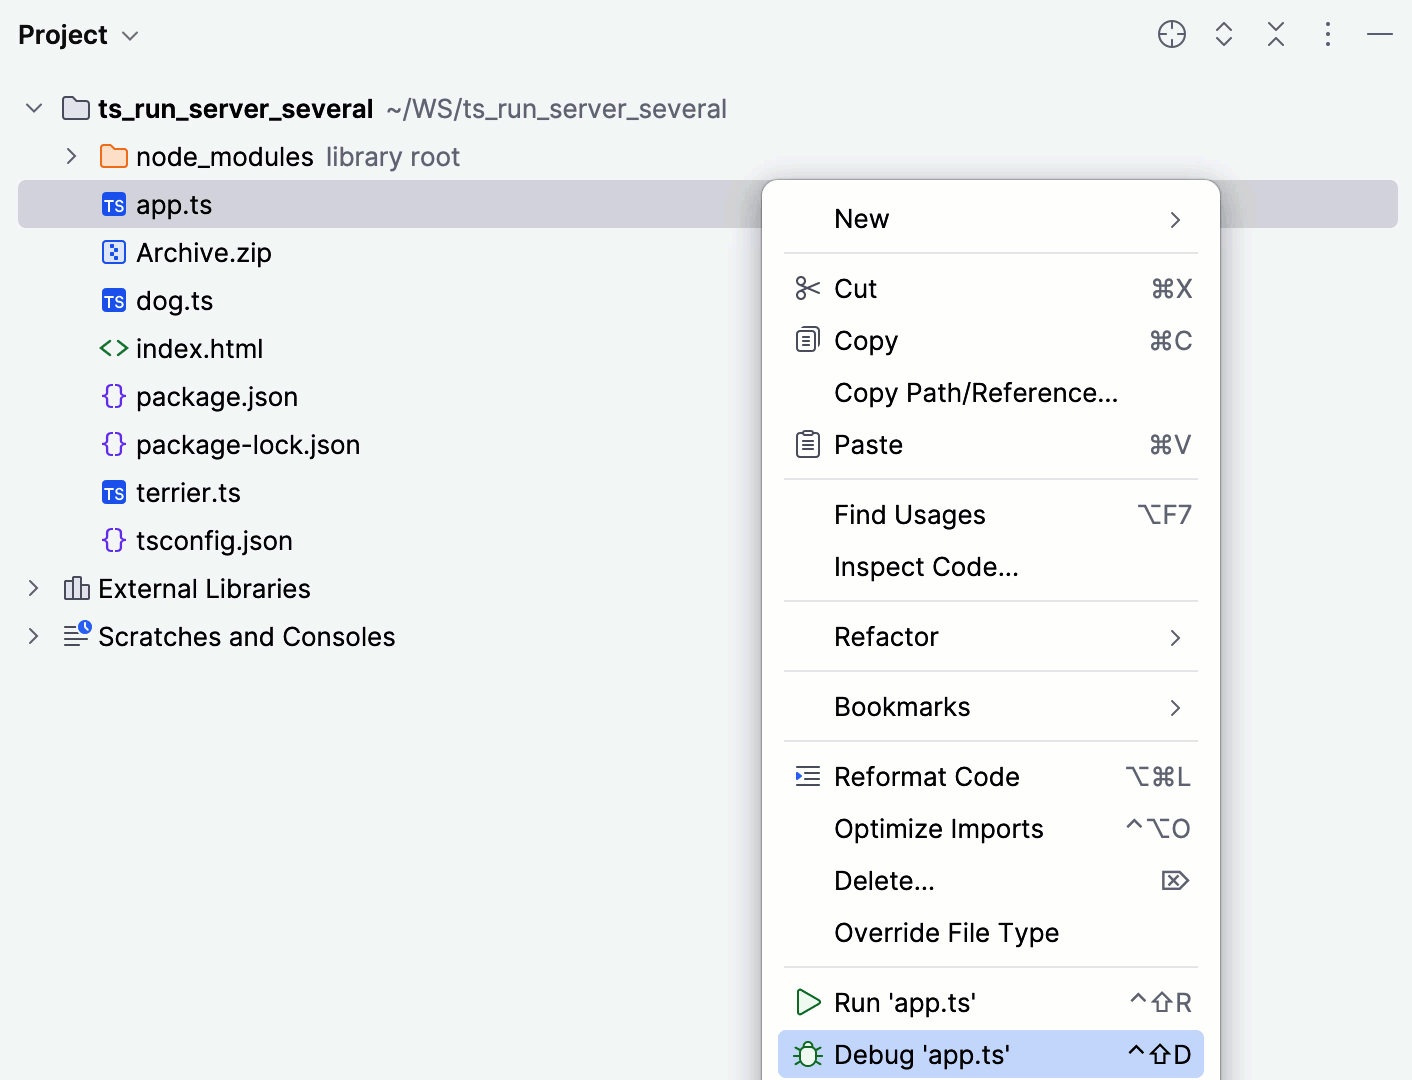
Open the Project tool window (Alt+1) .
Right-click the TypeScript file to run or the starting file of your application.
From the context menu, select .
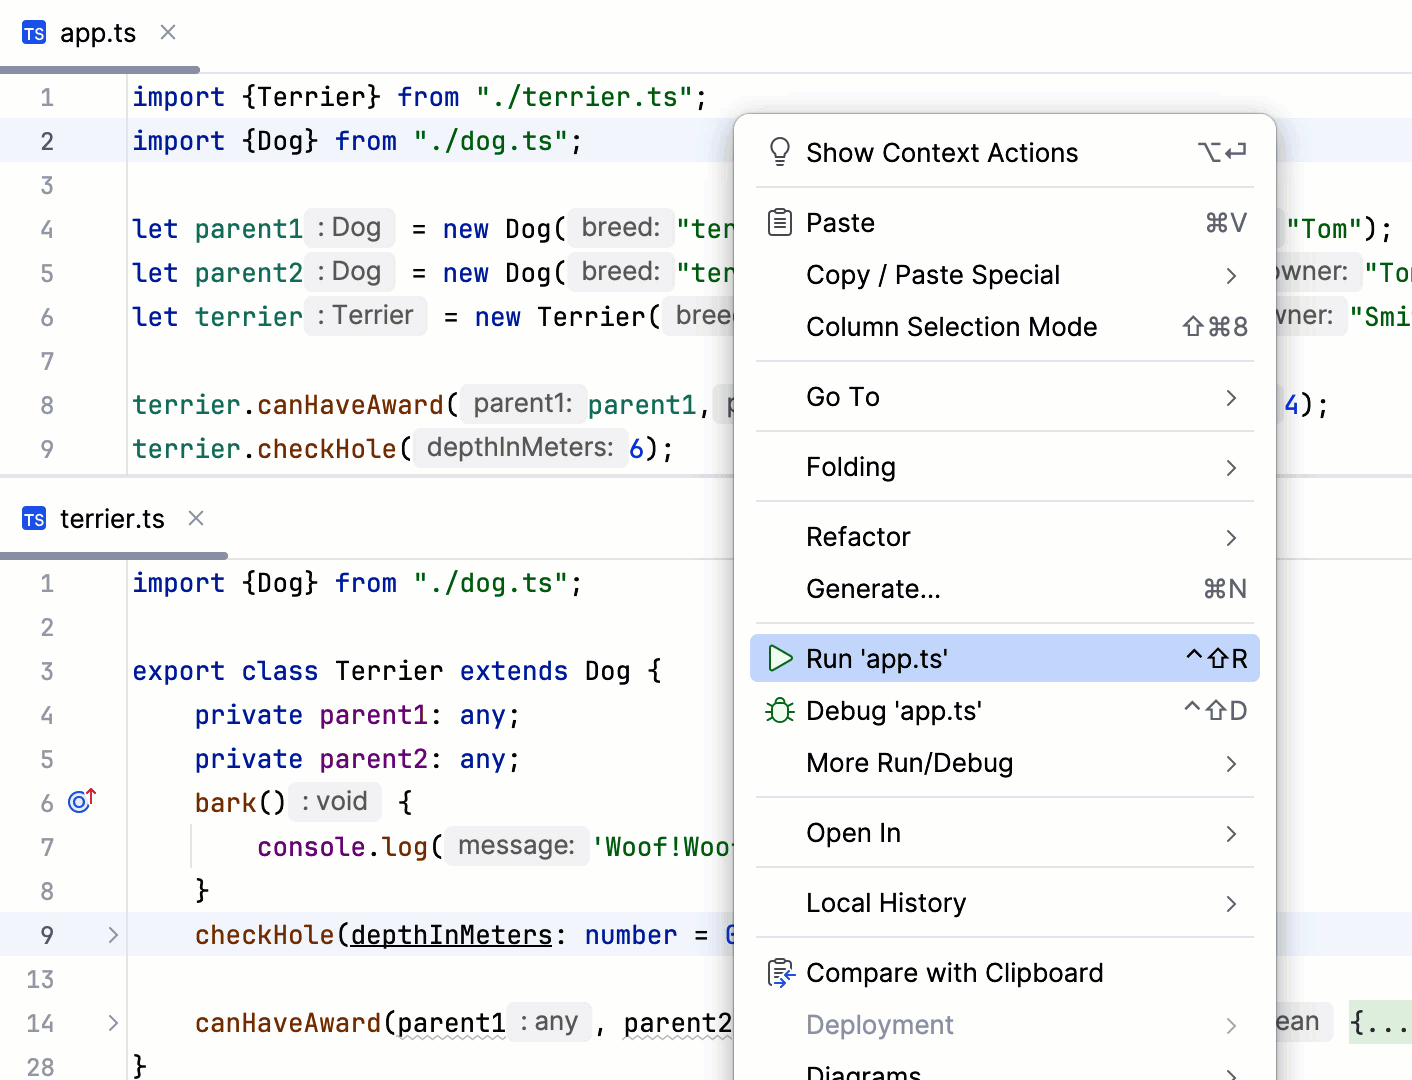
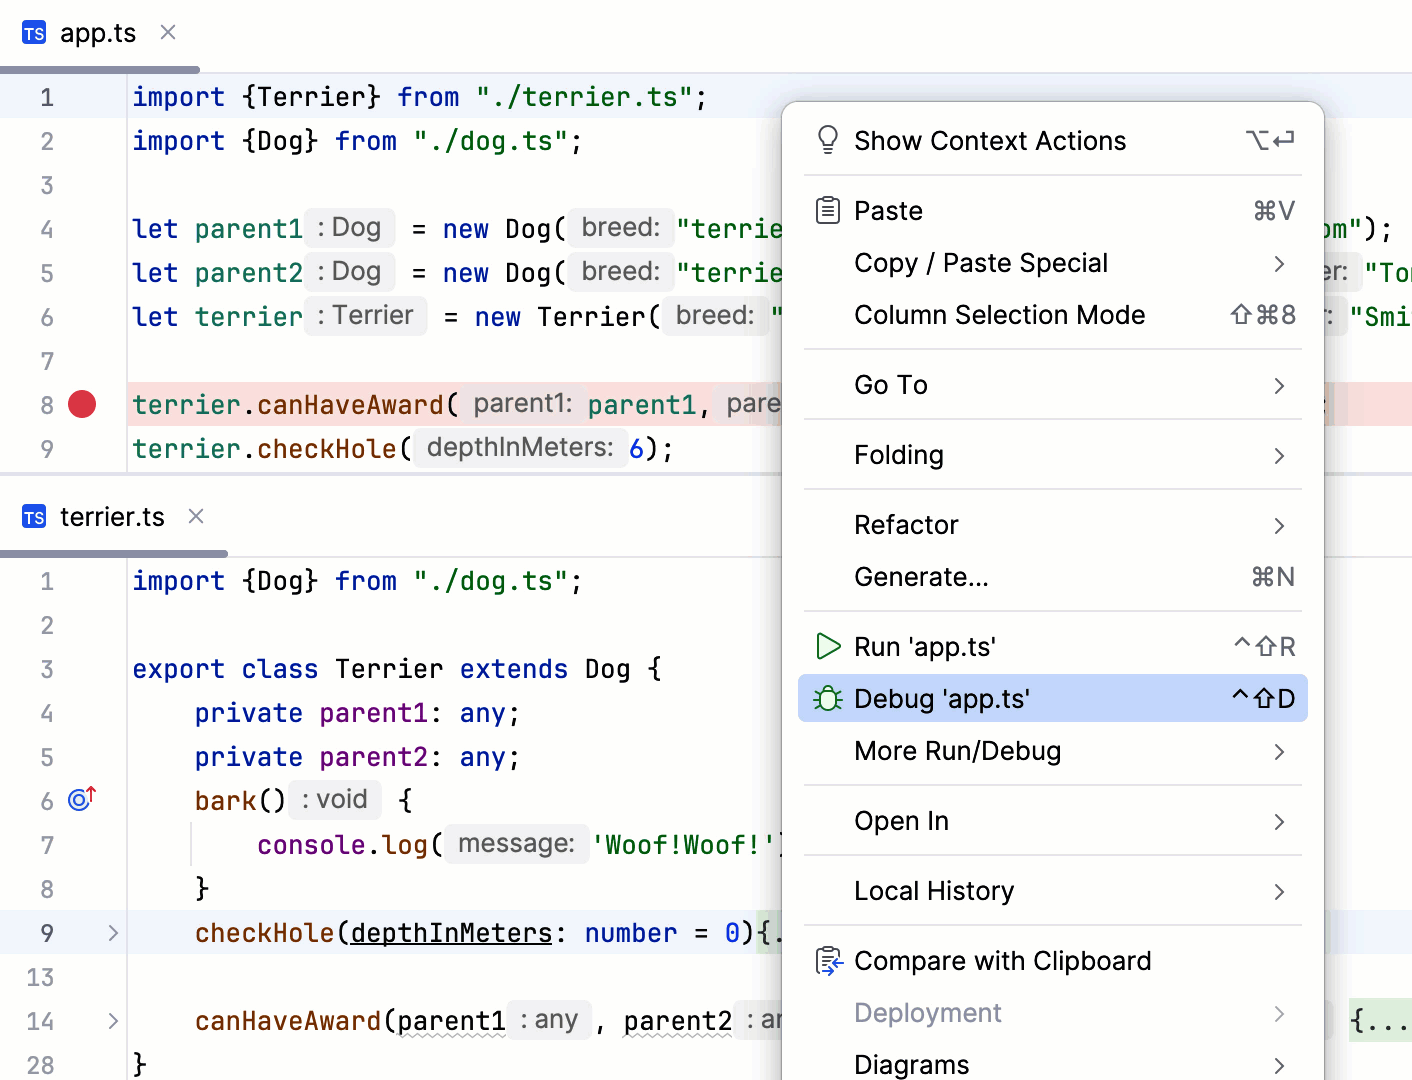
In the editor, open the TypeScript file to run or the starting file of your application
Right-click anywhere in the editor and then select from the context menu.
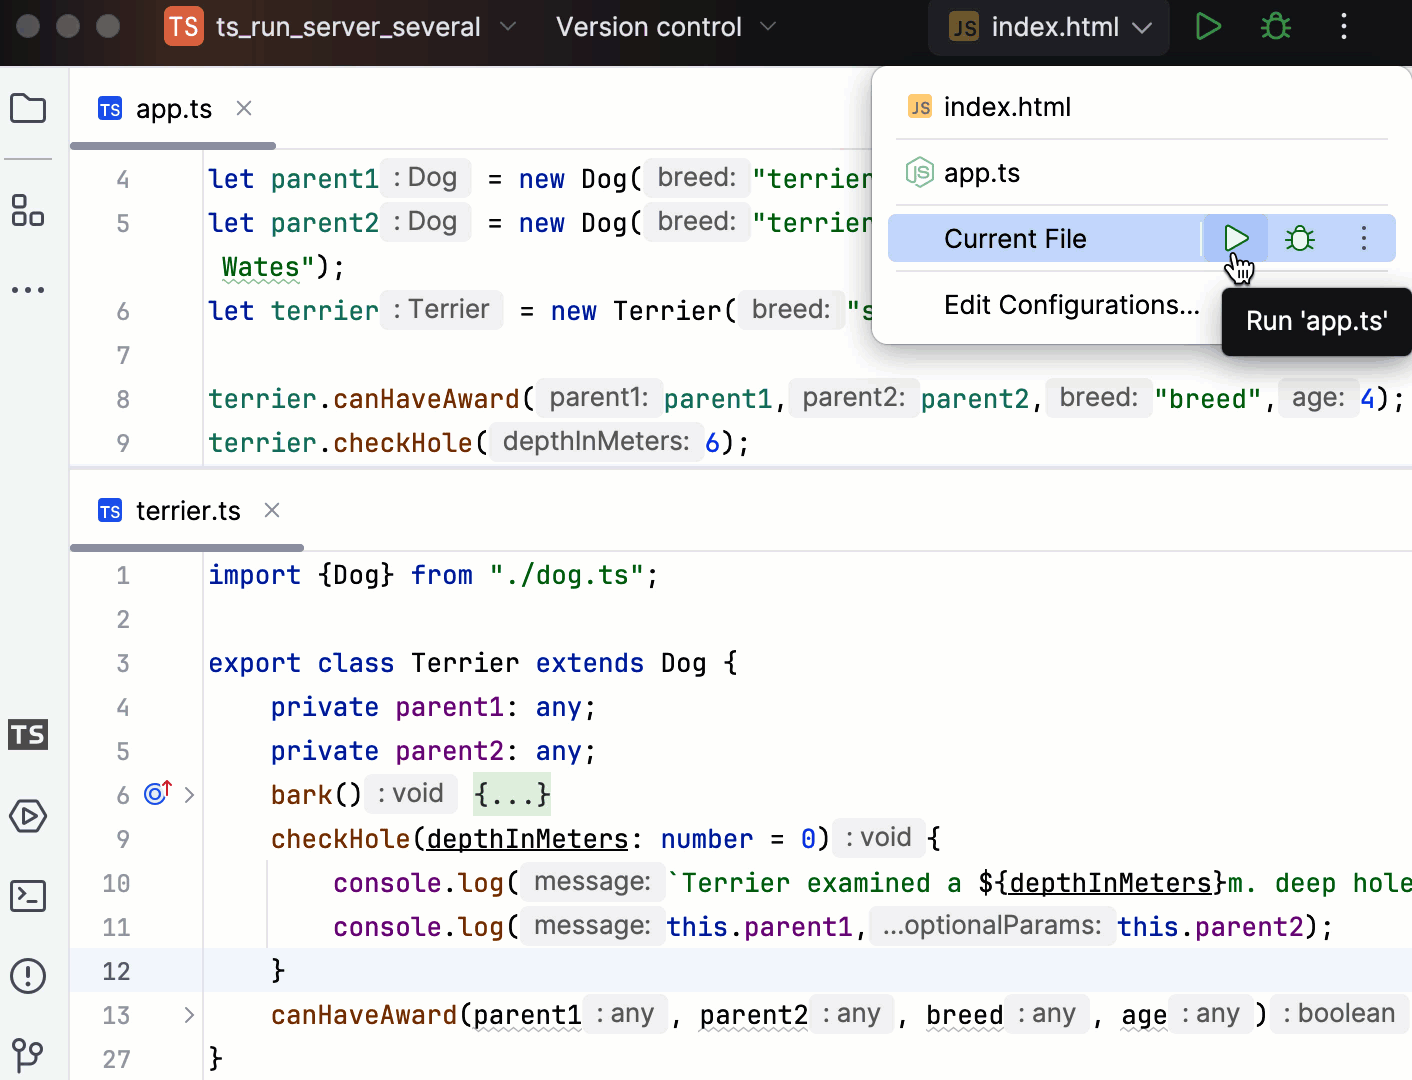
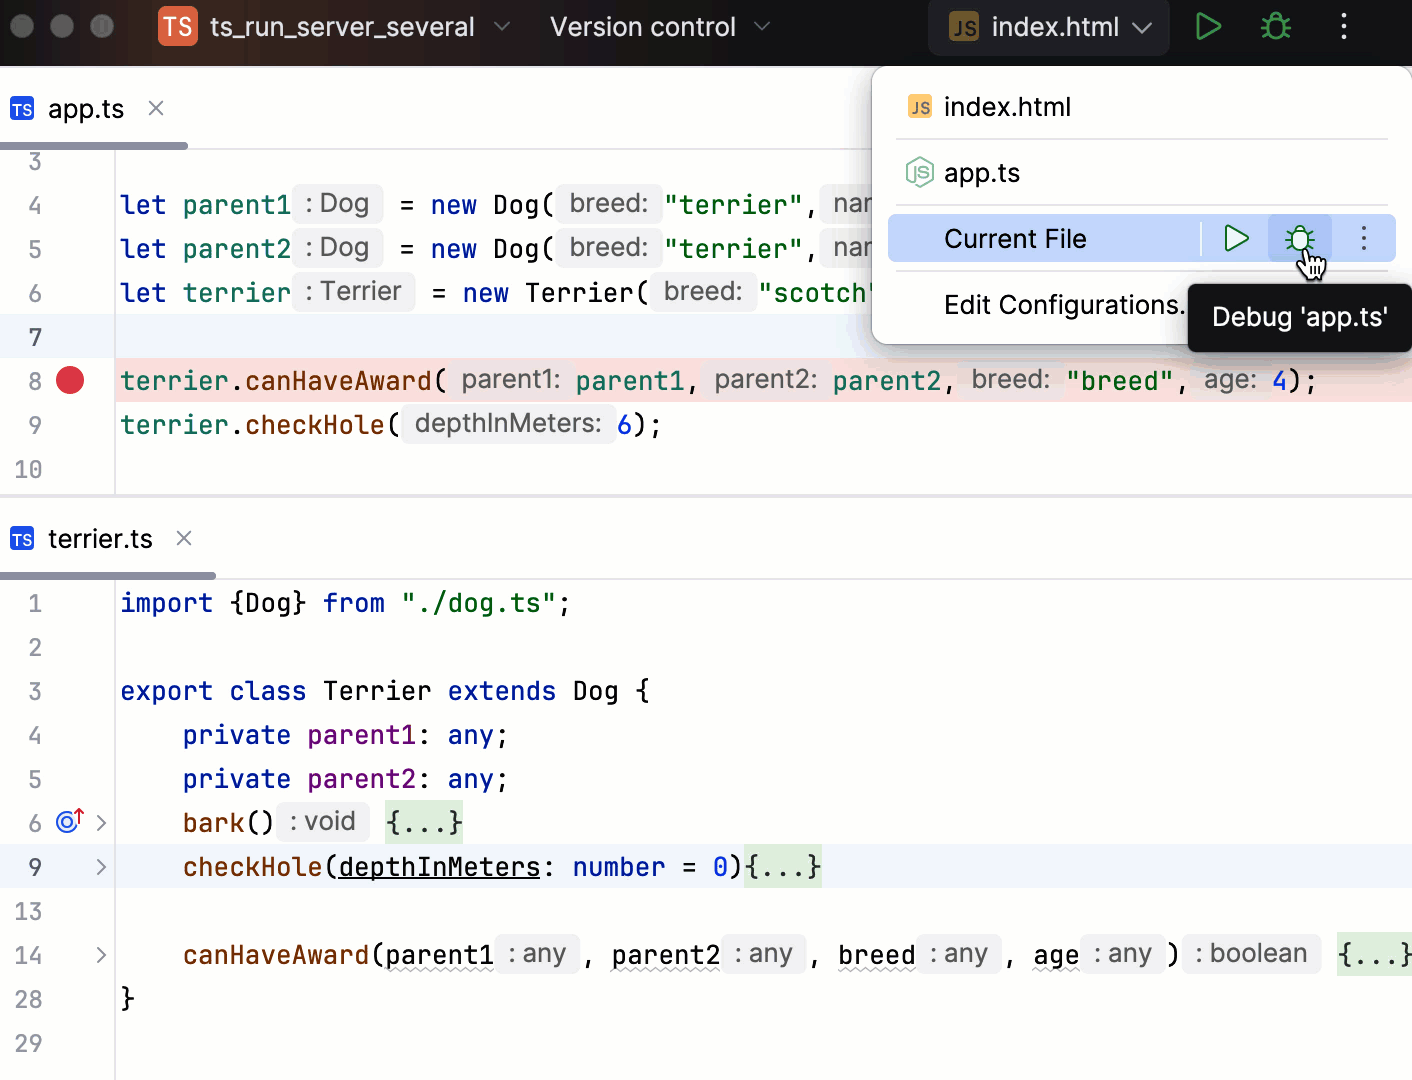
In the editor, open the TypeScript file to run or the starting file of your application
From the Run widget on the toolbar, select Current file and click
 next to it.
Alternatively, from the Run widget select a previously created run/debug configuration and click
next to it.
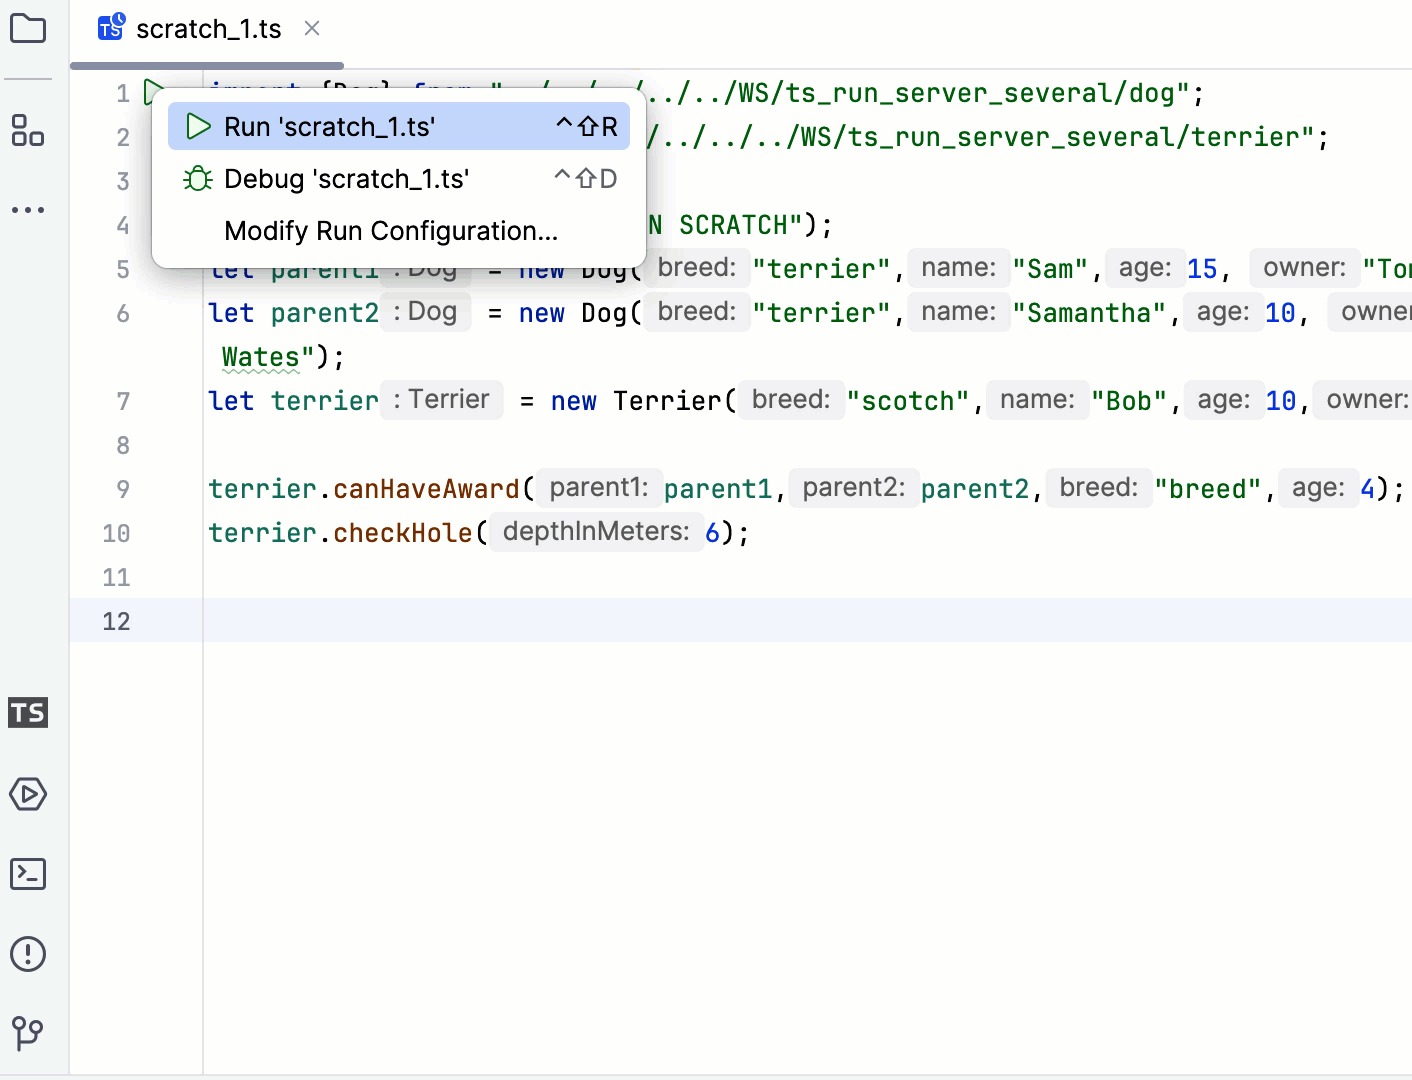
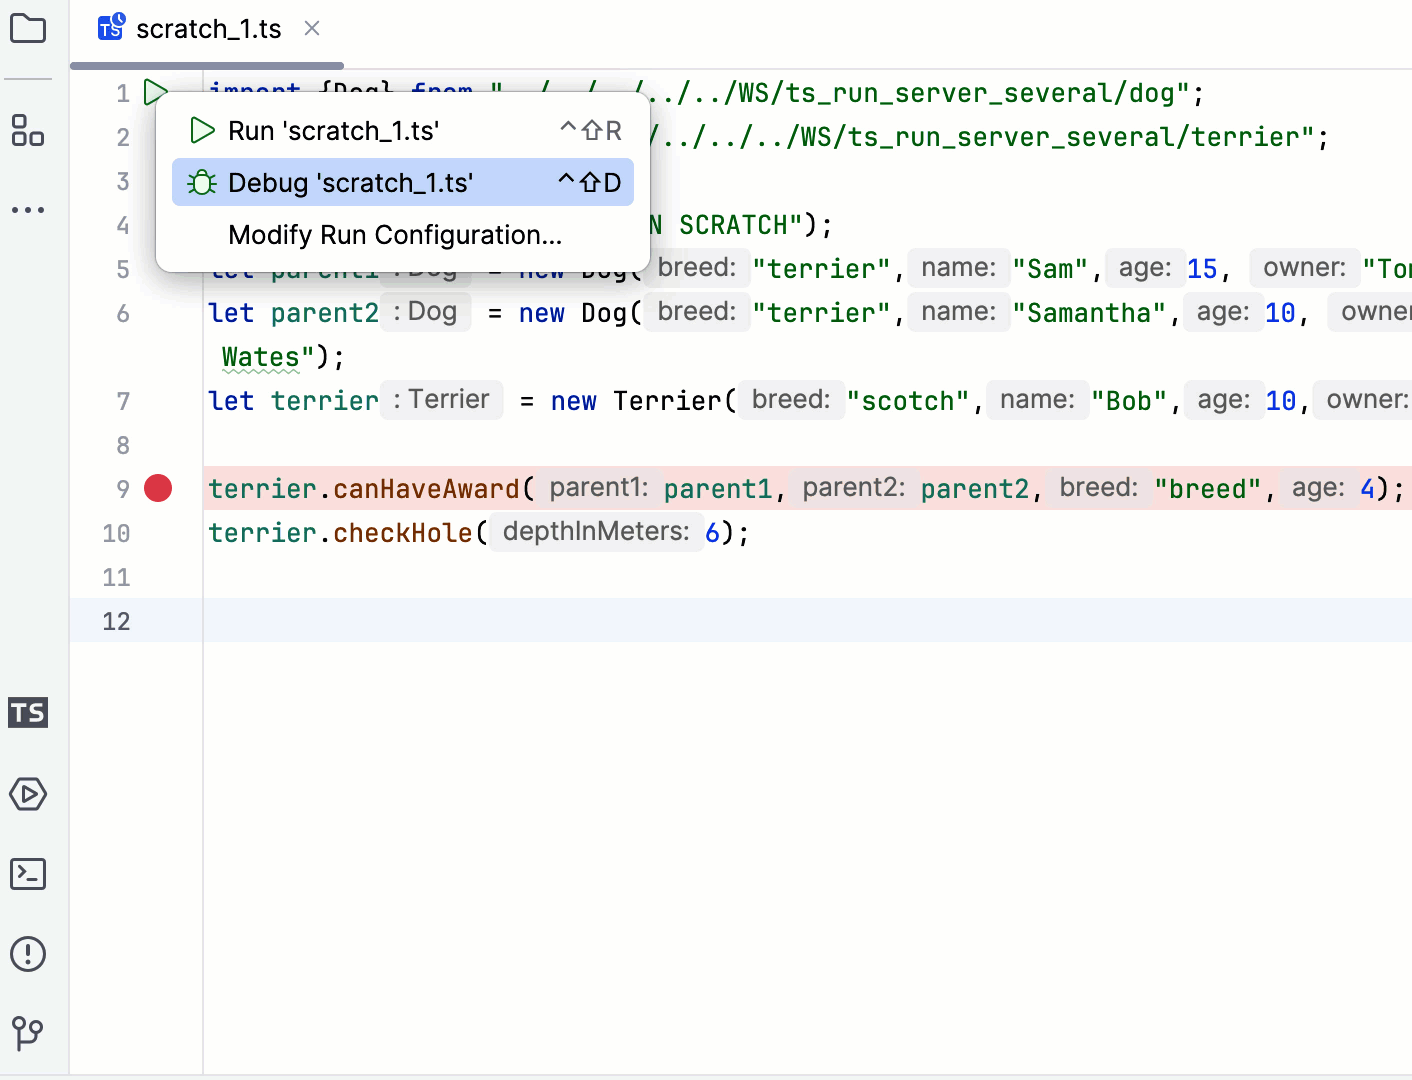
Run TypeScript scratch files
To run a scratch file, besides the above-mentioned methods, you can also click ![]() in the gutter and select the required action from the list.
in the gutter and select the required action from the list.
Auto-generated temporary run/debug configuration
No matter which way to run server-side TypeScript code you might choose, WebStorm creates a temporary run/debug configuration of the type Node.js which you can save, edit, and reuse for running and debugging.

Learn more from Run/debug configurations.
Debug server-side TypeScript code
You can debug server-side TypeScript from the Project tool window (Alt+1) , from the editor, or from the Run widget.
Set the breakpoints where necessary.
Open the Project tool window (Alt+1) .
Right-click the TypeScript file to debug or the starting file of your application.
From the context menu, select .
Set the breakpoints where necessary.
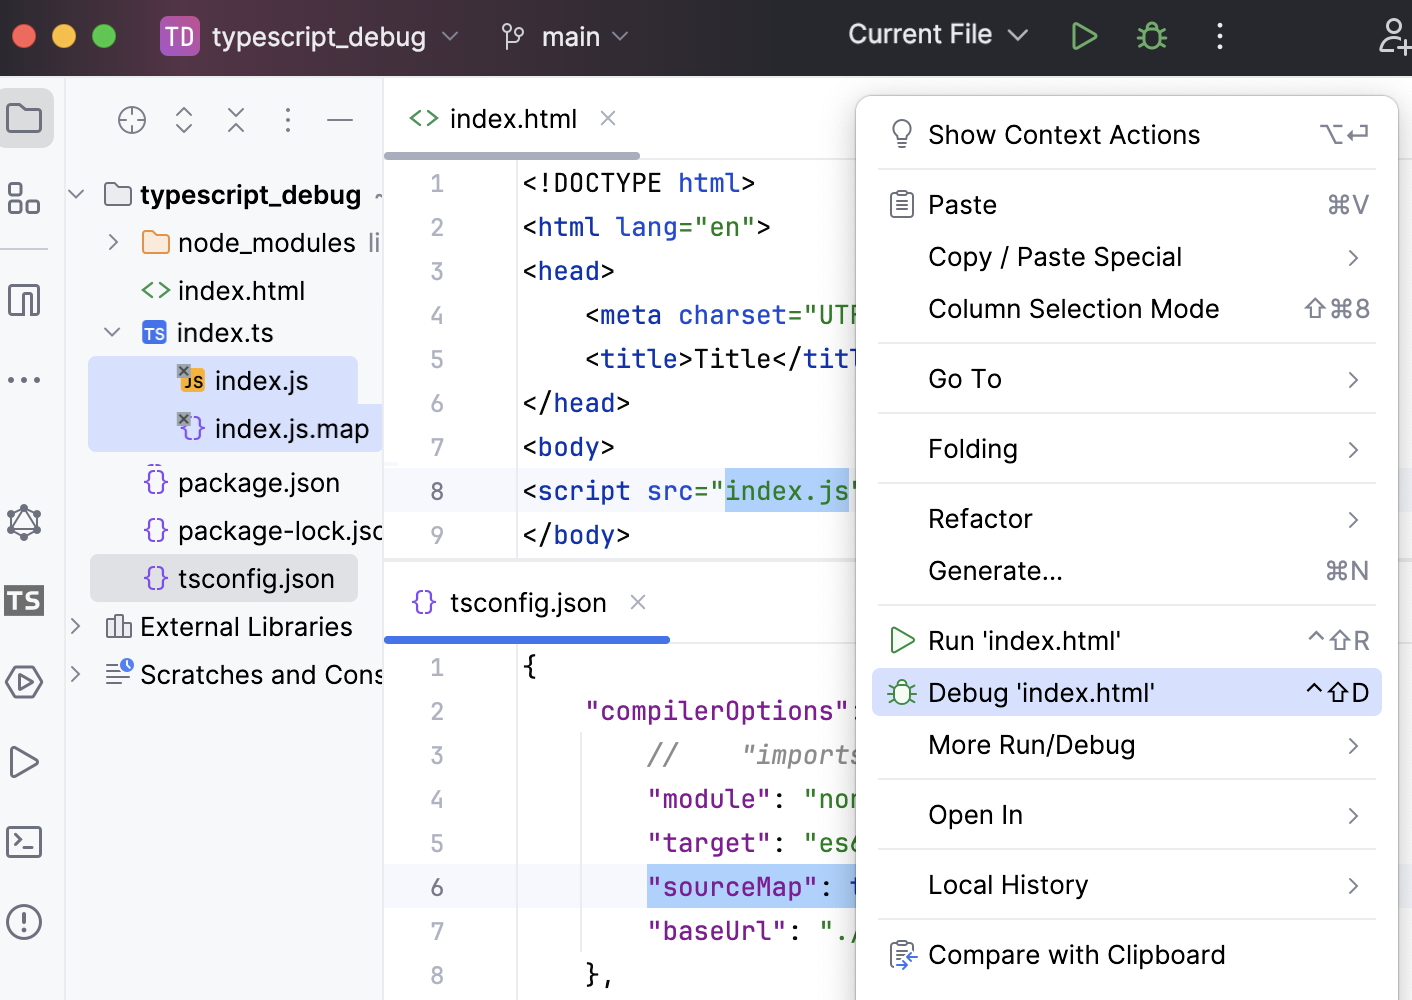
In the editor, open the TypeScript file to debug or the starting file of your application
Right-click anywhere in the editor and then select from the context menu.
Set the breakpoints where necessary.
In the editor, open the TypeScript file to debug or the starting file of your application. Then from the Run widget on the toolbar select Current file and click
 next to it.
Alternatively, from the Run widget select a previously created run/debug configuration and click
next to it.
Debug TypeScript scratch files
To debug a scratch file, besides the above-mentioned methods, you can also click ![]() in the gutter and select the required action from the list.
in the gutter and select the required action from the list.
Use ts-node
If you need to run or debug single TypeScript files with Node.js, you can use ts-node instead of compiling your code as described in Compiling TypeScript into JavaScript.
Install ts-node
In your command-line shell or in the embedded Terminal (Alt+F12) , type:
npm install --save-dev ts-node
Create a custom Node.js run/debug configuration for ts-node
Go to . Alternatively, select Edit Configurations from the Run widget on the toolbar.

In the Edit Configurations dialog that opens, click the Add button (
 ) on the toolbar and select Node.js from the list. The Run/Debug Configuration: Node.js dialog opens.
In the Node Parameters field, add
--require ts-node/register.Specify the Node.js runtime to use.
If you choose the Project alias, WebStorm will automatically use the project default interpreter from the Node runtime field on the JavaScript Runtime page . In most cases, WebStorm detects the project default runtime and fills in the field itself.
You can also choose another configured local or remote interpreter or click
 and configure a new one.
For more information, refer to Configuring remote Node.js runtimes, Configuring a local Node.js runtime, and Using Node.js on Windows Subsystem for Linux.
In the File field, specify the TypeScript file to run or debug. Depending on your workflow, you can do that explicitly or using a macro.
If you are going to always launch the same TypeScript file, click
 and select this file in the dialog that opens. By default, the run/debug configuration gets the name of the selected file.
If you need to launch different files, type
$FilePathRelativeToProjectRoot$. With this macro, WebStorm will always launch the file in the active editor tab.

If necessary, specify any additional parameters for
ts-node(for example,--project tsconfig.json) in the Application parameters field.Save the configuration.
Run server-side TypeScript with ts-node
Depending on the way you specified your TypeScript file in the run/debug configuration, do one of the following:
If you typed the filename explicitly, select the required configuration from the Run widget on the toolbar and click
 next to the list or press Shift+F10.
If you specified a macro, open the TypeScript file to run in the editor, select the newly created configuration from the Run widget on the toolbar, and click
or press Shift+F10.
WebStorm shows the output in the Run tool window.
Debug server-side TypeScript with ts-node
In the TypeScript file to debug, set the breakpoints as necessary.
Depending on the way you specified your TypeScript file in the run/debug configuration, do one of the following:
If you typed the filename explicitly, select the required configuration from the Run widget on the toolbar and click
 or press Shift+F9.
If you specified a macro, open the TypeScript file to debug in the editor, select the newly created configuration from the Run widget and click
or press Shift+F9.
Run and debug client-side TypeScript
Because browsers process only JavaScript, you have to compile your client-side TypeScript code before running or debugging it.
Compilation can also produce source maps that set correspondence between your TypeScript code and the JavaScript code that is actually executed.
Compile TypeScript into JavaScript
You can invoke compilation via a tsc script or configure a build process, for example, with webpack, babel, or another tool. Learn more from webpack with TypeScript and Babel with TypeScript.
Before you start
Press Ctrl+Alt+S to open settings and then select .
Make sure the TypeScript Language Service checkbox is selected.
Create and configure tsconfig.json
By default, the built-in compiler does not create source maps that will let you step through your TypeScript code during a debugging session. The compiler also by default processes either the TypeScript file in the active editor tab or all TypeScript files from the current project.
With a tsconfig.json file, you can modify this default behavior to generate source maps and compile only files from a custom scope.
Create a tsconfig.json file
In the Project tool window (Alt+1) , select the folder where your TypeScript code is (most often it is the project root folder) and then select from the context menu.
To generate source maps during compilation, make sure the
sourceMapproperty is set totrue.Optionally:
To override the default compilation scope, which is the entire project, add the
filesproperty and type the names of the files to process in the following format:"files" : ["<file1.ts>","<file2.ts>"],
Configure the scope for tsconfig.json
You may need to apply different TypeScript configurations to different files in your project.
It is not a problem if you arrange your sources so that all the files in each folder should be processed according to the same configuration. In such case you only have to create a separate tsconfig.json for each folder.
However, if you want to apply different rules to the files that are stored in the same folder, you need to create several configuration files and configure scopes for them.
Create as many tsconfig*.json configuration files as you need.
Open the Settings dialog (Ctrl+Alt+S) , go to , and make sure the names of all these files match the patterns from the Typescript config file name pattern list.
If necessary, add patterns as described in Add file type associations.

In each *tsconfig*.json, specify the files to be processed according to its settings:
List the file names explicitly in the
filesfield:"files" : ["<file1.ts>","<file2.ts>"],Learn more from TSConfig Reference: Files.
In the
includefield, specify the file names or patterns:"include" : ["<pattern1>, <pattern2>"]Learn more from TSConfig Reference: Include.
To skip some files whose names match the patterns listed in the
includefield, list their names or patterns in theexcludefield:"exclude" : ["<pattern3>, <pattern4>"]Learn more from TSConfig Reference: Exclude.
Compile TypeScript code
You can invoke compilation via a tsc script or configure a build process, for example, with webpack, babel, or another tool. Learn more from webpack with TypeScript and Babel with TypeScript.
Compile TypeScript with a tsc script
In your package.json file, add the following line to the
scriptssection:tsc- to compile all files in the scope that is defined in tsconfig.json.tsc <path to a file>- to compile a specific file.tsc <glob pattern>- to compile all files that meet the pattern, for example,tsc production/src/*.ts.
Learn more from the TypeScript official website.
Click
 in the gutter next to the script and select Run '<script name>'.
Compilation errors are reported in the Run tool window.
Automatic compilation on changes
Open the Languages & Frameworks | TypeScript settings page Ctrl+Alt+S and select the Recompile on changes checkbox.
Run a client-side TypeScript application
Because browsers process only JavaScript, you have to compile your client-side TypeScript code before running it.
Run client-side TypeScript
In the editor, open the HTML file with a reference to the generated JavaScript file. This HTML file does not necessarily have to be the one that implements the starting page of the application.
Do one of the following:
Choose from the main menu or press Alt+F2. Then select the desired browser from the list.
Hover over the code to show the browser icons bar:


 . Click the icon that indicates the desired browser.
Debug client-side TypeScript
Because browsers process only JavaScript, you have to compile your client-side TypeScript code before debugging it.
During compilation, there can also be generated source maps that set correspondence between your TypeScript code and the JavaScript code that is actually executed. As a result, you can set breakpoints in your TypeScript code, launch the application, and then step through your original TypeScript code, thanks to generated sourcemaps.
If your application is running on the built-in WebStorm server, refer to Running a client-side TypeScript application above, you can also debug it in the same way as JavaScript running on the built-in server.
Debug a TypeScript application running on an external web server
Most often, you may want to debug a client-side application running on an external development web server, for example, powered by Node.js.
Configure the built-in debugger as described in Configuring JavaScript debugger.
To enable source maps generation, open your tsconfig.json and set the
sourceMapproperty totrue, as described in Create a tsconfig.json file.Configure and set breakpoints in the TypeScript code.
Run the application in the development mode. Often you need to run
npm startfor that.Most often, at this stage TypeScript is compiled into JavaScript and source maps are generated. For more information, refer to Compile TypeScript into JavaScript.
When the development server is ready, copy the URL address at which the application is running in the browser - you will need to specify this URL address in the run/debug configuration.
Go to . Alternatively, select Edit Configurations from the Run widget on the toolbar.
In the Edit Configurations dialog that opens, click the Add button (
) on the toolbar and select JavaScript Debug from the list. In the Run/Debug Configuration: JavaScript Debug dialog that opens, specify the URL address at which the application is running. This URL can be copied from the address bar of your browser as described in Step 3 above. 
From the Run widget list on the toolbar, select the newly created configuration and click
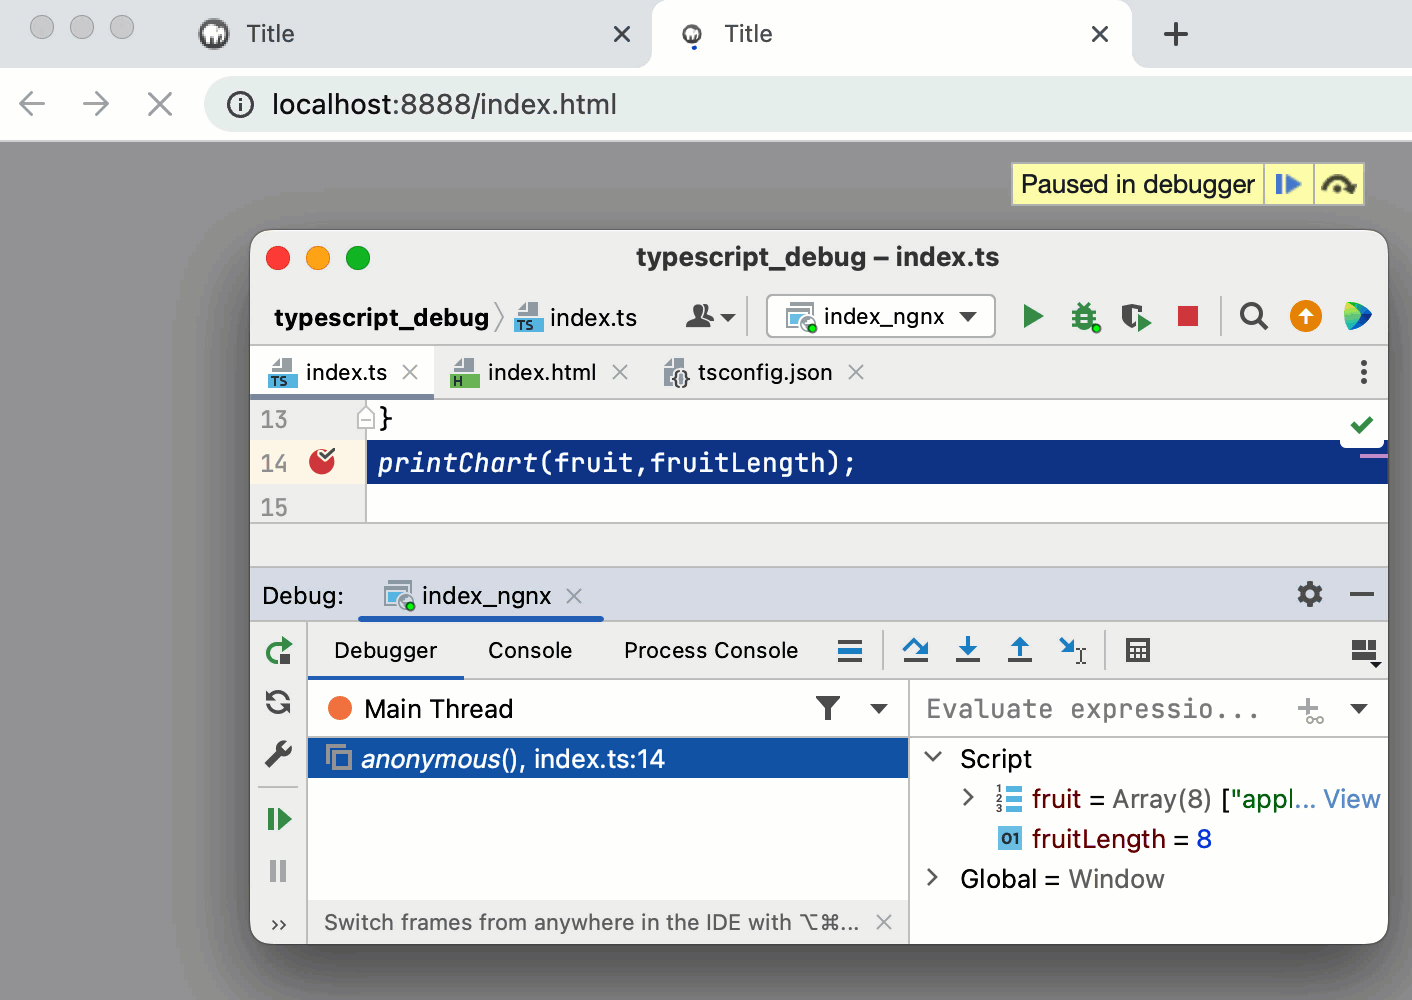
next to it. The URL address specified in the run configuration opens in the browser and the Debug tool window appears.You may need to refresh the page in the browser to get the controls in the Debug tool window available.
In the Debug tool window, proceed as usual: step through the program, stop and resume program execution, examine it when suspended, explore the call stack and variables, set watches, evaluate variables, view actual HTML DOM, and so on.
To ignore source maps and step through the actually executed code, press
 on the toolbar of the Debug tool window. Learn more from Disable source maps.