Qodana / Static Code Analysis Guide
The ultimate guide to static code analysis for your team.
Welcome to our exploration of static code analysis, where we’ll explain exactly what it is and how it can help you improve the quality of your code. You’ll learn why it’s useful and how it can make your code cleaner, safer, and easier to maintain. We’ll also compare it to dynamic code analysis, discuss its strengths and limitations, and share best practices for choosing the ideal static code analysis tool for you.
Static code analysis is a method of examining your source code without executing it and running the program. With this approach, automated tools scan your code for potential issues, such as bugs, security vulnerabilities, or deviations from coding standards.
Static code analysis aims to help you catch problems early, maintain stylistic consistency, and improve the quality of your code. For example, if you forget to close a file or misname a new variable, a static analysis tool will flag these issues before they cause any problems.
But static analysis is not just about finding bugs. It’s about building your codebase with intention and creating a strong foundation for scalable code infrastructure as your product or organization grows. It also plays a key role in identifying security vulnerabilities, ensuring regulatory compliance, and flagging mismatched licenses, making it essential for both code quality and legal peace of mind.
Static code analysis enables you to examine your source code for issues before executing or merging to the main branch.
Static and dynamic code analysis are like two sides of the same coin. Both aim to improve code quality, but they do it in different ways.

When it runs
Before the code is executed
Focus
Finding maintainability issues, security flaws, and code smells without running the program
Output
Warnings and reports about potential flaws or risky patterns
Performance overhead
None for system performance, since it doesn’t execute the code and is only used in the development process
However, there can be larger developmental overheads to consider if you’re analyzing a larger codebase.
Use cases
Detecting coding-standard violations, many security vulnerabilities, and maintainability issues
When it runs
While the code is being executed.
Focus
Identifying runtime issues such as performance bottlenecks, memory leaks, and logic flaws
Output
The program’s actual runtime behavior with logs, traces, and performance metrics
Performance overhead
High system performance overhead, as it runs alongside or within the application in a real or simulated environment.
Use cases
Catching problems that only surface with real input and environment conditions
Static code analysis, which Qodana helps automate for teams in their CI/CD pipeline, is valuable throughout the entire development lifecycle. While it is particularly beneficial during the early stages of development – when catching errors and security gaps costs the least in terms of time, money, and resources – it also plays an integral role in maintaining larger codebases that can have hundreds of commits a day.
By integrating static analysis directly into your CI/CD pipeline, your team can ensure every commit is automatically vetted for coding-standard errors. This helps you maintain code quality at scale and prevent regressions.

Dynamic code analysis, on the other hand, evaluates how your code behaves in real-world scenarios or controlled test environments.
It comes into play once the application is runnable and needs testing under real conditions.
This helps you and your team spot concurrency pitfalls, memory leaks, performance bottlenecks, and security flaws that only become apparent when the code runs.

As an example, suppose you are developing a web application.
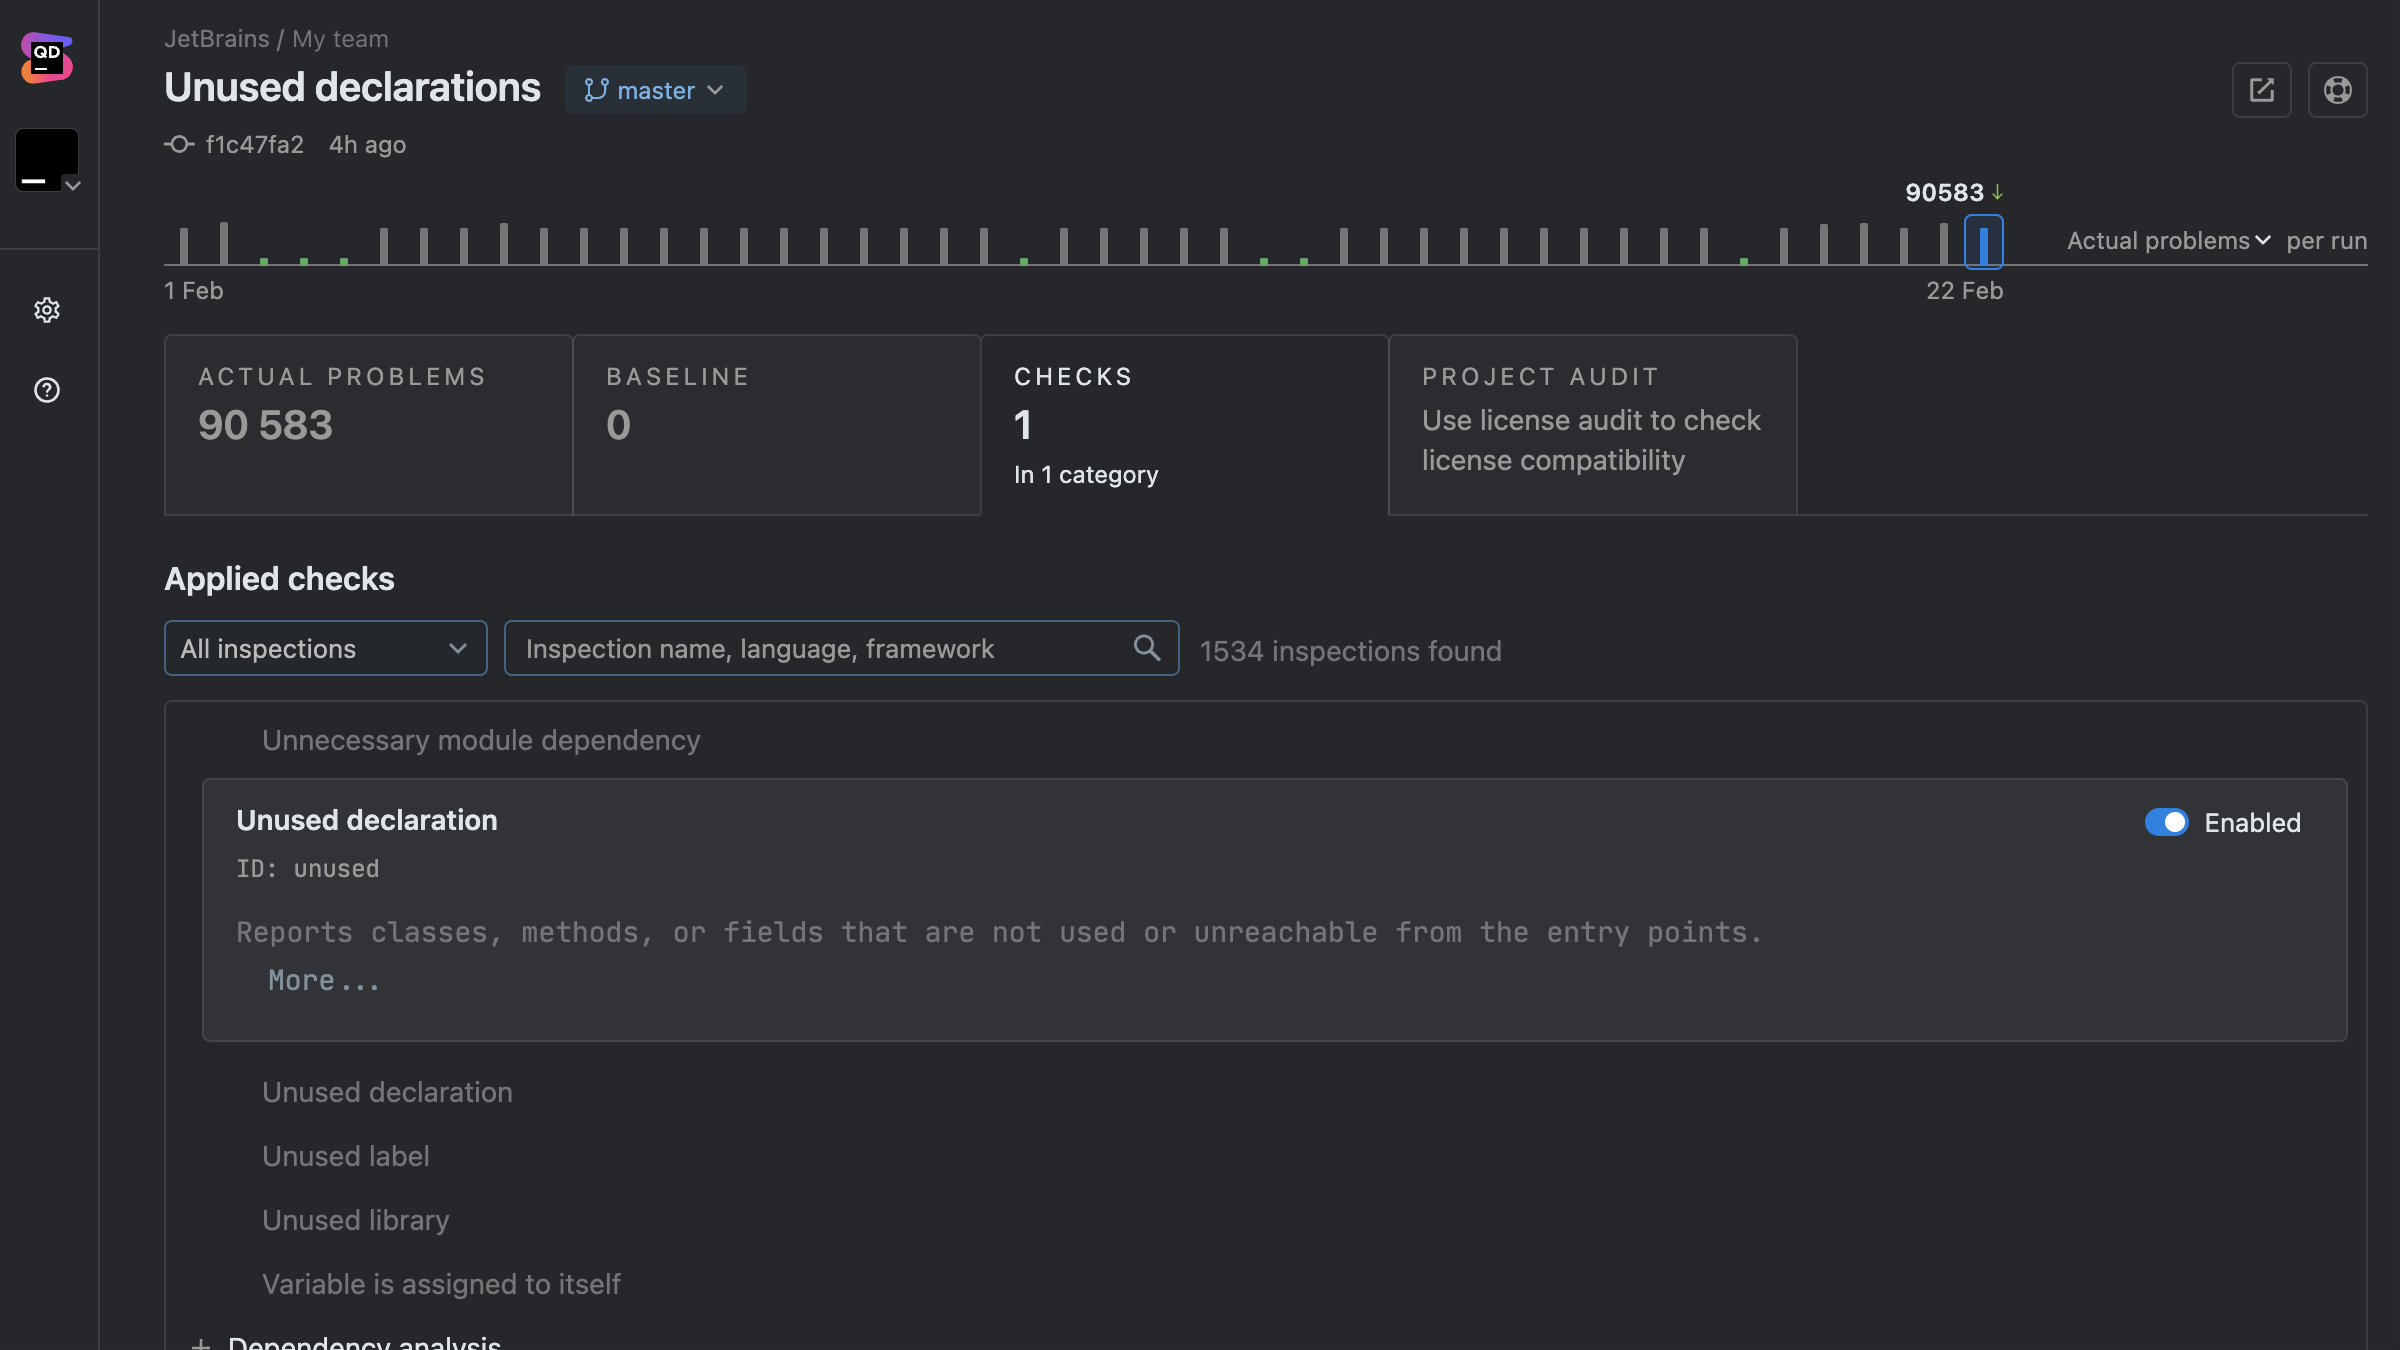
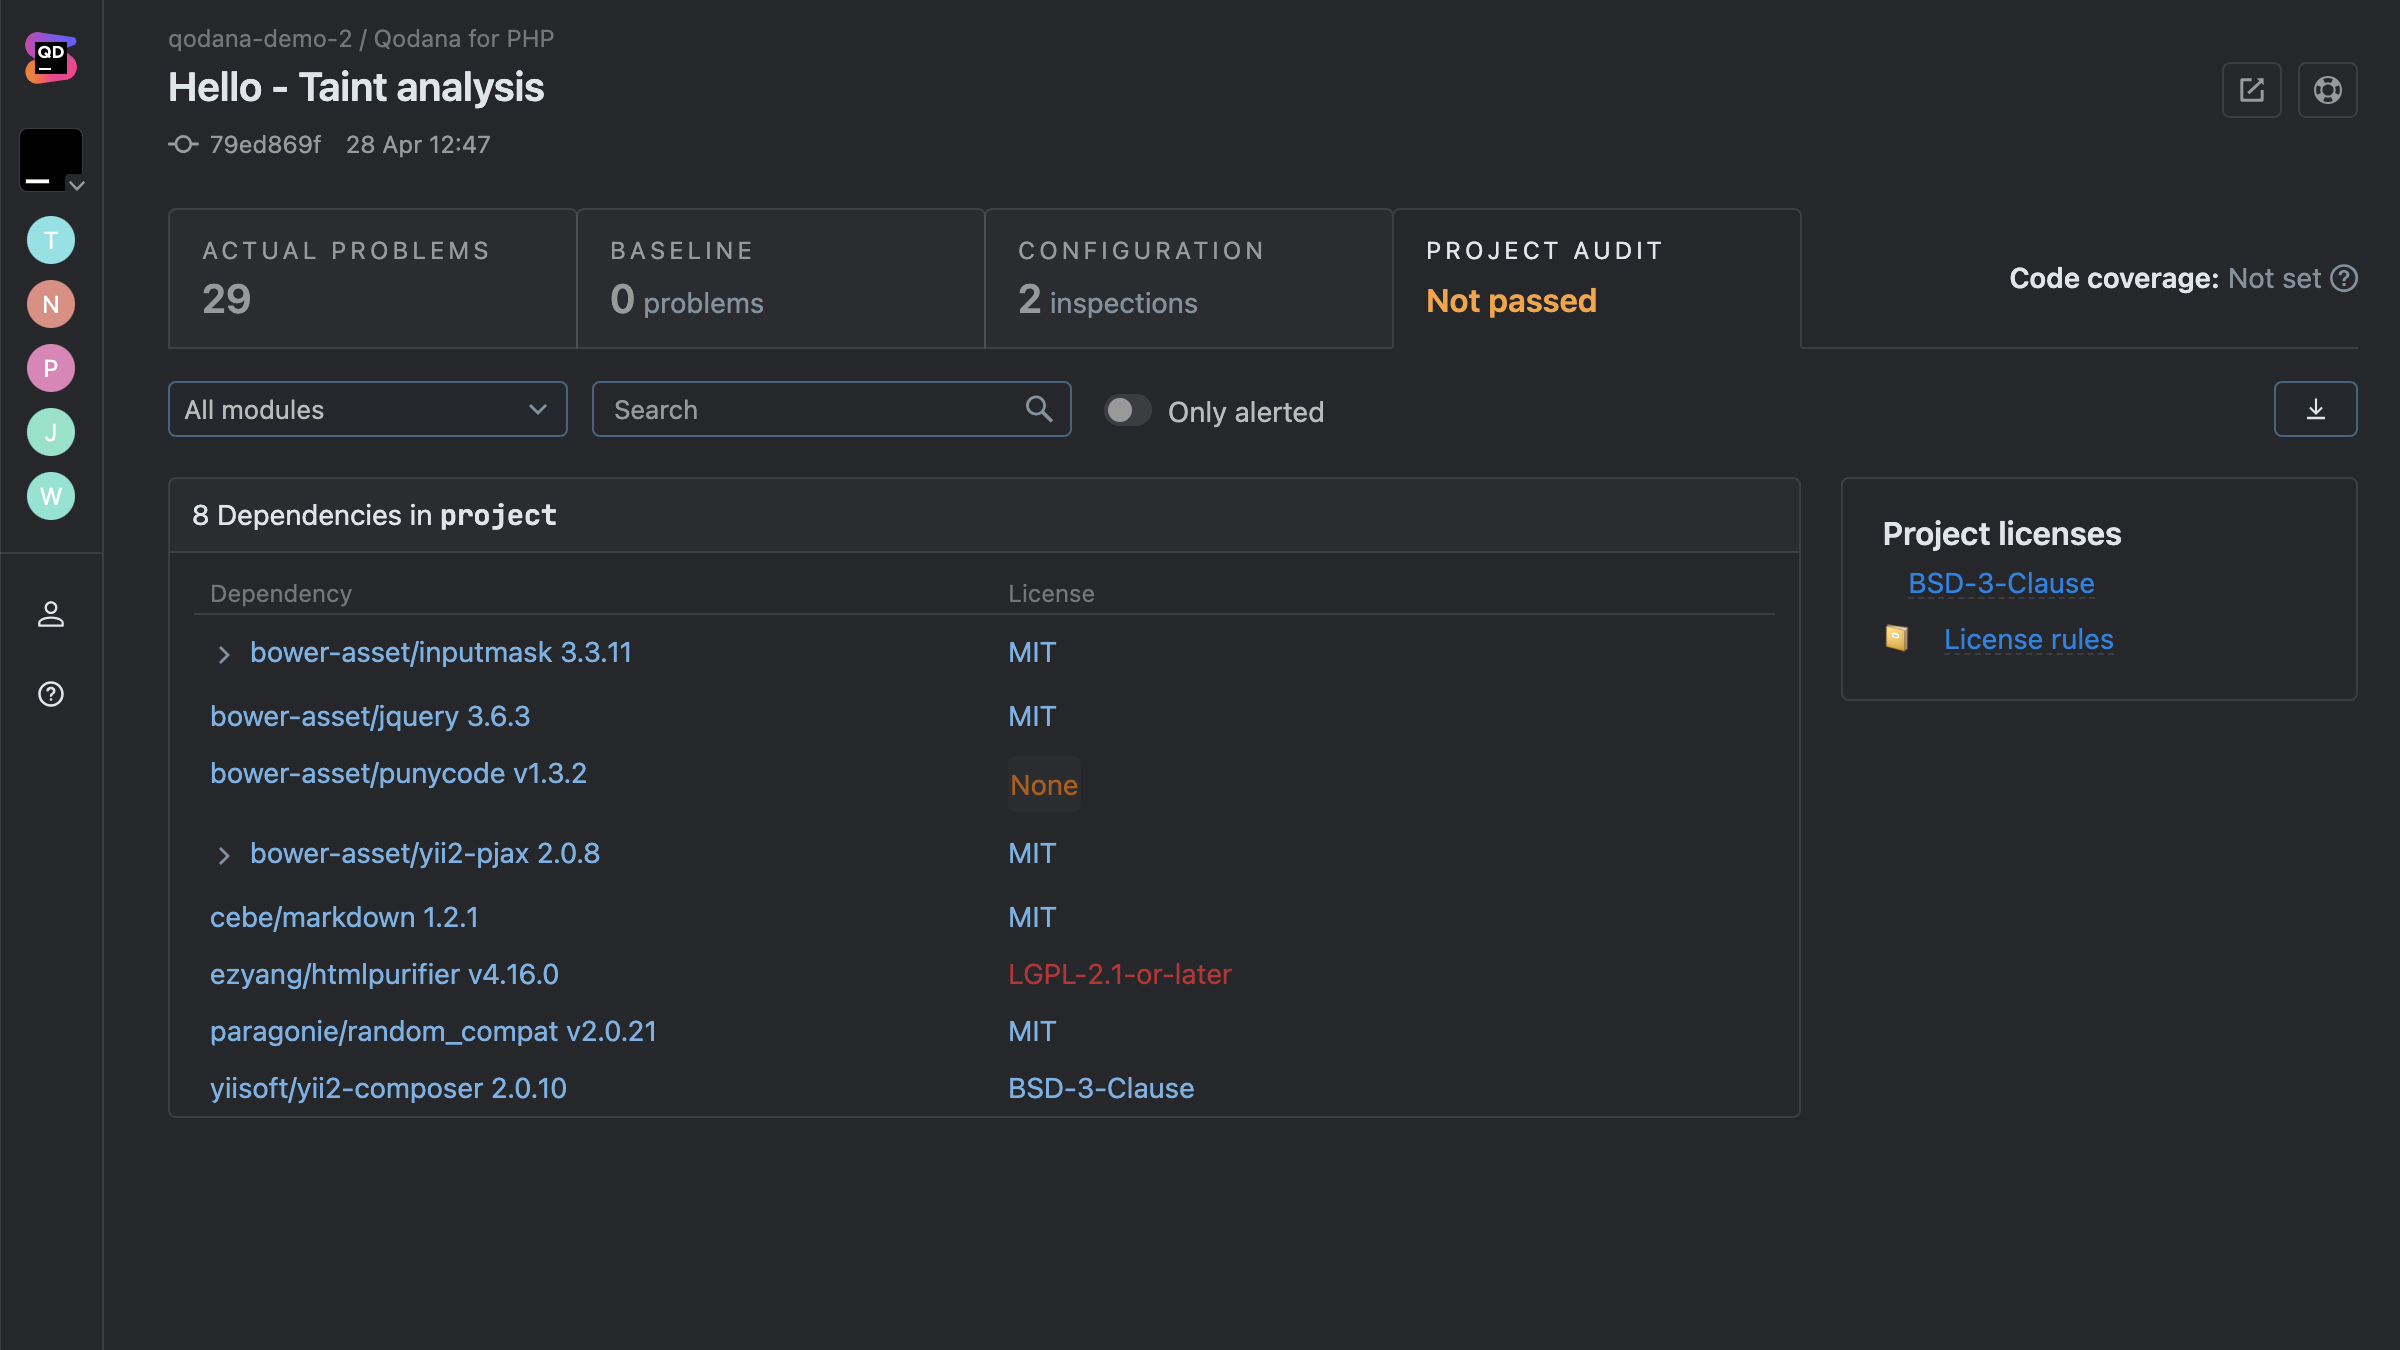
Using a static analysis tool like Qodana, you can detect a potential SQL injection vulnerability by inspecting the code without ever running it. Qodana would flag any unsafe concatenation of user inputs, highlighting high-risk security issues before they reach production.
With dynamic analysis, you would first run the application in a real or simulated environment and discover that user sessions aren't being terminated properly under specific conditions.
Relying solely on static analysis leaves gaps that dynamic analysis can fill. Both methods are powerful independently, but together, they provide a more complete picture of your codebase’s health, performance, and scalability. Try Qodana and experience automated static analysis in action!
Static code analysis tools operate in the background, continuously reviewing code as it’s written and proactively identifying discrepancies that may otherwise go unnoticed. This automated approach allows teams to uphold a consistent set of quality standards without interrupting the developers' creative flow. Instead of reacting to issues after deployment, developers can address potential concerns in real time, ensuring that the software remains robust and reliable from the outset.
The adoption of static analysis tools promotes industry best practices by institutionalizing a culture of precision and accountability. These tools provide a consistent means of ensuring that coding practices align with not only internal policies but also external regulatory and compliance standards, such as licensing and intellectual property regulations.
Static code analysis is particularly powerful for helping your team maintain consistent quality across a codebase, but it does have its weaknesses.
We’ve outlined them below and highlighted how you can mitigate these shortcomings for a comprehensive software testing process.
Strengths
Limitations
Integrating static analysis early creates a continuous feedback loop that identifies issues before they become problems. Establishing clear ownership of static analysis within your team is essential. This responsibility can be assigned to dedicated DevOps professionals or shared among team leads and quality assurance experts.
Regularly reviewing and updating rule sets to meet evolving project needs keeps the automated checks aligned with coding standards and best practices. Embedding static analysis throughout the development pipeline not only improves collaboration but also enables teams to address issues collectively while focusing on higher-level challenges.
When selecting a static analysis tool, consider taking the following steps to maximize its effectiveness:
Ensure that every commit is automatically checked.
Compatibility with your programming language and framework is essential.
Tailor the tool to match your team’s coding standards.
Address high-risk security issues before minor inconsistencies.
A layered approach improves the quality of your software.
Here are some things to look for when choosing a static analysis tool:
Language support
Ensure the tool supports all programming languages and frameworks in your codebase. A solution optimized for Java might not be as effective for Python, and vice versa. You should also consider what language your team might want to use for future projects. In our State of Developer Ecosystem Report for 2024, 10% of respondents were planning to adopt Go. It also highlighted the growing popularity of languages such as Typescript, which has surged to 37%, up from 12% in 2017. Qodana can help you analyze projects using both of these increasingly prominent languages.
Using a tool that doesn’t fully support your project’s languages may result in missed vulnerabilities or false positives. Choosing a tool with a breadth of language support prepares you for any potential expansion in the scope of your software project. For example, Qodana can analyze code written in 60+ languages, including Java, JavaScript, TypeScript, PHP, Kotlin, Python, Go, and C#. By contrast, ESLint is specifically designed for JavaScript.
Integration
Integrating static code analysis tools directly into your CI/CD pipeline is imperative for detecting code quality issues early. It reduces the cost and effort of later-stage debugging, an example of technical debt.
A tool that can be integrated into your development team’s existing workflow can enhance developer productivity and adoption. This integration ensures your codebase is analyzed at various stages of development and upholds consistent standards for code quality and security across your entire development team.
A study titled Automatic Static Code Analysis Through CI/CD Pipeline Integration, conducted by the Institute of Electrical and Electronics Engineers (IEEE), suggests that a lack of native pipeline support has hindered the widespread adoption of static analysis tools. The study recommends integrating these tools into the developers’ familiar issue-tracking software to streamline the identification and communication of security vulnerabilities during the development lifecycle.
Actionable reports
Clear, straightforward reports help developers quickly diagnose and fix issues. The less guesswork, the better. Non-actionable or confusing reports can overwhelm developers, causing critical issues to be overlooked or improperly addressed.
For example, vague security warnings may not provide enough details for developers to act on. When specifics such as the exact vulnerability type and suggested fixes are provided, developers are less likely to waste time investigating the issues or ignore them altogether.
Actionable reports that prioritize high-risk issues are particularly important for large codebases that can generate thousands of warnings. Prioritizing issues ensures that the most critical issues are addressed ahead of minor style violations that may not have a significant impact on how the code runs.
Look for tools that generate context-rich reports with clear explanations, risk levels, and actionable recommendations.
Customization
Every project is different, so be sure to choose a tool that allows you to fine-tune rules and settings to suit your specific needs. Inflexible tools may enforce irrelevant rules, leading to unnecessary alerts and important warnings being unintentionally disregarded.
For example, a general-purpose tool might flag naming convention violations over business-critical security flaws not covered in the default ruleset. A tool without customization options may also incorrectly flag valid code, which can result in teams ignoring repeated warnings and potentially missing important security issues that need to be resolved.
Choosing a tool that allows you to adjust severity levels, define custom security rules, and suppress false positives will ensure your team has a highly relevant copilot checking their code.
Ease of use
If a tool is difficult to set up or operate, it’s likely to be ignored or underutilized. The Automatic Static Code Analysis Through CI/CD Pipeline Integration study also suggested that poor usability issues hindered the widespread adoption of static analysis tools. It found that once a static analysis tool was integrated into issue-tracking software a developer was familiar with, they were positive about its impact on their work. They cited proactive vulnerability management and real-time feedback as the biggest benefits to their workflow.
Look for intuitive interfaces that have up-to-date documentation to support the implementation of static analysis tools into your team’s workflow.
Static code analysis is invaluable for writing scalable code and enforcing standards. By embracing it, you’ll produce cleaner, safer, and more maintainable software that can last well into the future. With Qodana, it’s easier than ever to get started.
Are you ready to speed up your workflow without compromising code quality? Start writing cleaner, safer code today!
At JetBrains, we built Qodana to enhance static code analysis. Here’s how Qodana stands out:

Qodana goes beyond the basics of identifying code smells by enforcing coding standards and providing real-time insights. It’s like having a senior developer constantly reviewing your work, highlighting issues before they escalate.

Qodana integrates easily with JetBrains IDEs and any CI/CD tool, including Jenkins, GitHub Actions, GitLab, and TeamCity. Whether you’re working locally or as part of a team, Qodana fits right into your existing processes.

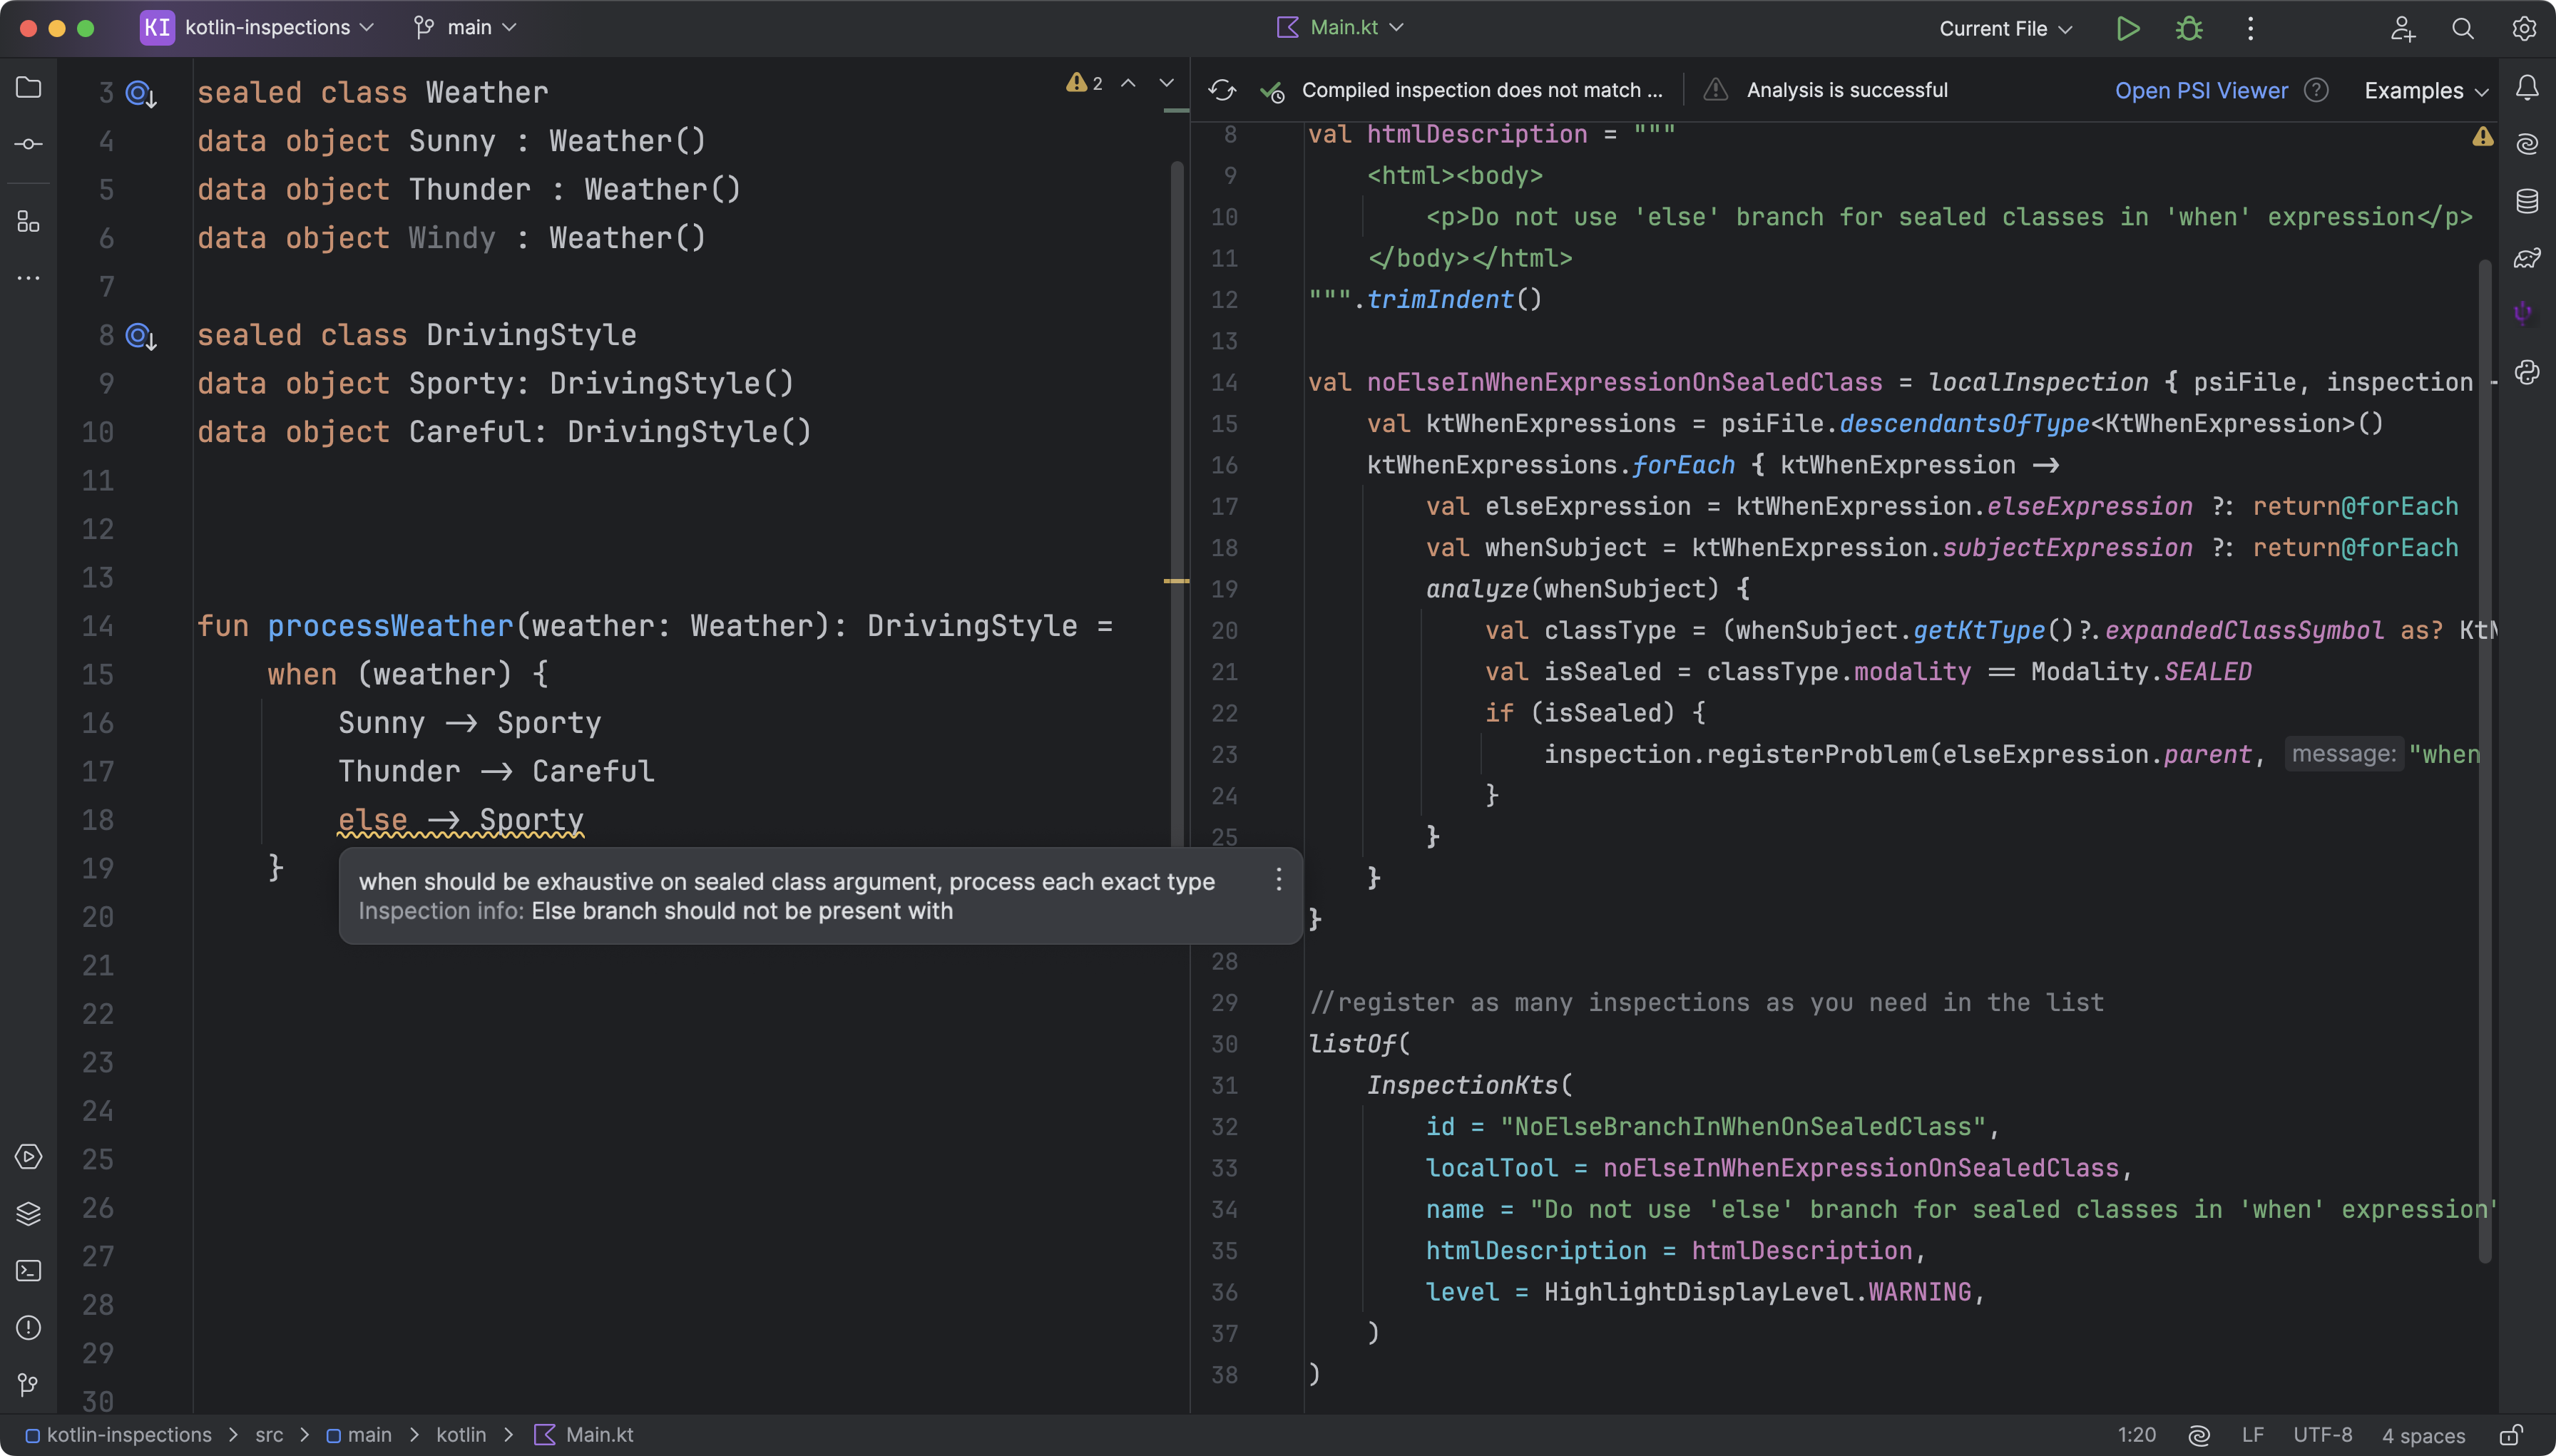
You can create custom inspection profiles using YAML configuration files to define which inspections to enable or disable, specify paths or scopes for analysis, and set severity levels to mitigate unnecessary alerts. With Qodana’s FlexInspect feature, you can also create custom code inspections.
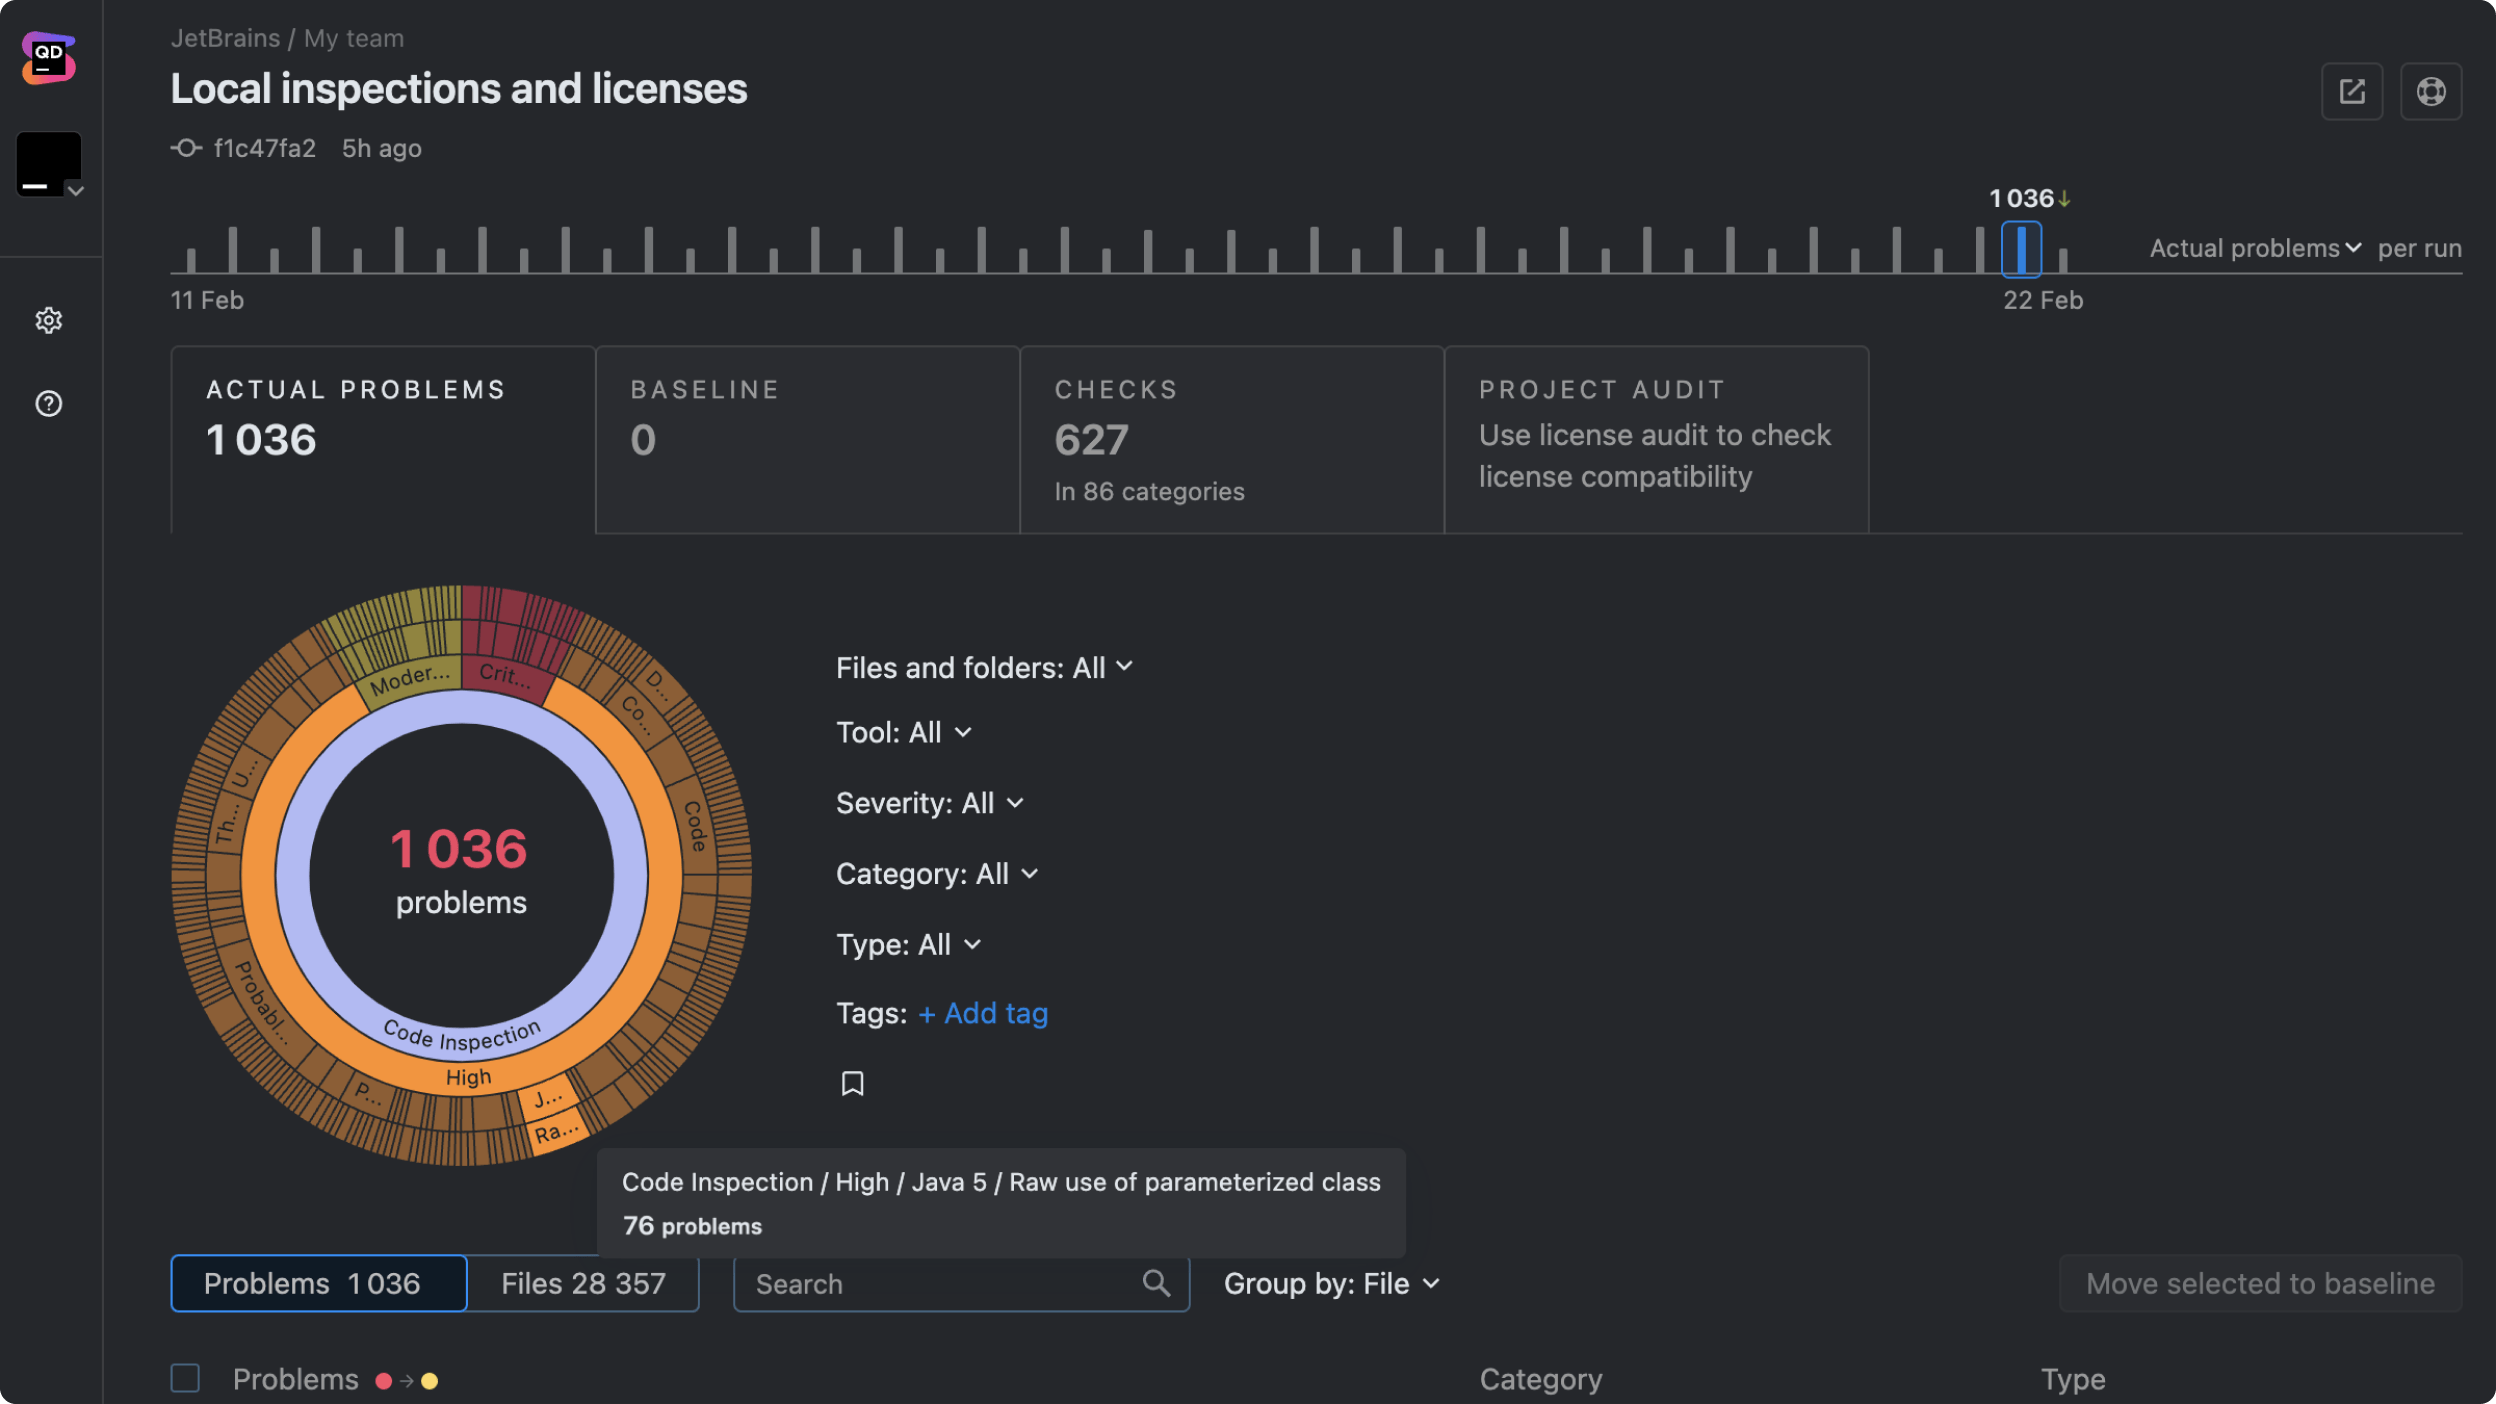
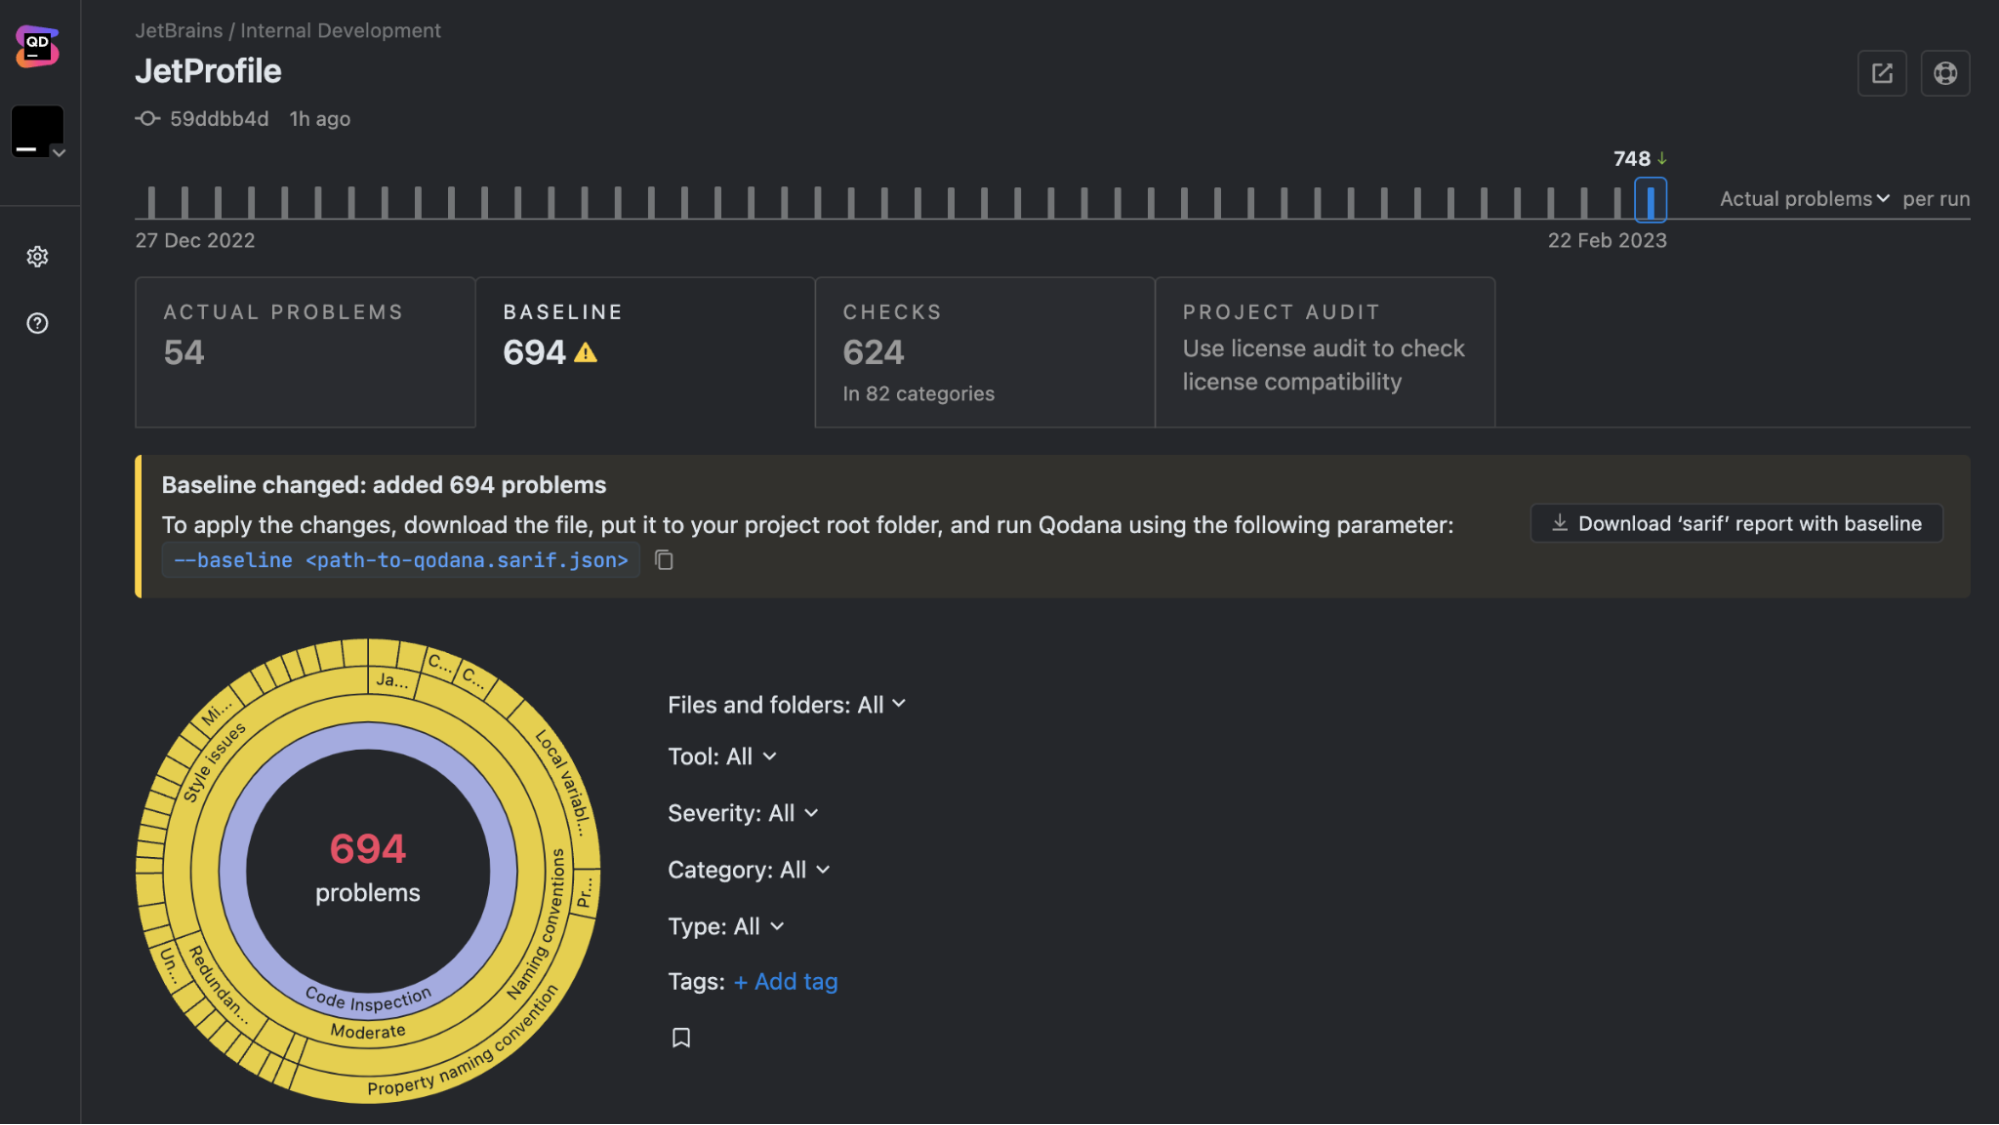
Qodana’s reports are easy to understand and act on. They provide clear, prioritized feedback that you can implement immediately.
Qodana helps development teams follow agreed quality standards, and deliver readable, maintainable, and secure code.