Release notes
This section lists functionality added to DataGrip in the current release. To view release notes for other DataGrip versions, click the version switcher on the help site and select the version that you need.
AI
AI agent skills for working with databases
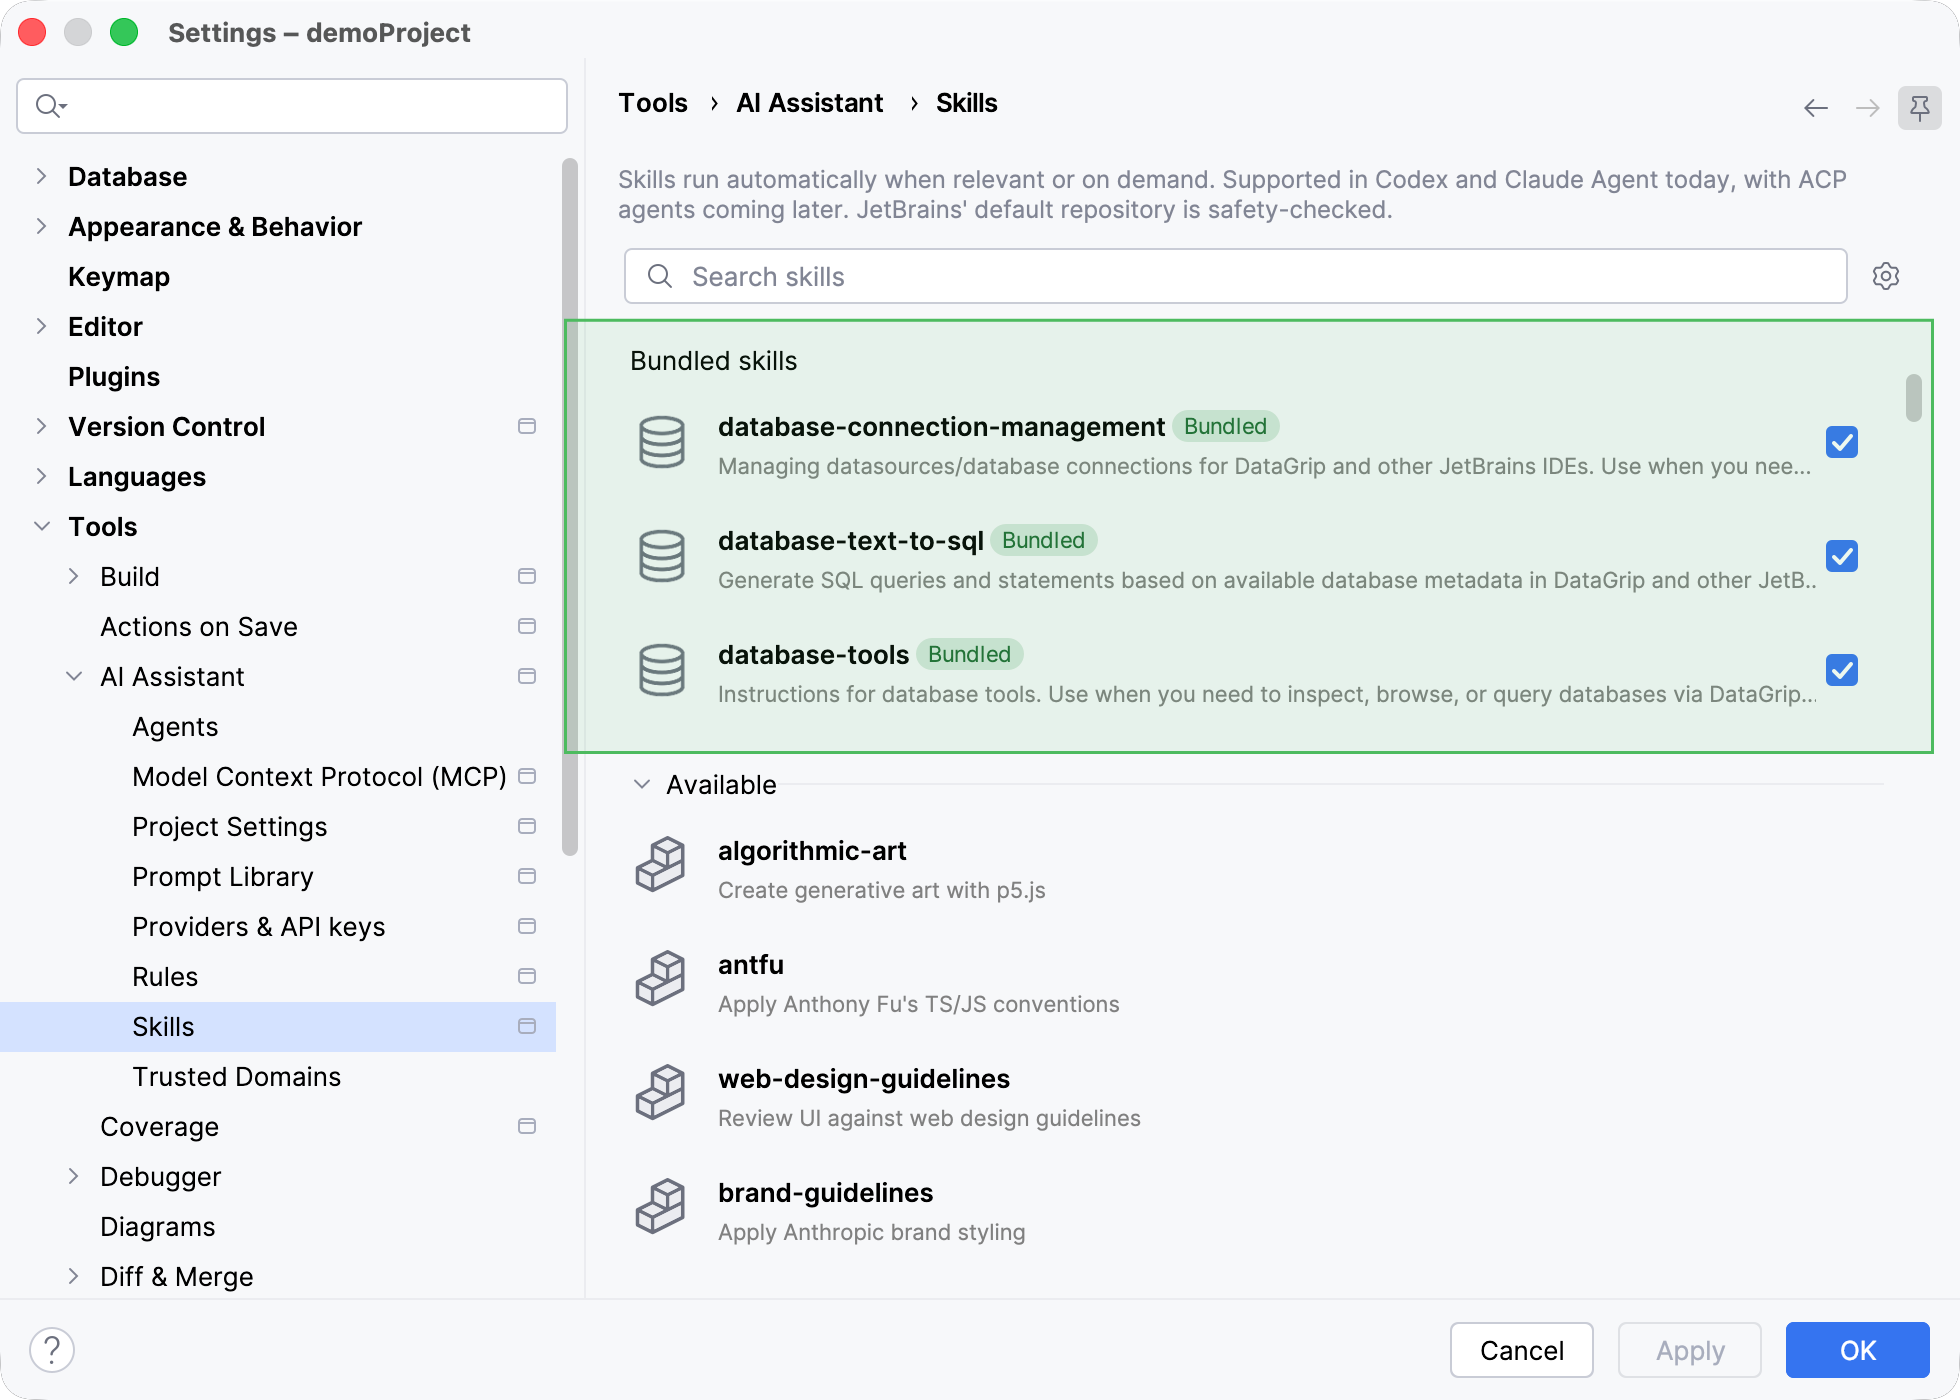
DataGrip now has three agent skills for working with databases: database-connection-management, database-text-to-sql, and database-tools.
database-toolshelps you explore and interact with connected databases. For example, if you ask an agent to list the tables from a database, to show the first rows of a given table, or to run a query, the agent will browse schemas, introspect metadata, preview data, and, when allowed by your settings and permissions, execute queries directly against the live connection. To reduce token usage, only a small sample of query results is initially added to the agent's context, and additional rows are retrieved only when needed.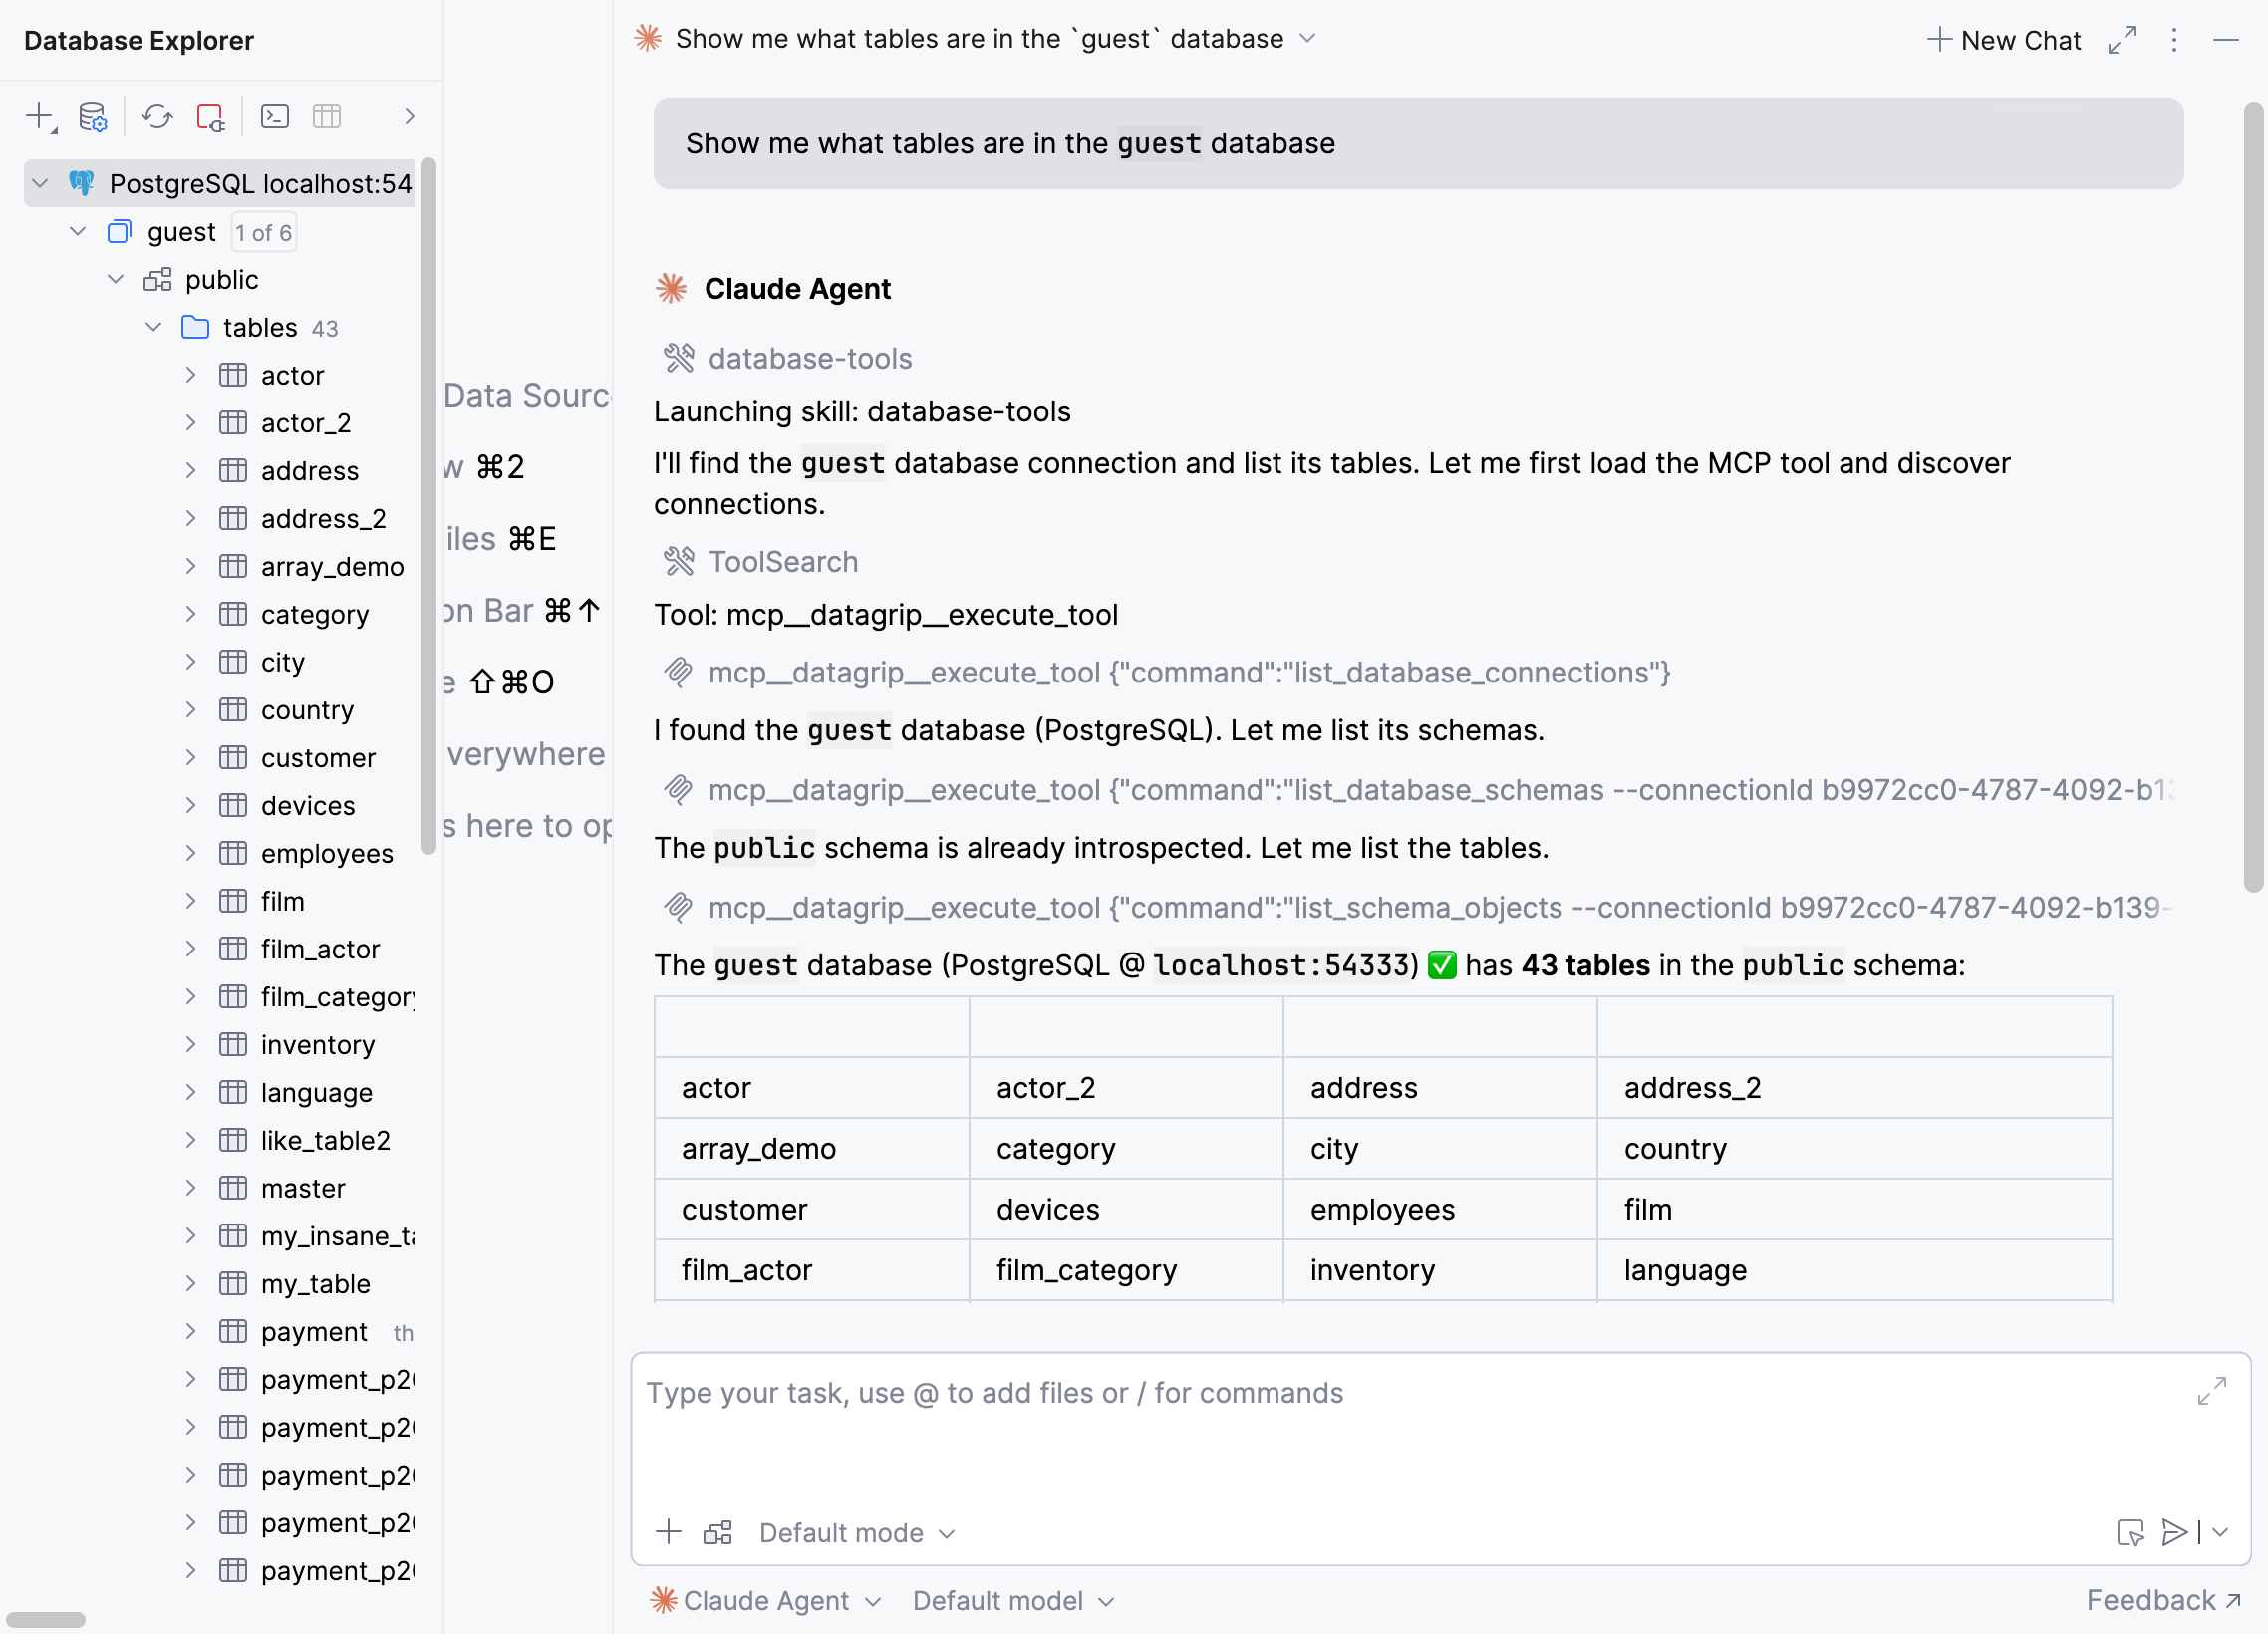
database-connection-managementhelps you set up a working database connection from the AI chat. For example, when you ask an agent to create a data source, providing some connection details, the agent will collect the missing information, build the JDBC URL, create the data source, and verify that the connection works. It can also fix and retest broken connections and list configured data sources.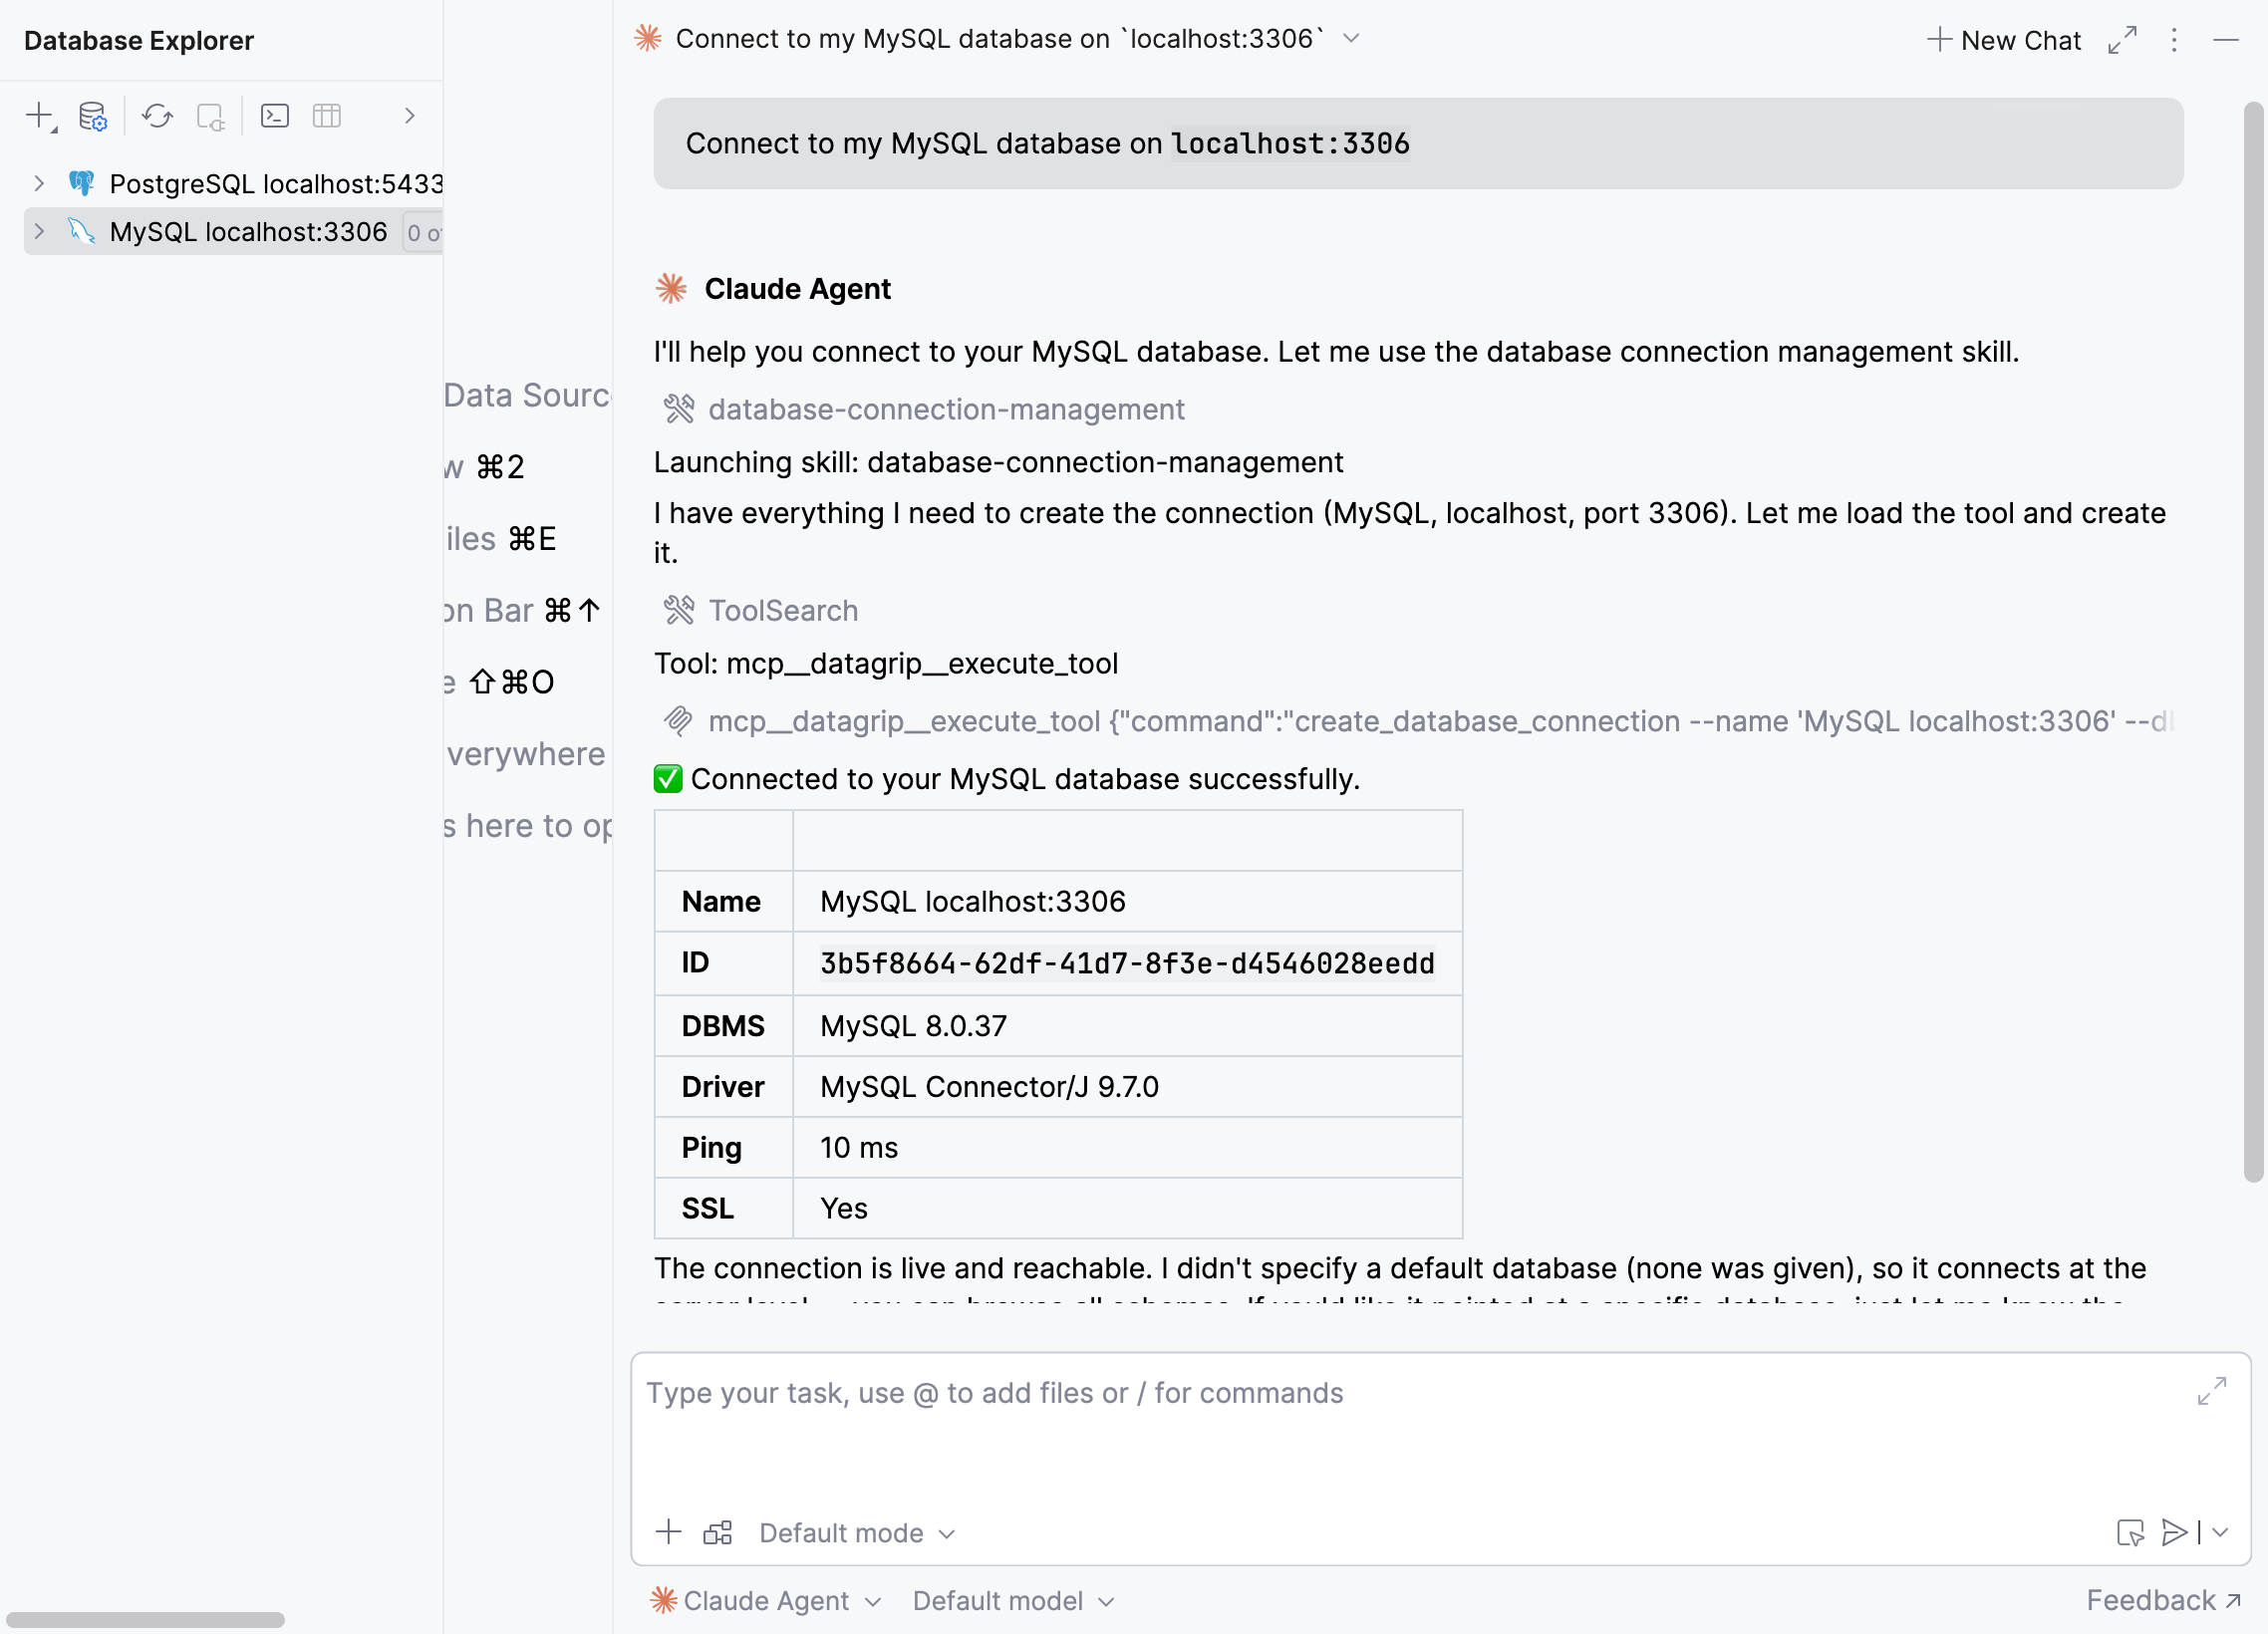
database-text-to-sqlhelps you turn plain-language requests into SQL queries. For example, if you ask an agent to show you the top 10 customers by total order value, it will explore the relevant schema and table structures on its own and generate a query against the actual database metadata, rather than guessing about table and column names. When safe and allowed by your settings, it can also run the query to verify that it works.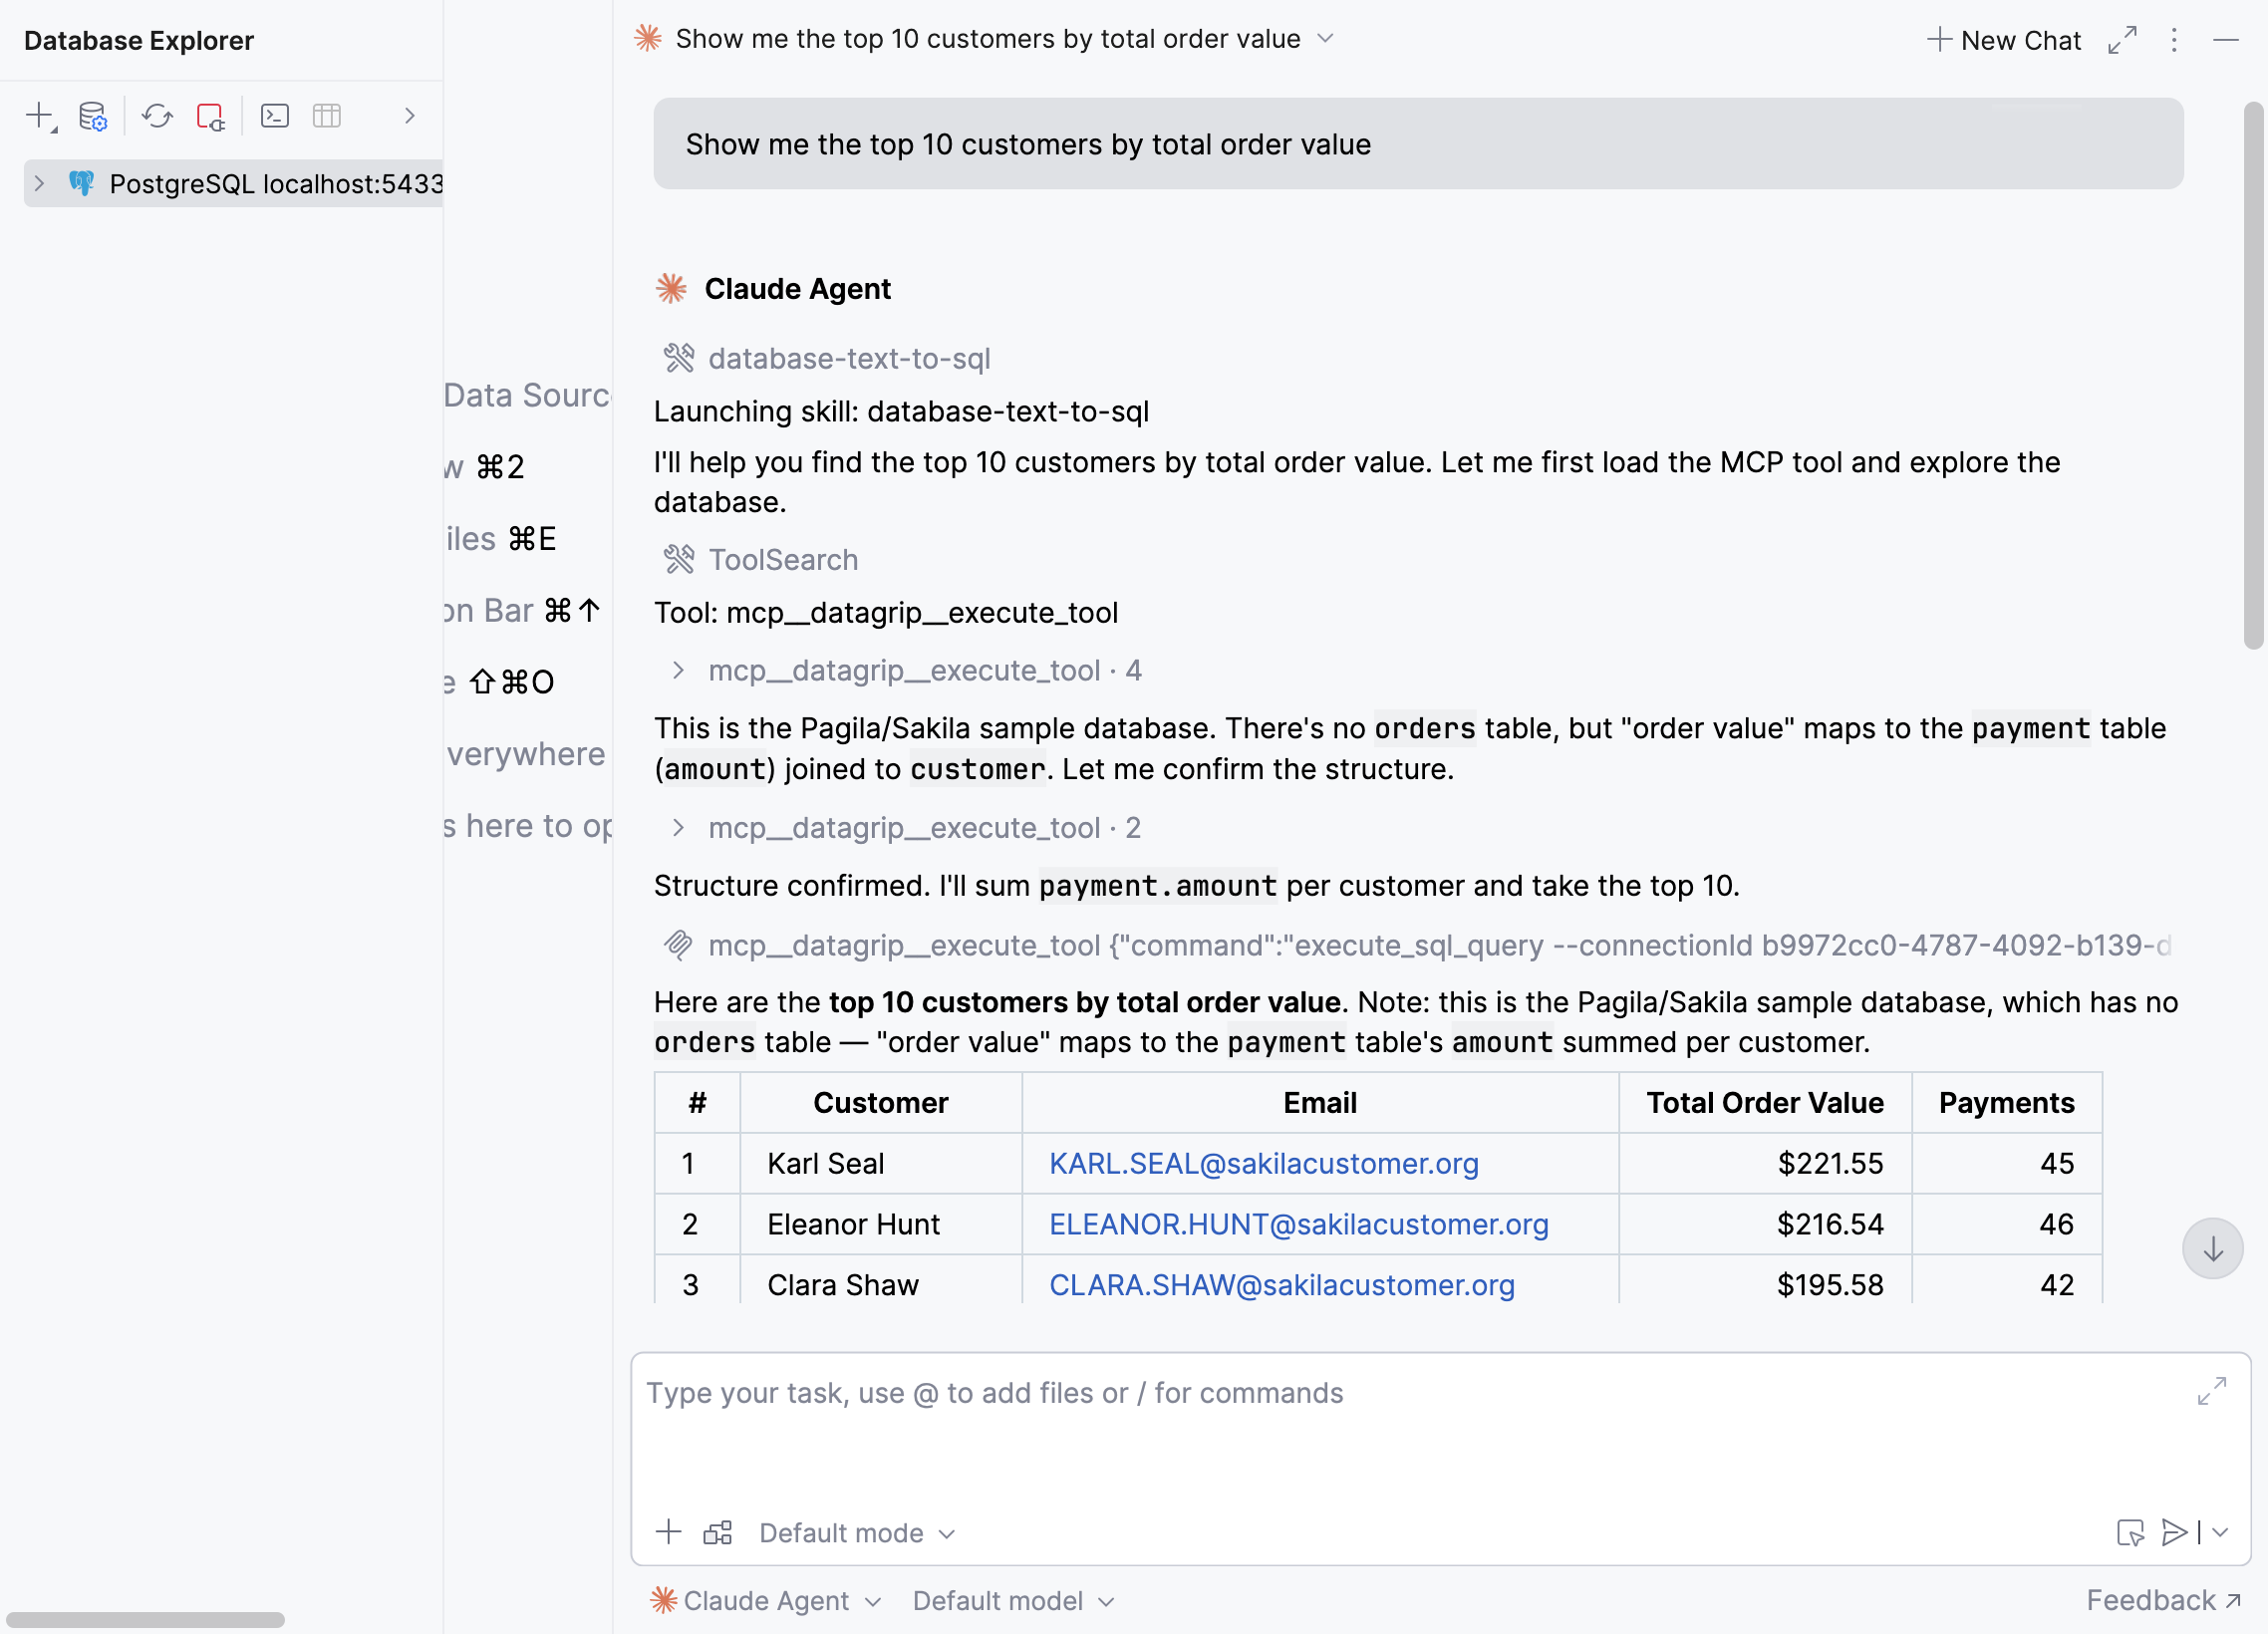
These skills also enable MCP tools by default, which means any additional settings do not have to be turned on to use the following agentic scenarios:
Text-to-SQL
Running queries
Retrieving the results
Observing schemas
Database introspection
These database-related skills are bundled with the IDE and enabled by default. They are available only in the AI chat – not in the CLI. To toggle them, go to .
Data sources management with MCP tools
More MCP tools that help AI agents work with databases are available now. This release adds two new tools to the list: create_database_connection and edit_database_connection.
The database-connection-management skill includes instructions that help agents use these tools properly.
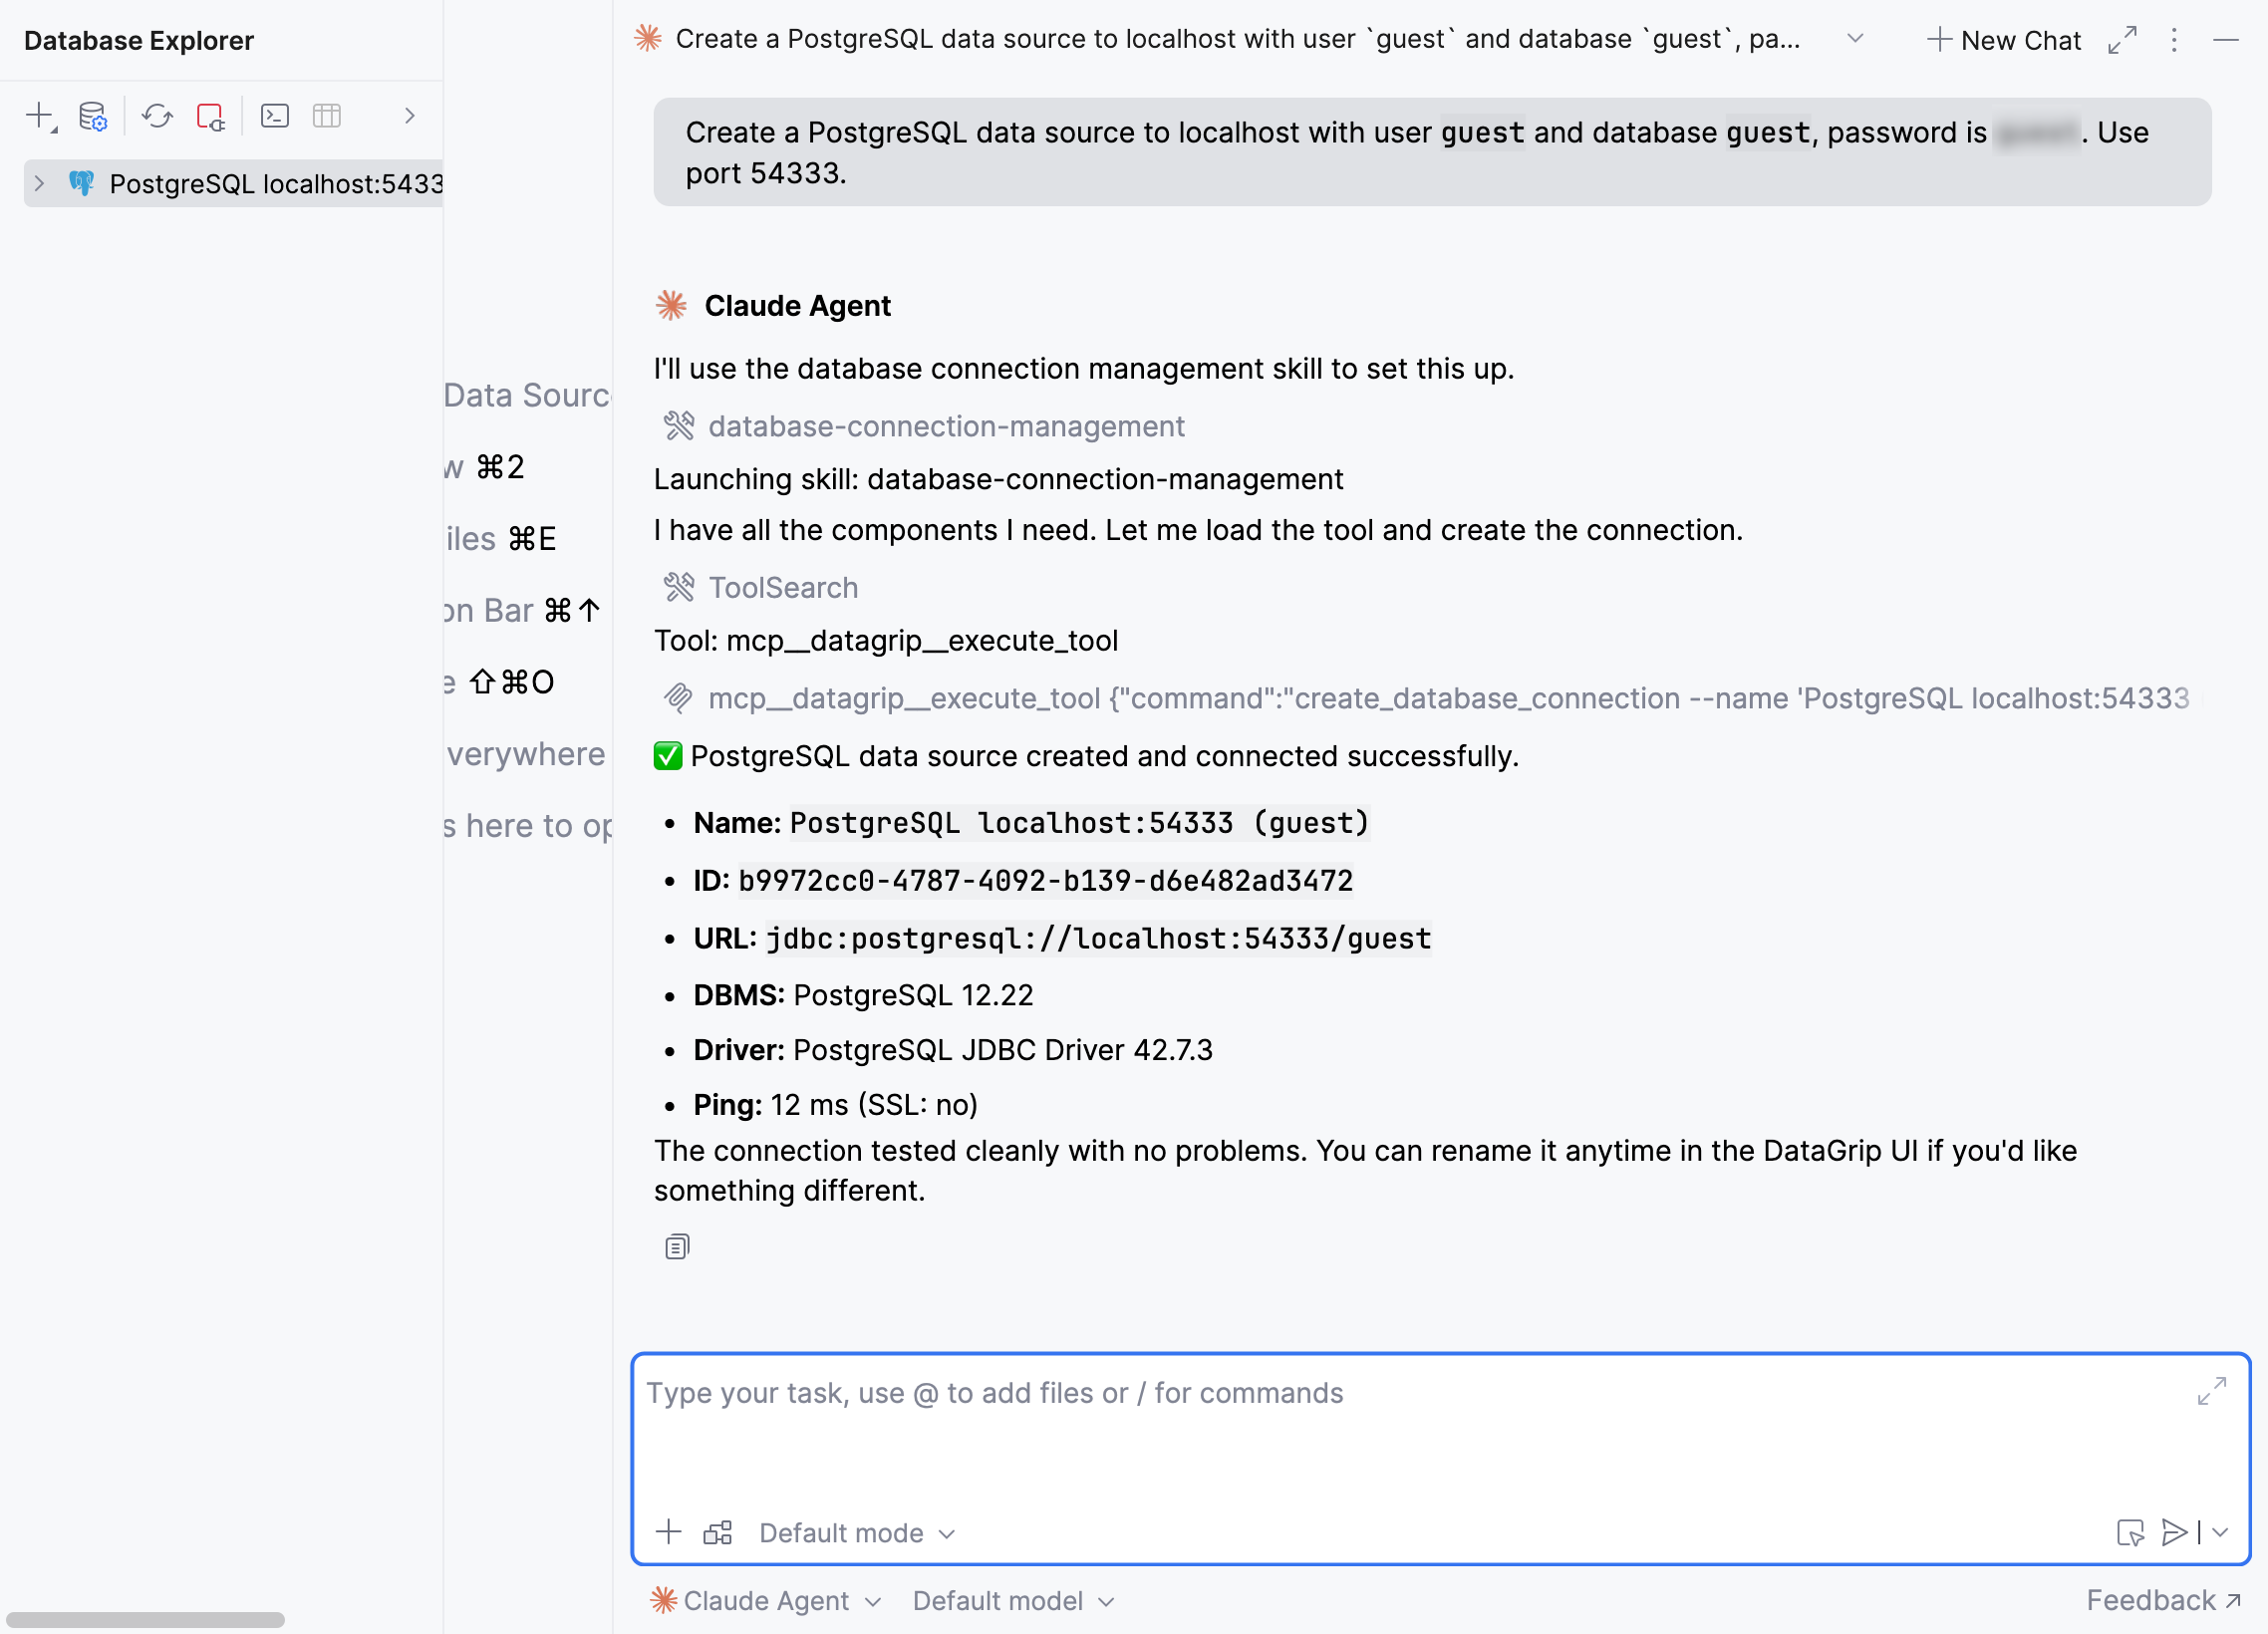
To have an agent create a new data source, ask it to do so and provide the connection details. The agent will create the data source and run a test connection.
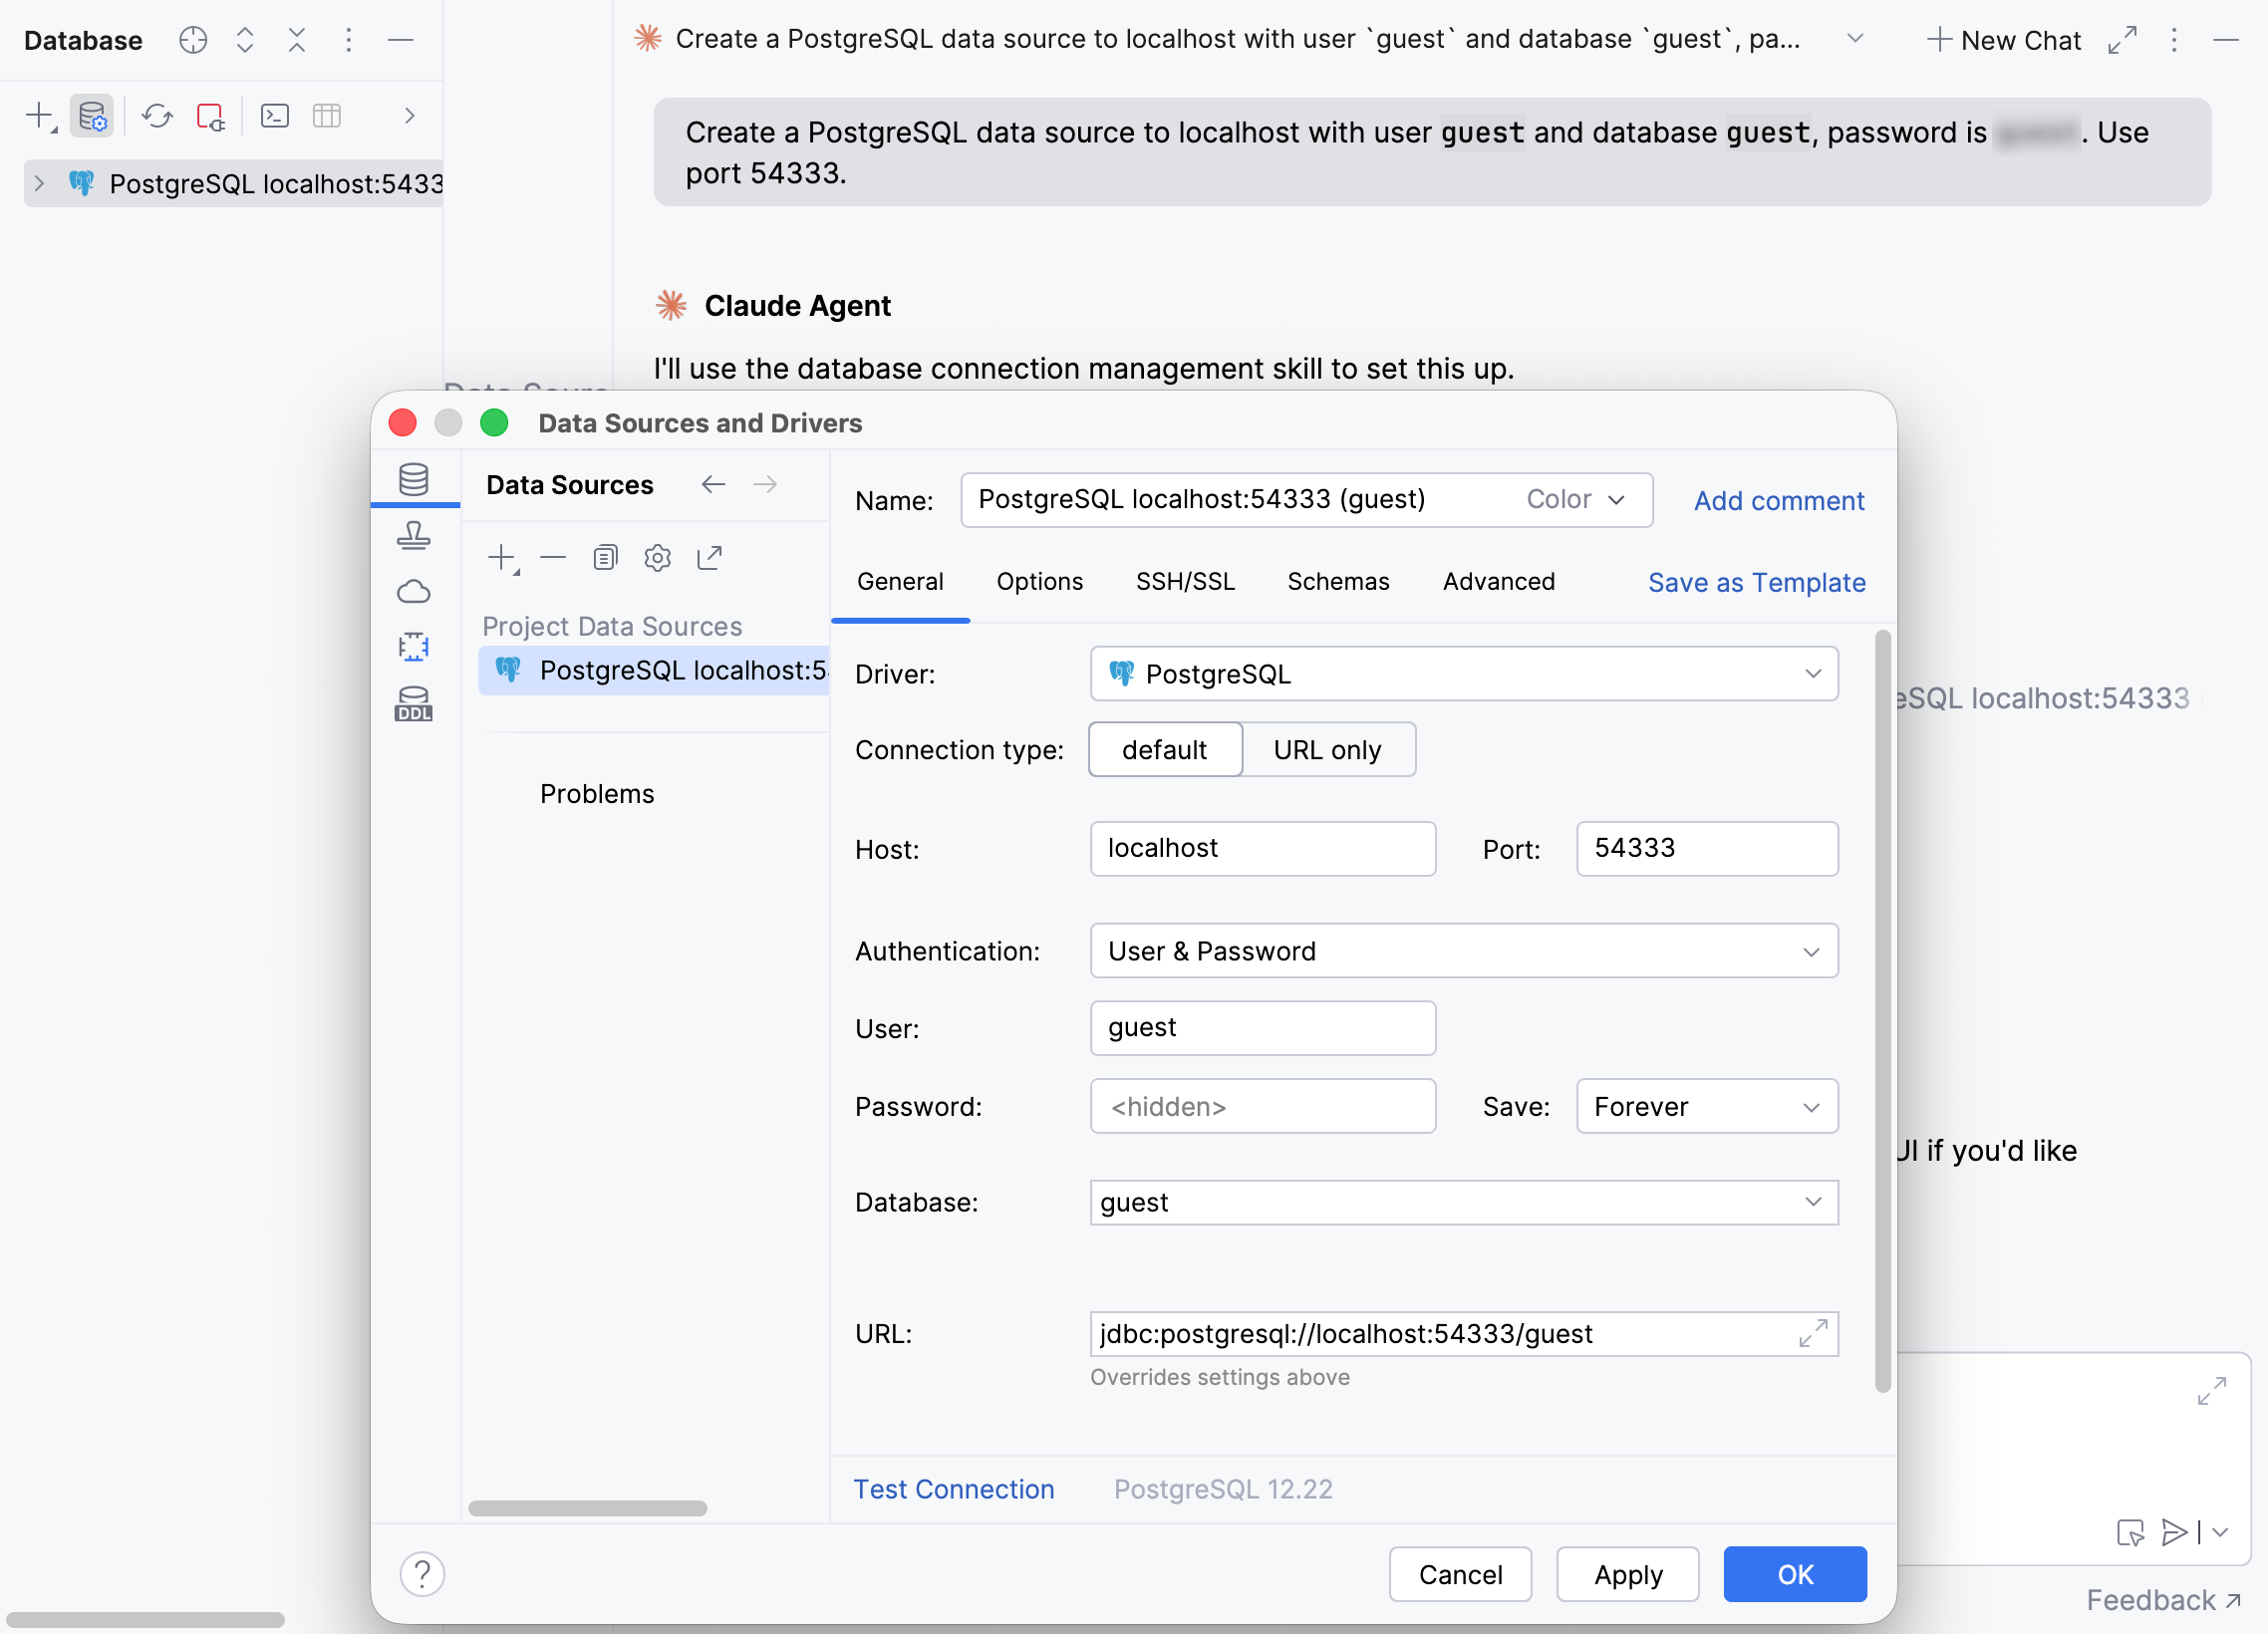
The data source settings contain the connection details you provided.
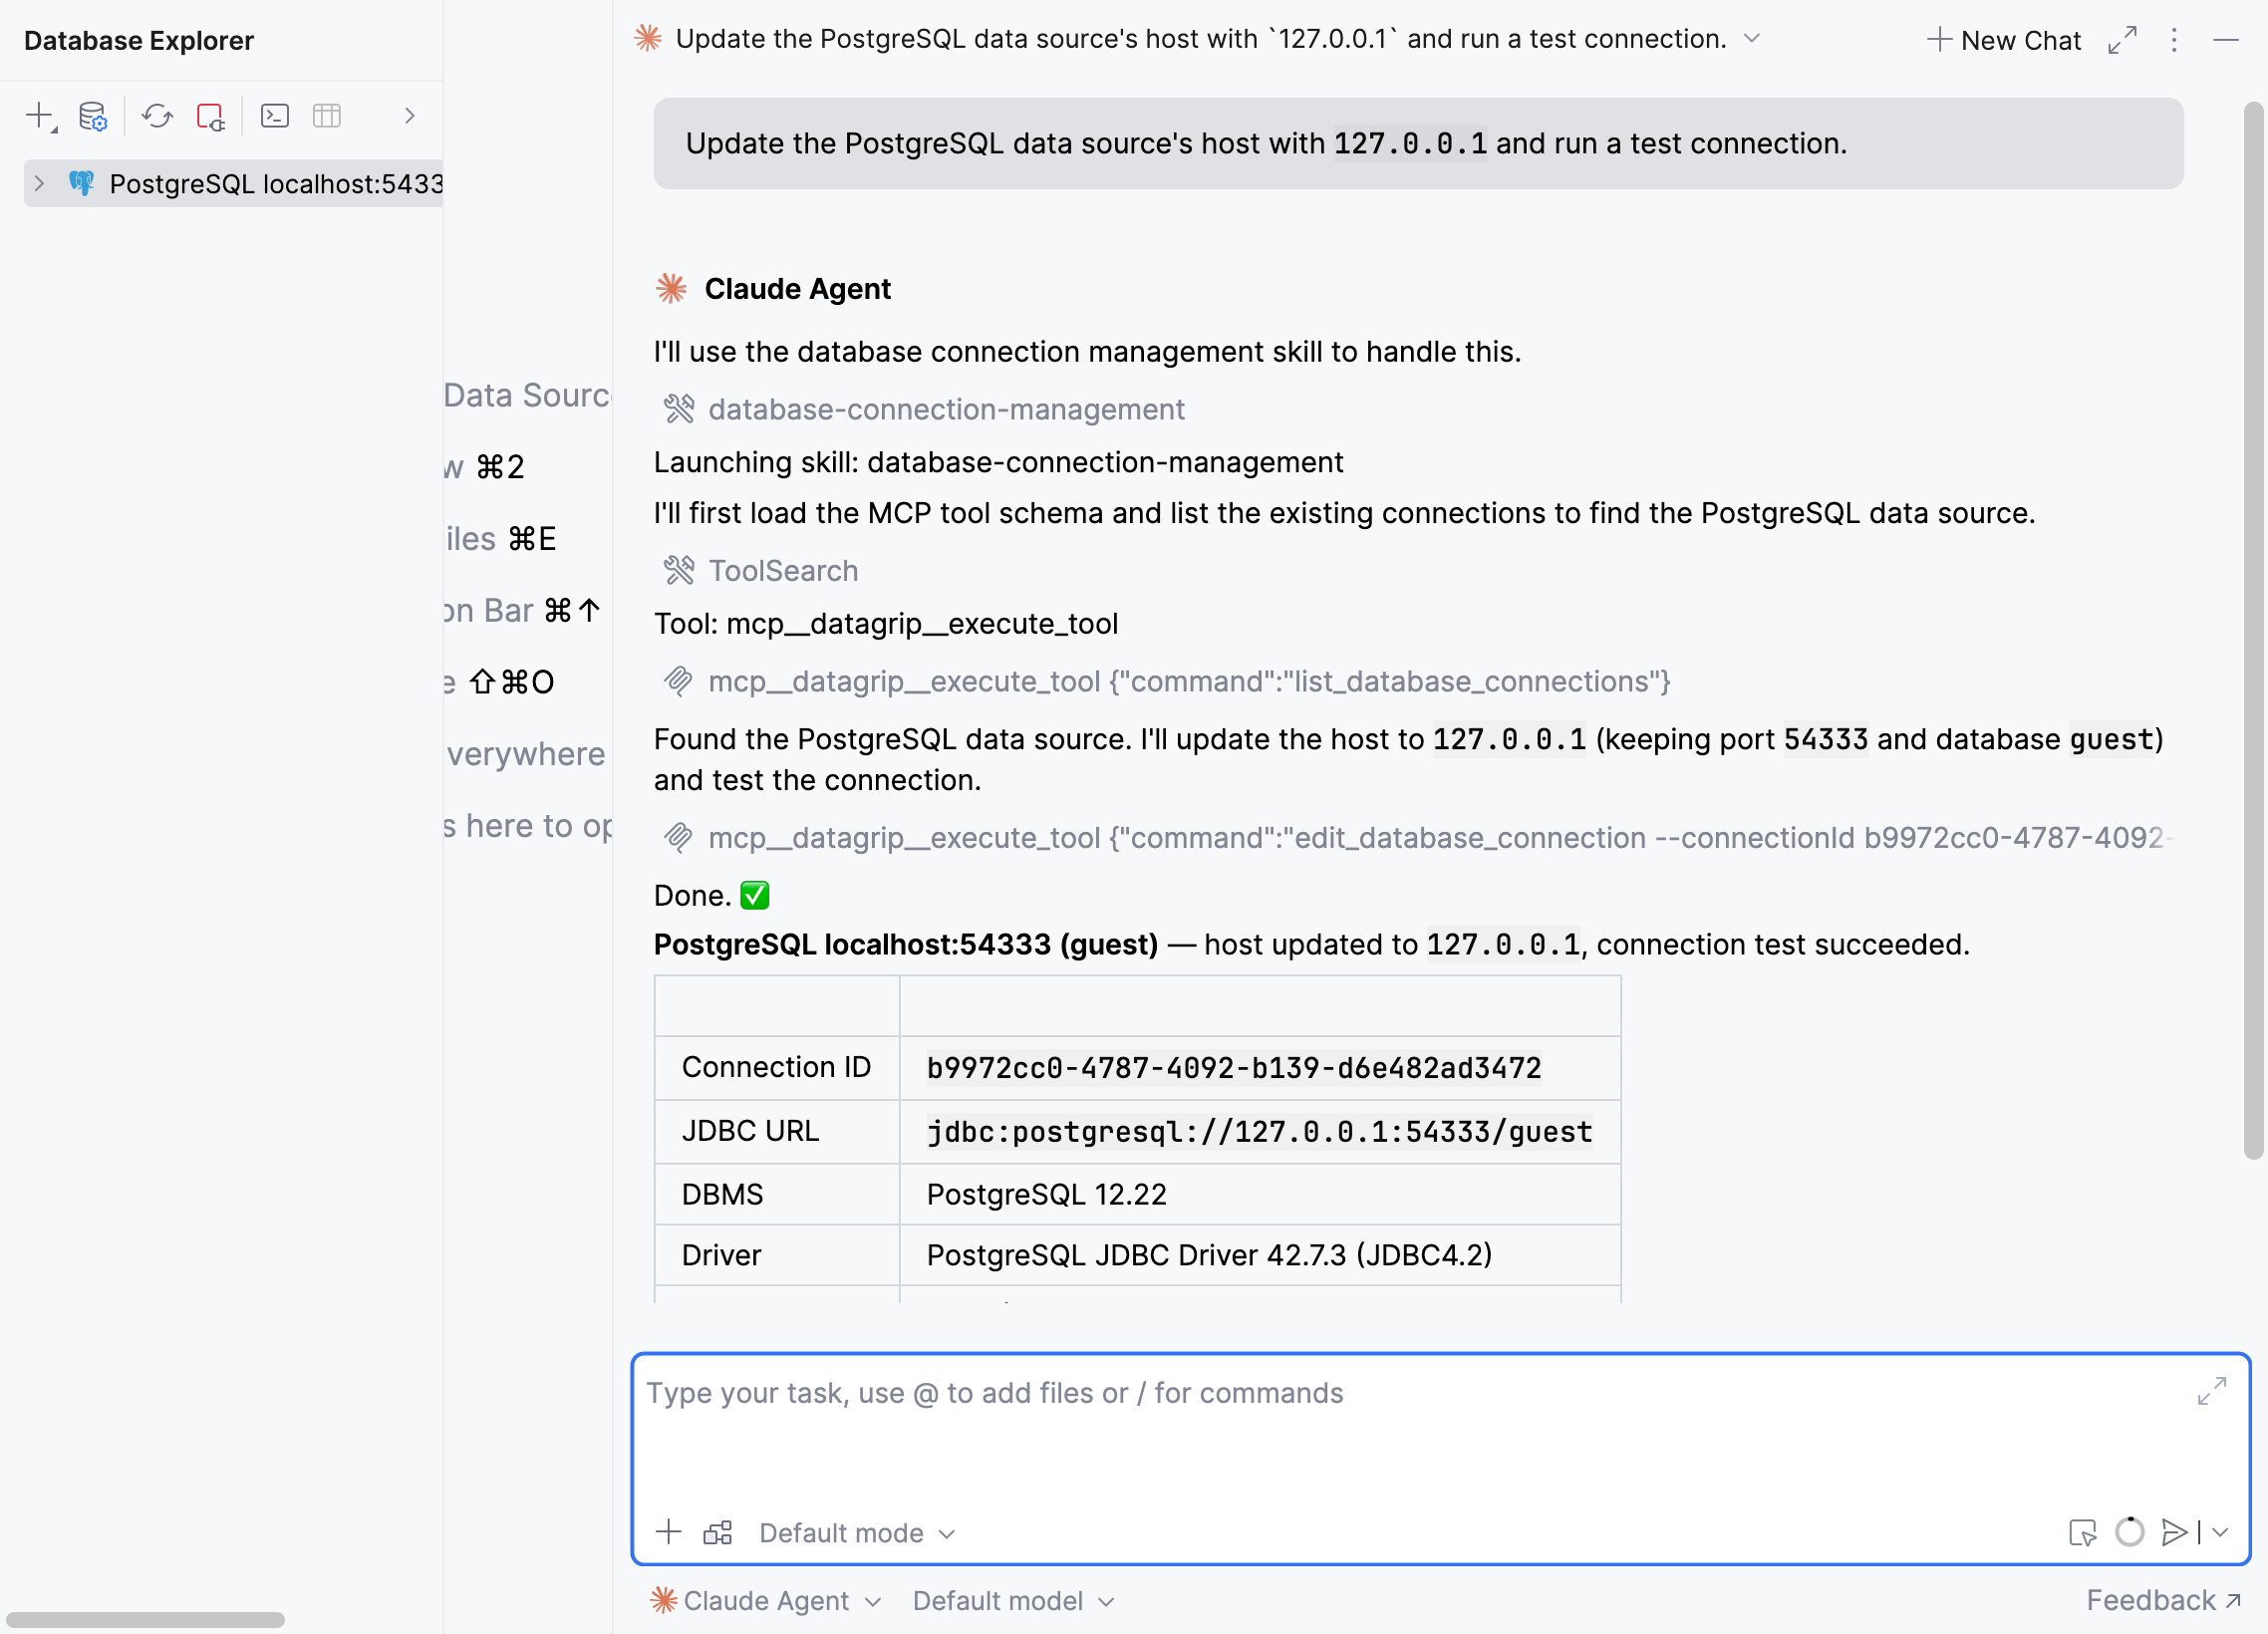
If you need the agent to diagnose a connection issue or update an existing data source, ask it to do so, providing necessary details.
User consents for database operations in the CLI
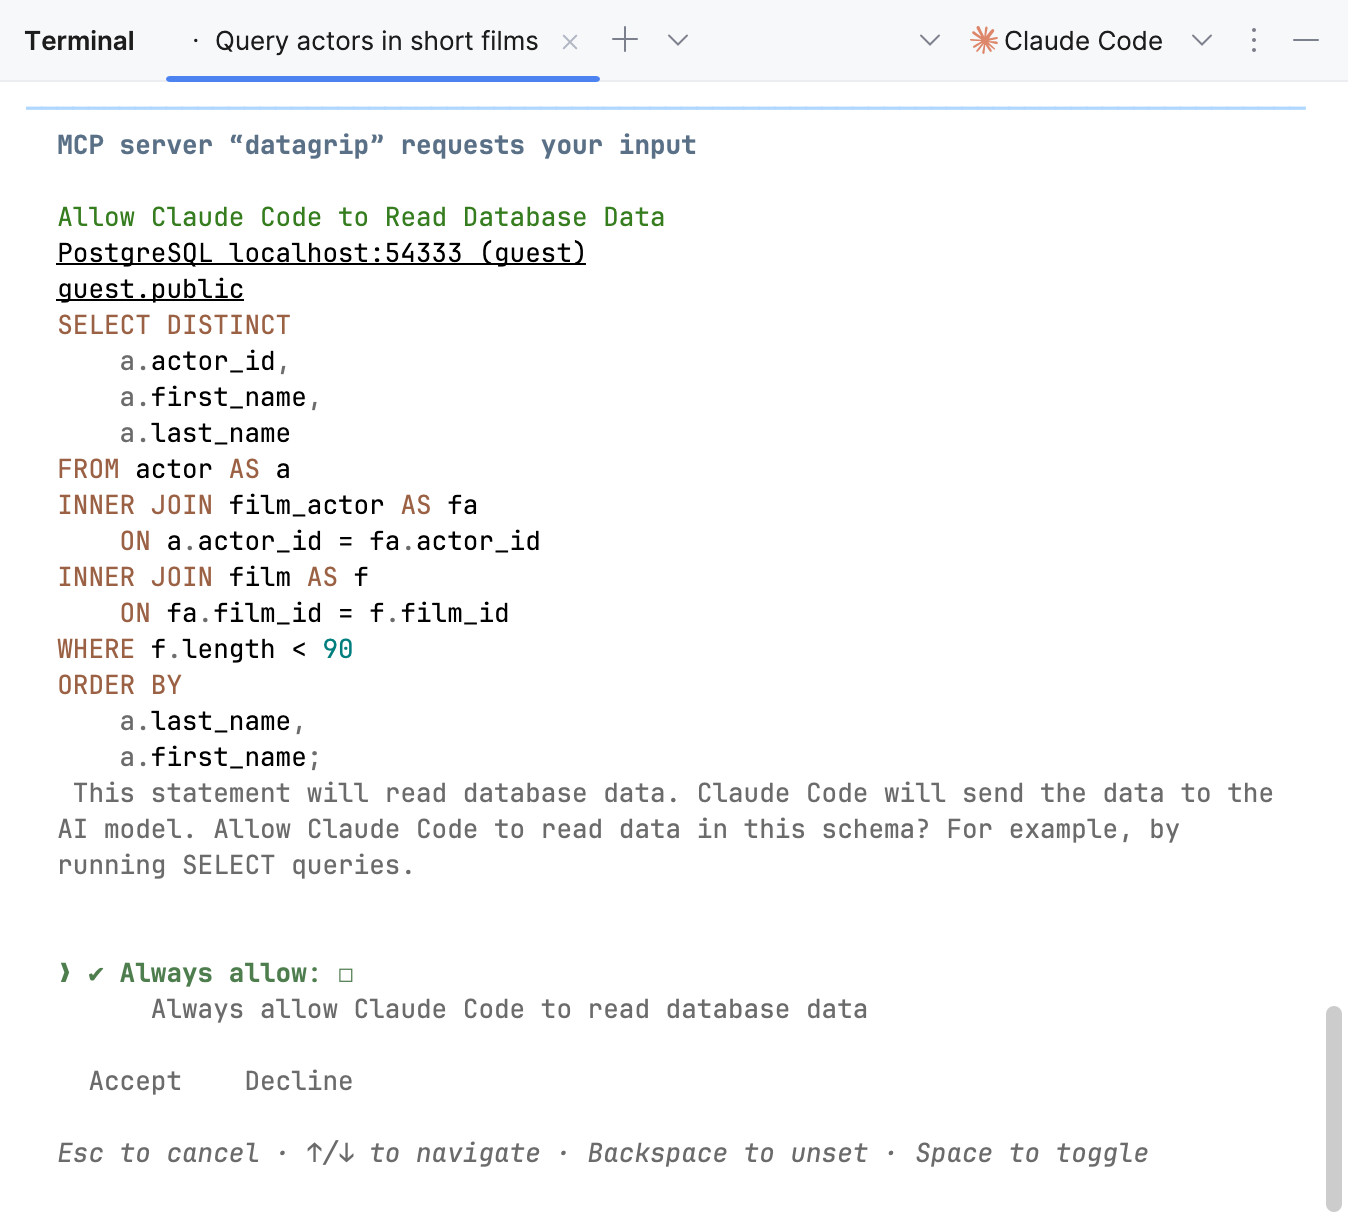
When you work with an agent in a command-line interface (CLI) and the agent needs to perform an operation on a database, it now asks for user consent and shows what it is about to do. The consent form supports syntax highlighting for SQL queries.
Note that for multiline queries in Claude Code, the options at the bottom of the form might not be displayed properly. The current workaround is to resize the terminal window or switch the terminal UI to the default mode by running /tui default.
Other improvements
AI in DataGrip now remembers query results from previous interactions, allowing you to fetch additional rows without rerunning the query. This also works for statements that return data with
RETURNING.When an AI agent creates a table, a column, or any other database object, DataGrip automatically introspects the database or schema you’re working with. The newly created object will appear in the database explorer right away.
Previously, when an AI agent couldn’t find a referenced database object, it couldn’t tell whether the object didn’t exist or had not been introspected. Now, the agent can identify missing objects, suggest similarly named objects in case of typos, and recognize objects that have not been introspected.
Queries run by AI agents are now also tracked and logged in the data source query history. To check them, open the data source’s query console by pressing Ctrl+Shift+F10 and selecting any query console. In the query console tab, click
 Browse Query History or press Ctrl+Alt+E.
Previously, AI agents received a generic
Not doneerror when an SQL query failed. Now, the agent receives an actual database message with an SQL error.The
list_database_connectionsMCP tool now returns database connection information correctly. Previously, incorrect handling of parameters with default values caused an output schema error.The database schema attachment UI in the AI chat has been redesigned.
Database-specific MCP tools no longer require the AI Assistant plugin.
A smoother start
Non-modal Welcome screen
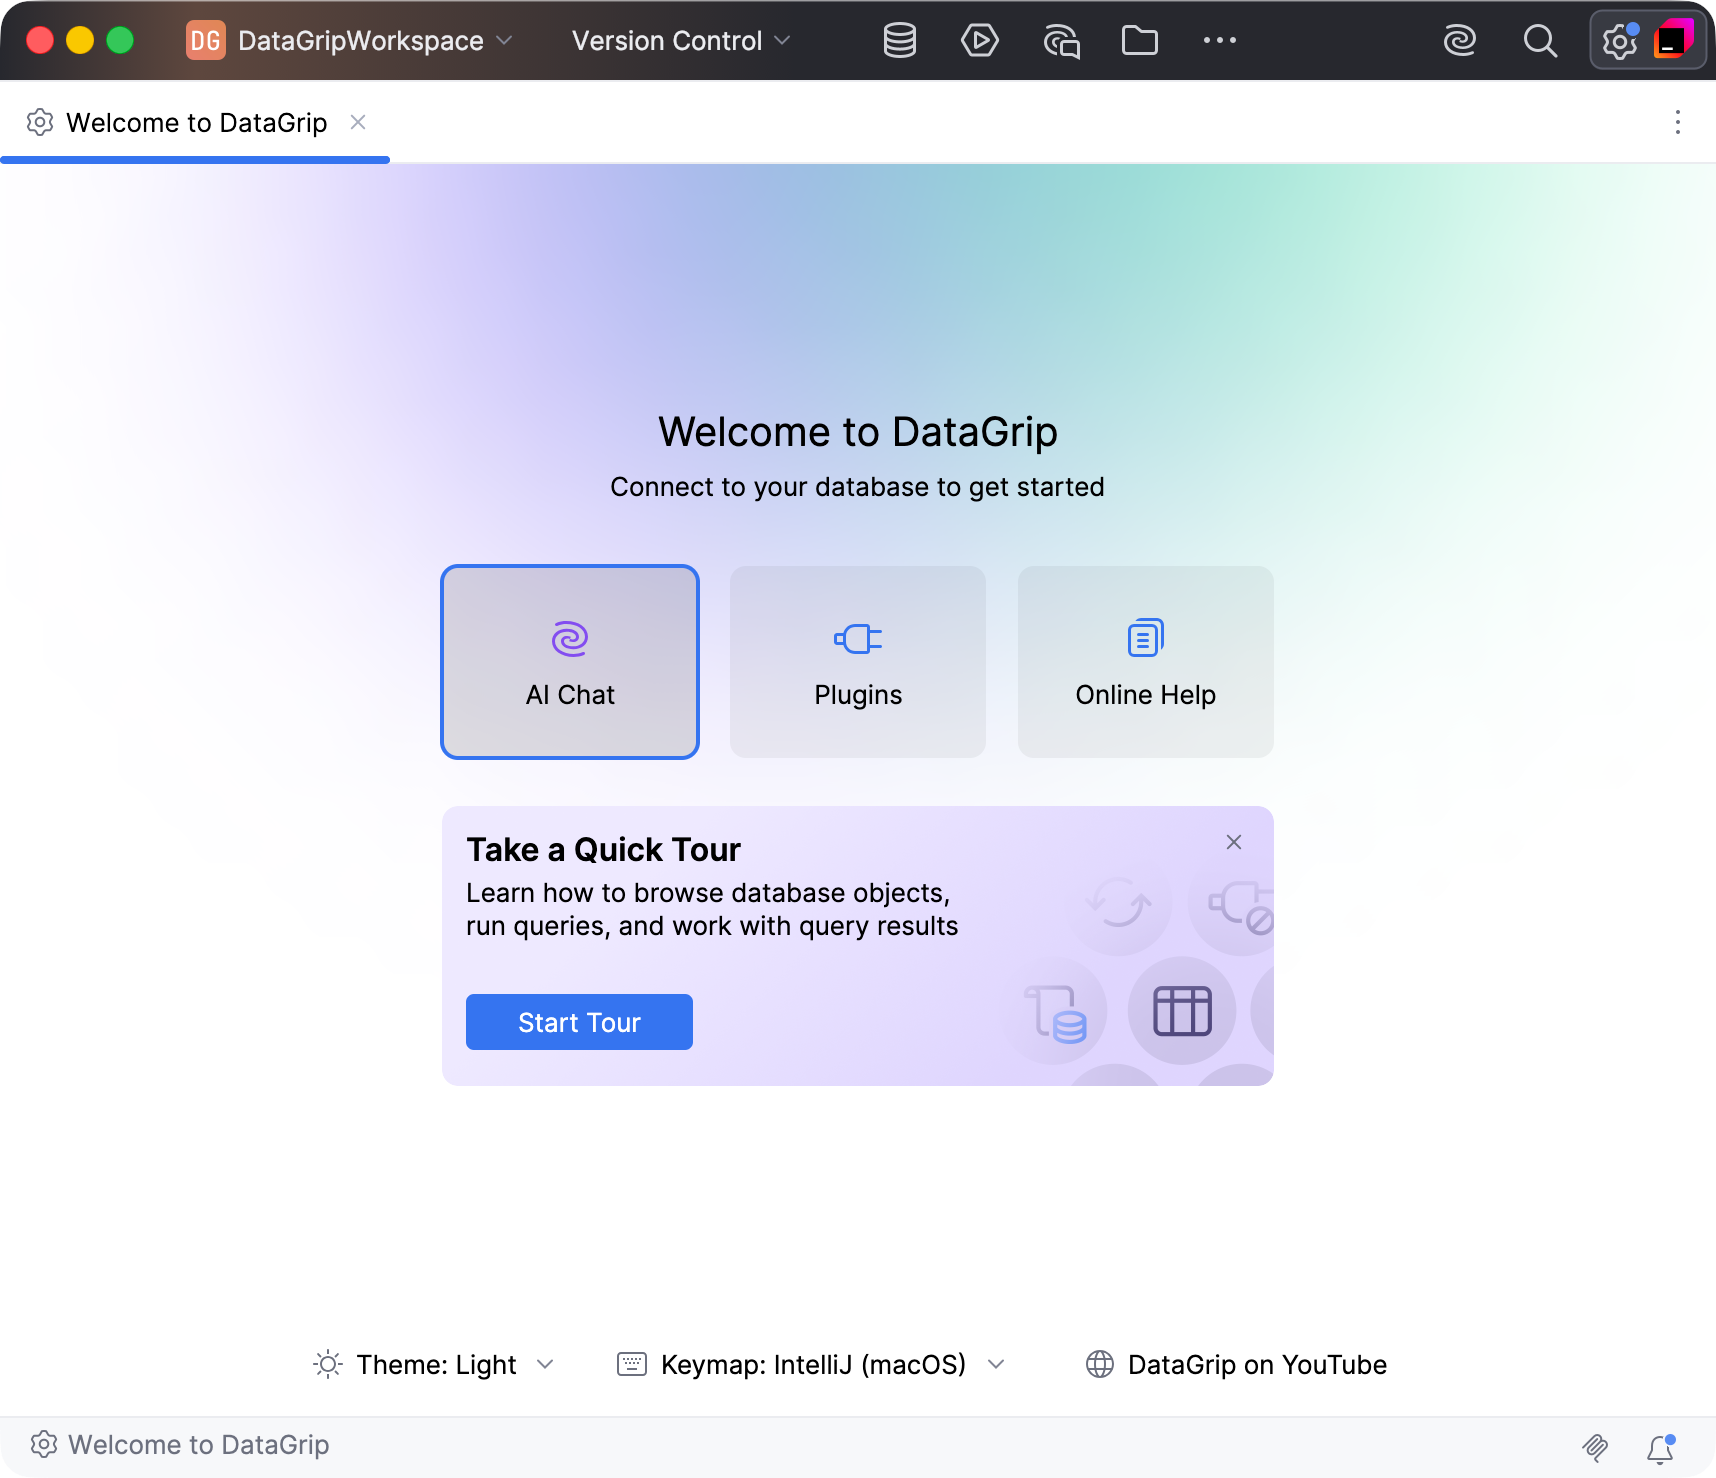
The Welcome screen, which appears when you start DataGrip for the first time or after you close all projects, is now non-modal. This means it appears as a regular IDE tab instead of a modal dialog, so you can continue working with the IDE while using it.
This new Welcome to DataGrip tab opens in the automatically created DataGripWorkspace project. It provides quick actions and useful links to help you get more familiar with the IDE and configure it to suit your needs.
Redesigned empty state in Database Explorer
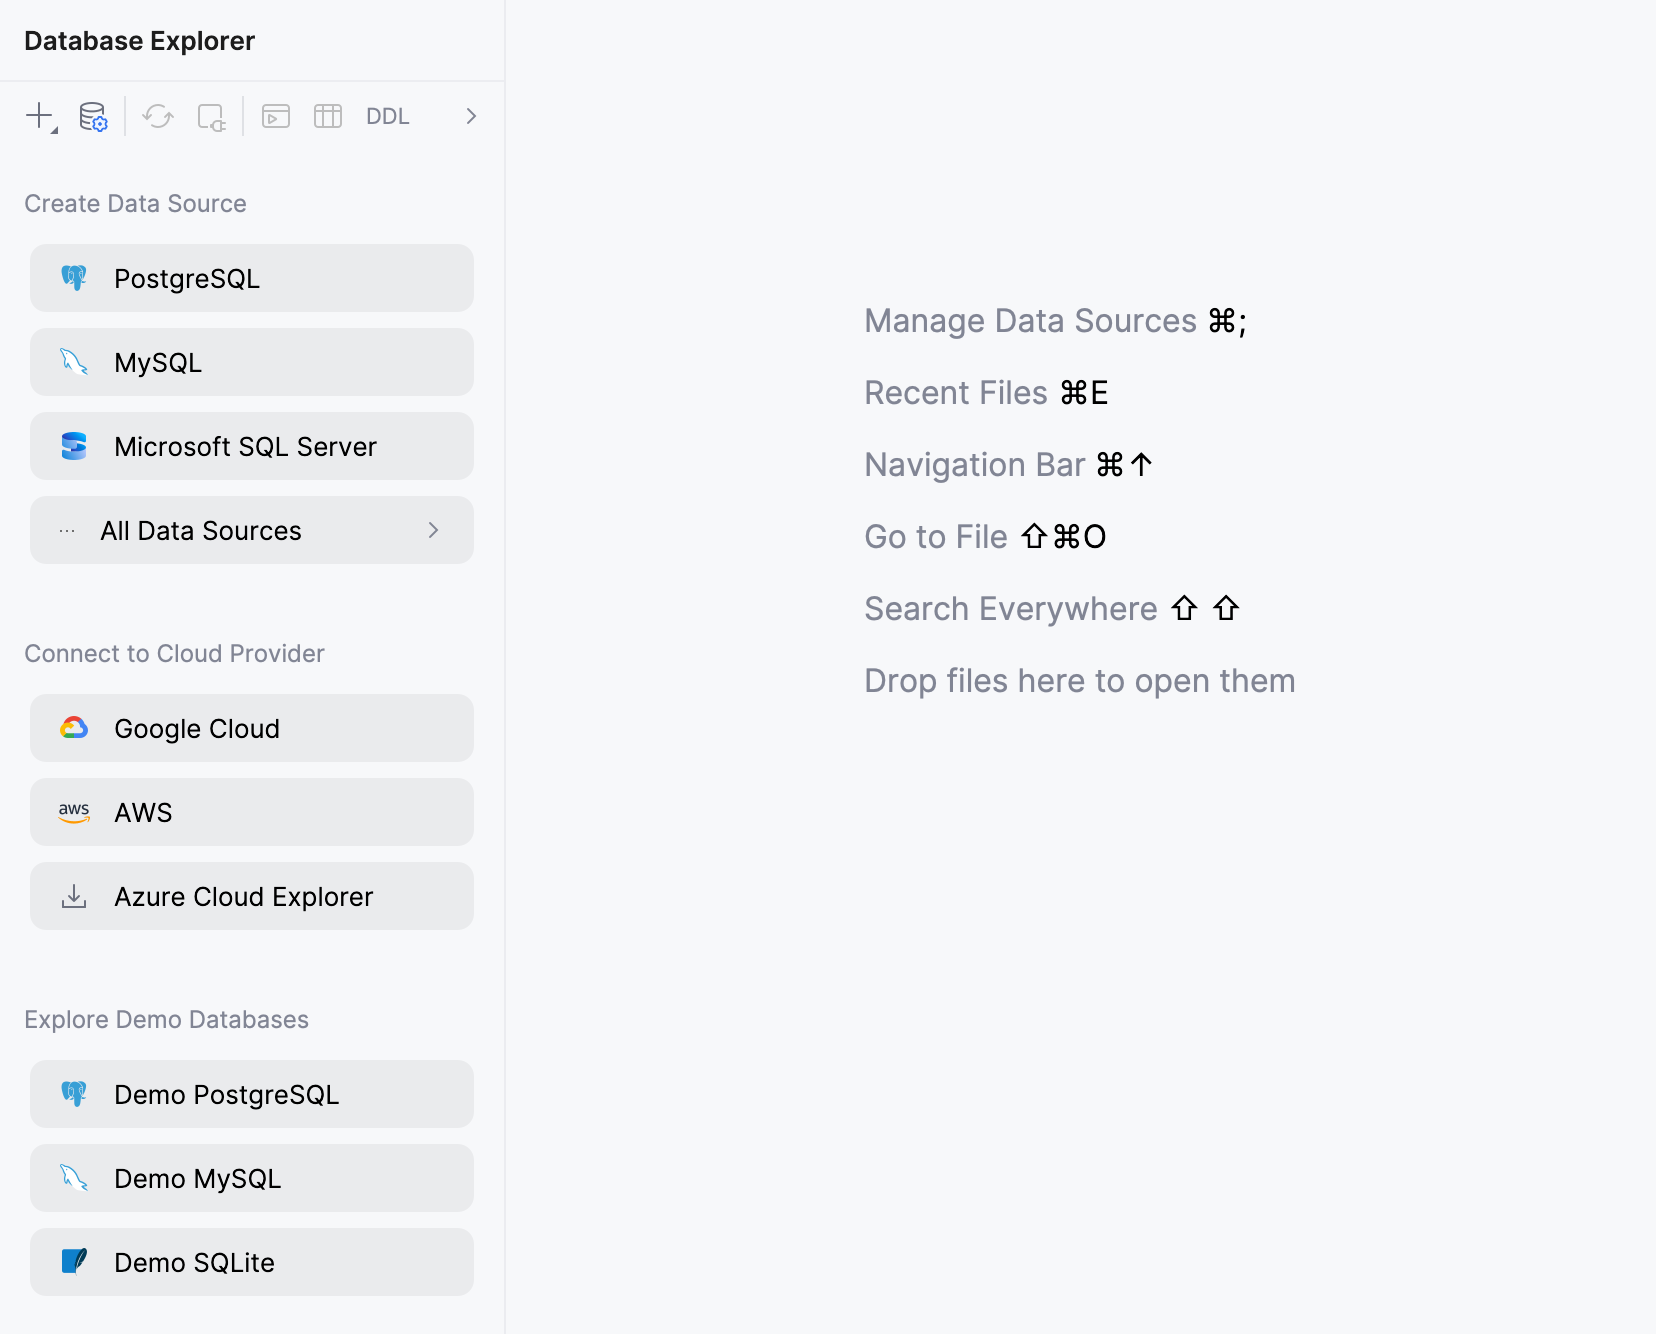
This update also includes a redesigned empty state in our Database Explorer, which offers quick actions to create data sources in a new project. It also provides PostgreSQL, MySQL, and SQLite demo databases used in our Quick start guide that you can connect to and use to get familiar with basic DataGrip features.
Interactive onboarding tour
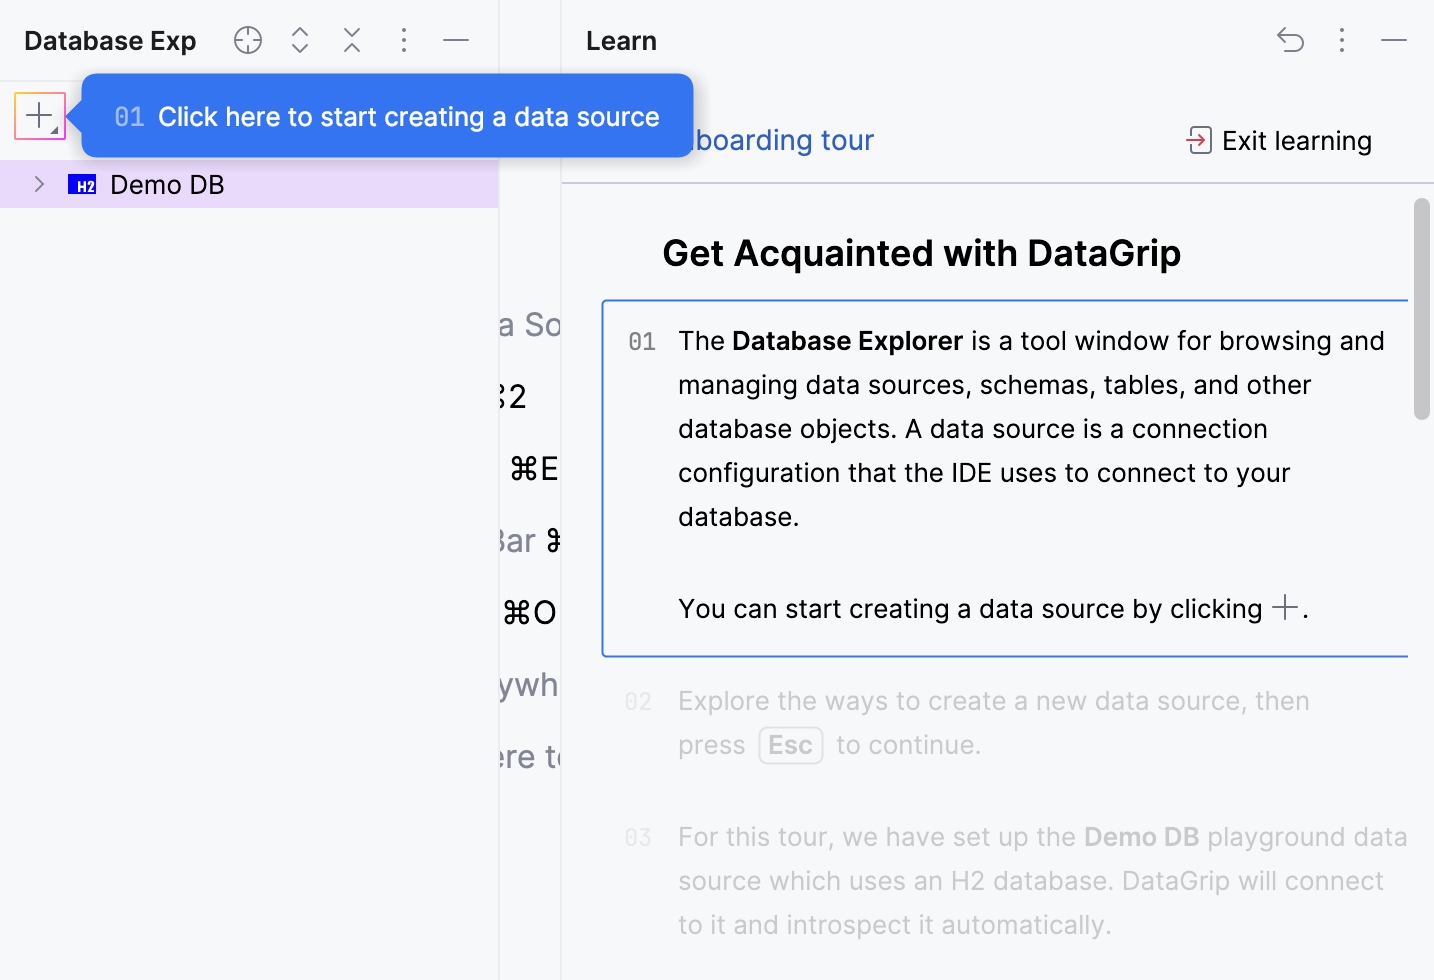
We are introducing an interactive onboarding tour that guides you through DataGrip’s core features. It covers such basics as key actions in Database Explorer, Data Sources and Drivers dialog, query execution in a query console, viewing query results and working with them, and submitting changes to a database.
For demonstration purposes, the tour includes a preset H2 playground data source and a short SQL script that runs against the playground database during one of the steps.
To try the tour, go to in the main menu.
CLI
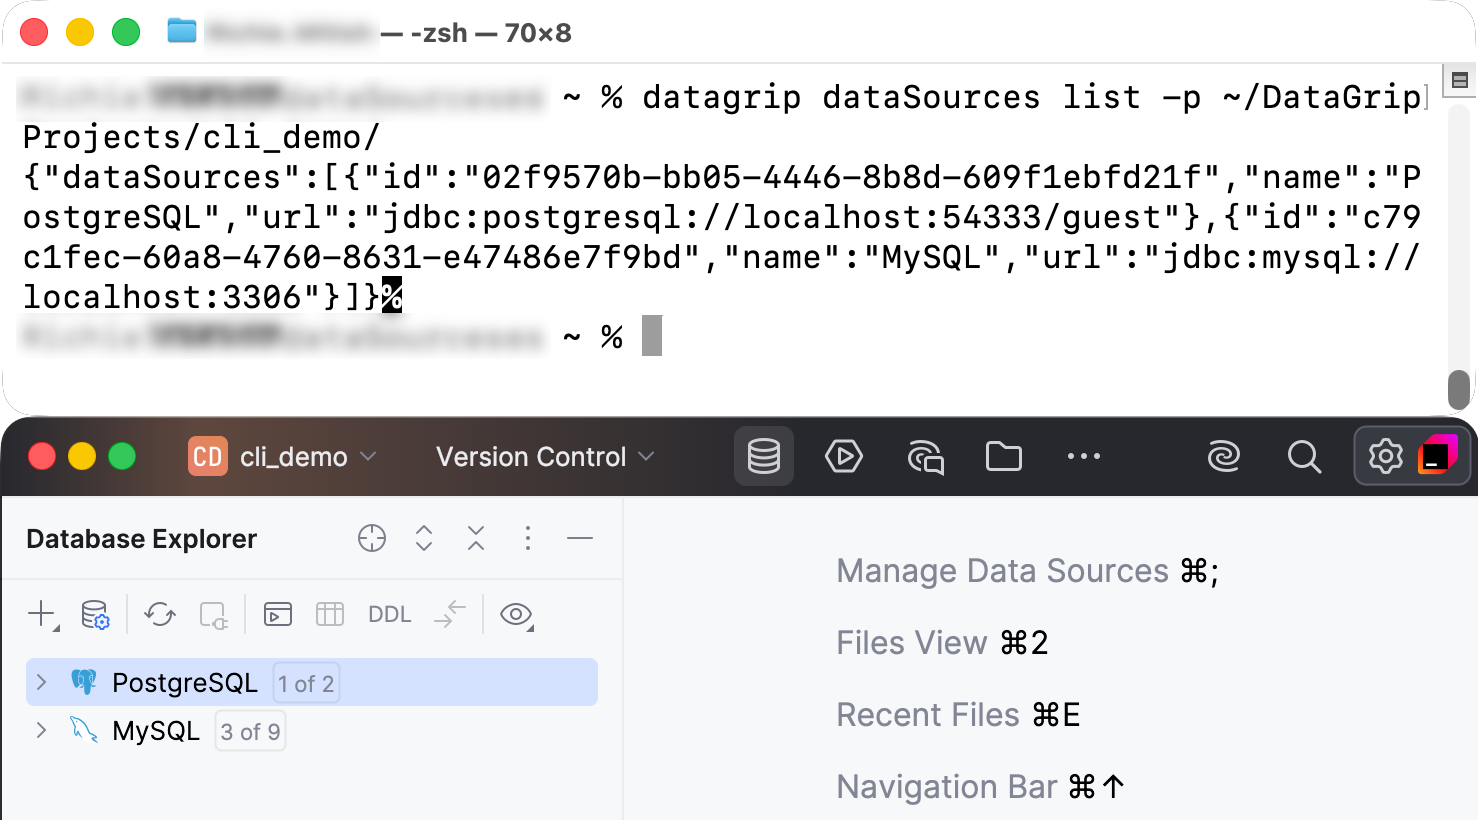
We have introduced command line interface commands that allow you to programmatically manage your database connections and drivers.
- Syntax
- datagrip.exe dataSources <command> [options] [arguments]datagrip dataSources <command> [options] [arguments]datagrip.sh dataSources <command> [options] [arguments]
Available commands: list and manage.
The new CLI uses a batch processing approach. Instead of running one command per action, you can pass a JSON file containing multiple instructions. The tool processes them in a single session and returns the results in JSON, making it perfect for shell pipelines.
Working with data
SQL expressions in the data editor
You can now set cell values using SQL expressions instead of being limited to literal values.
Previously, when editing data in the grid, you could only enter static values or use the context menu to set a cell to NULL or its DEFAULT value. If you wanted to use a database function like NOW() or gen_random_uuid(), or perform a calculation, you had to manually write and execute an UPDATE statement in the console.
With this update, we are introducing a new Expression mode in the data editor. When editing a cell, you can now right-click it and choose Edit as SQL Expression, or enable Expression mode using  SQL Expression Mode on the Value editor toolbar.
Enter any valid SQL expression, and DataGrip will use the result as the new cell value. When you submit the changes, the IDE incorporates your expression directly into the generated UPDATE or INSERT statement without escaping it as a string.
You can now use SQL expressions when editing multiple cells, too.
Connectivity
Two-session mode
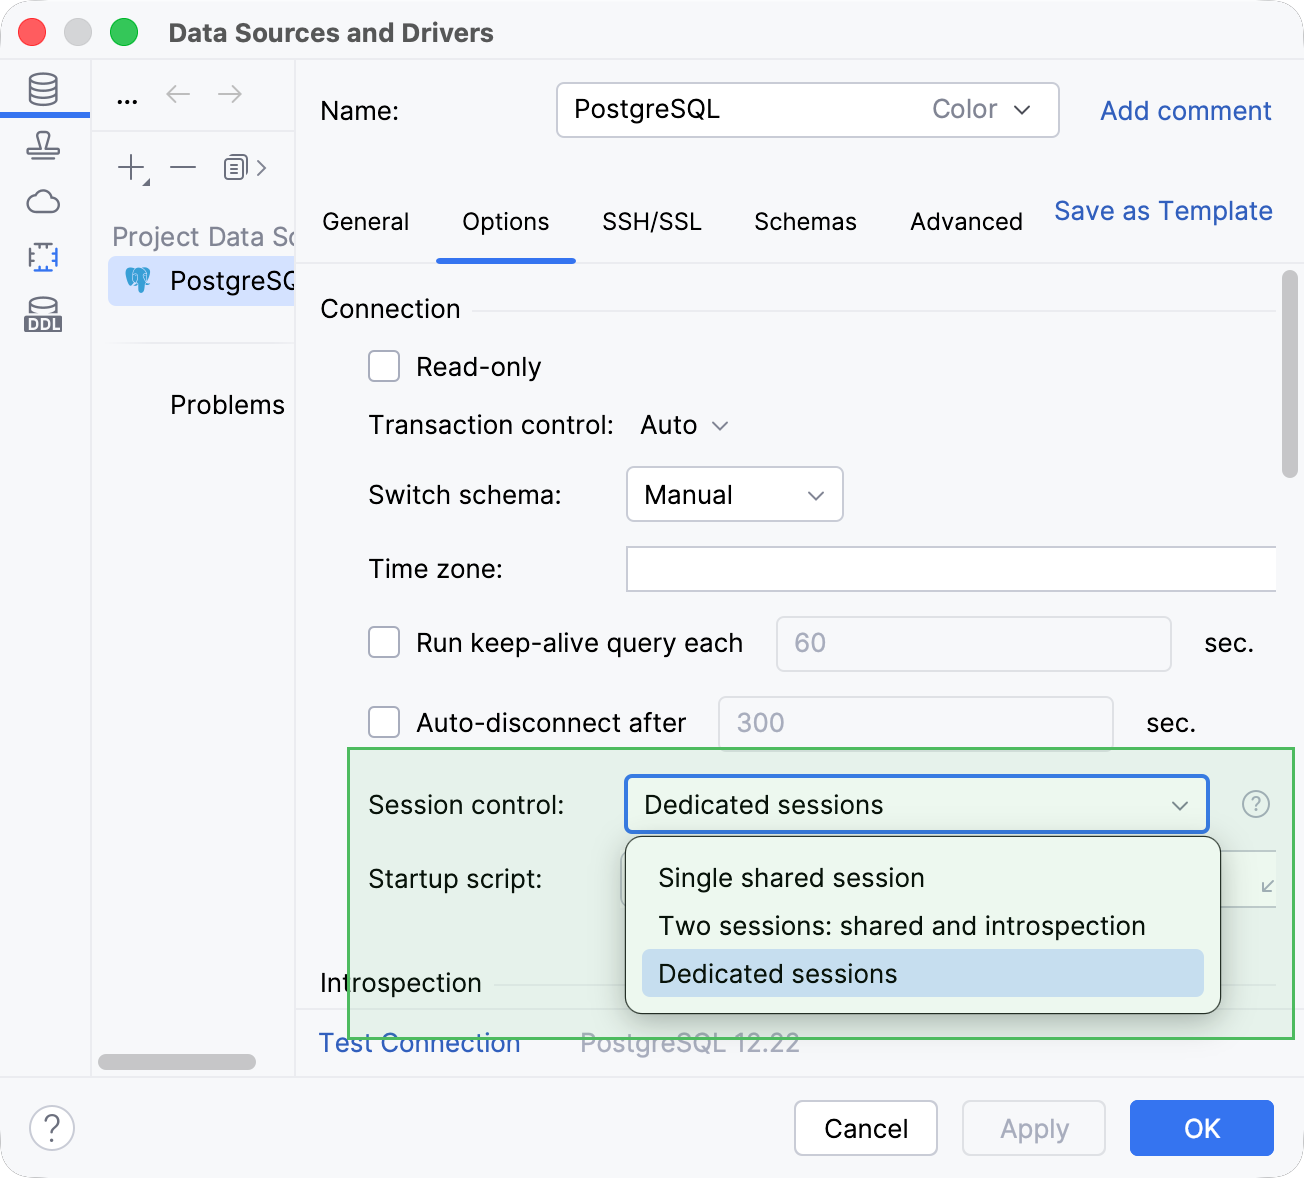
Starting from this release, we are adding a new mode for session management, Two sessions: shared and introspection, in addition to the existing Single shared session (previously, Single session mode) and Dedicated sessions (previously, default behavior) modes.
Before, there were two separate modes:
Default: Each new client, such as a query console or data editor, creates a new connection to the database.
Single session mode: Every time you work with a data source, you use one and only one connection. It can be turned on by selecting the Single session mode checkbox.
Single session mode exists to support scenarios where you want to share a single connection across multiple clients. However, this may be inconvenient because the same session is used by database introspection – the process of retrieving metadata.
That's why the new mode creates two sessions: one for introspection and the other for everything else.
Bundled JDBC drivers
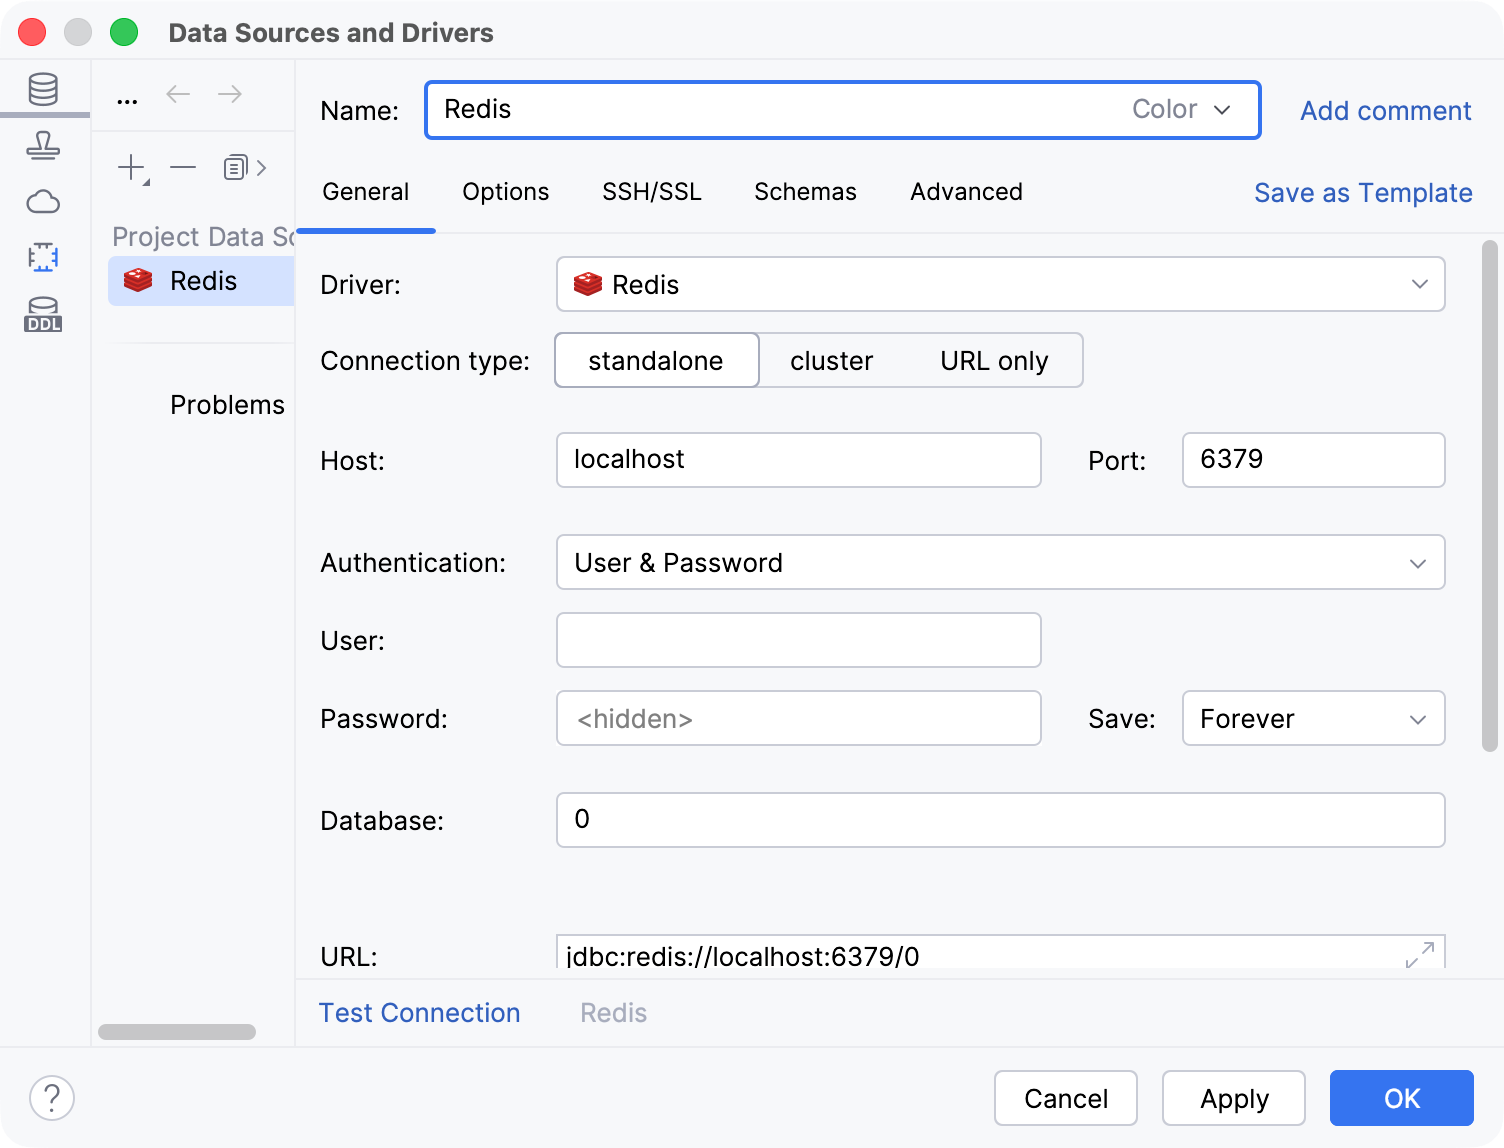
Previously, DataGrip did not include any JDBC drivers. Now, the following JDBC drivers are bundled in DataGrip:
Microsoft SQL Server ver. 13.2.1
MongoDB ver. 1.21
MySQL ConnectorJ ver. 9.5.0
PostgreSQL ver. 42.7.3
Redis ver. 1.6
To learn more about using JDBC drivers in DataGrip, refer to JDBC drivers.
The Explain Plan raw format actions are back
In the previous release, we simplified the Explain Plan dropdown by removing the Explain Plan (Raw) and Explain Analyse (Raw) actions. This change affected workflows that regularly require these actions. In this release, we have addressed your feedback by bringing back the actions and making them accessible from the toolbar.
We have added the Raw button to the left toolbar of the Query Plan tab.
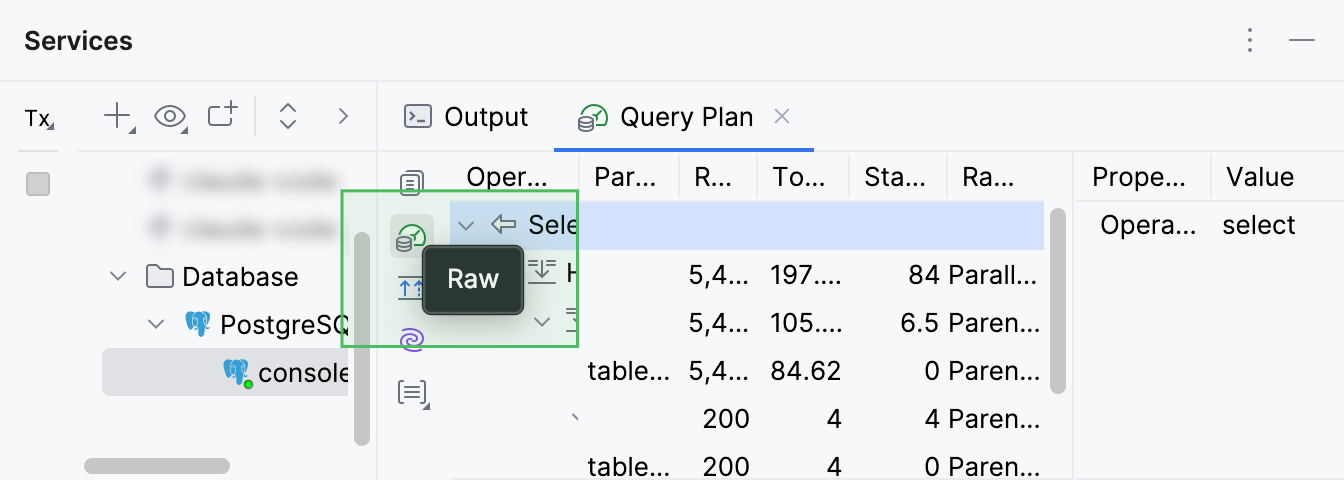
For the execution plan tree, the button opens the raw execution plan in the Raw inner tab. The plan tree also remains available in the Operations Tree inner tab.
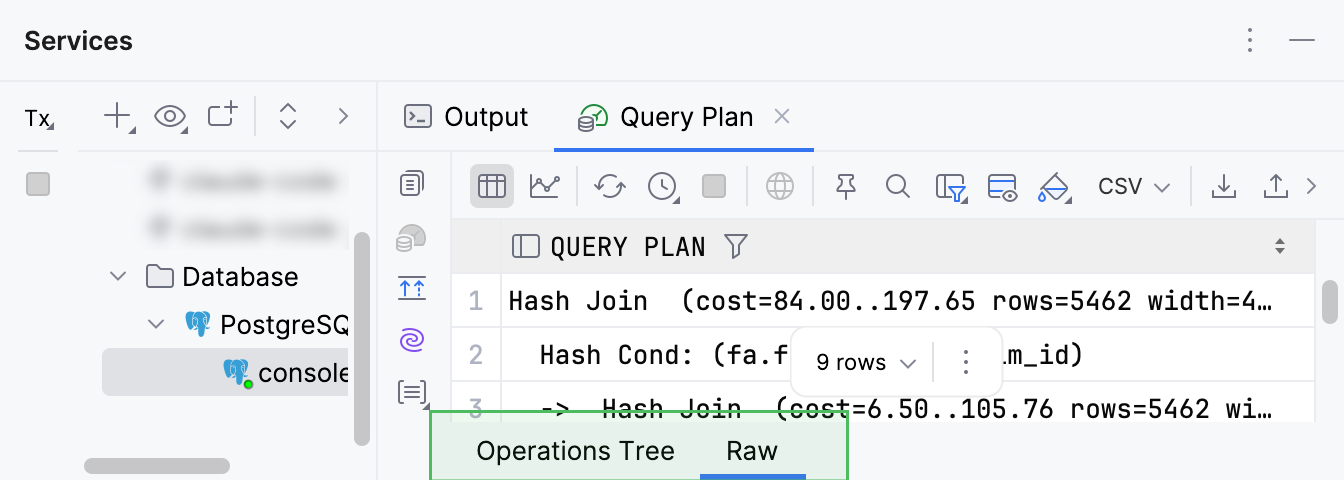
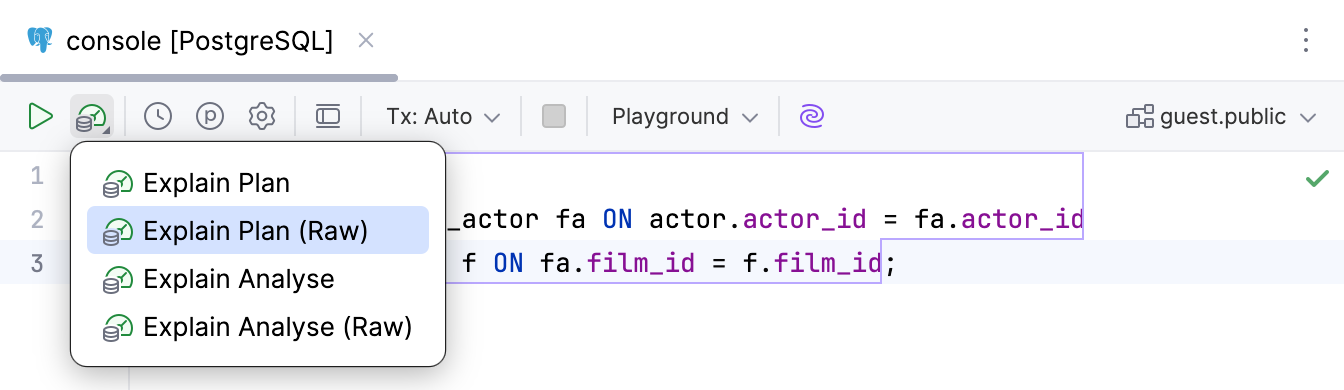
We have brought back the Explain Plan (Raw) and Explain Analyse (Raw) actions. To have them in the Explain Plan dropdown, go to , select Explain Plan, and click Add. Then, select the actions from the list and click OK.
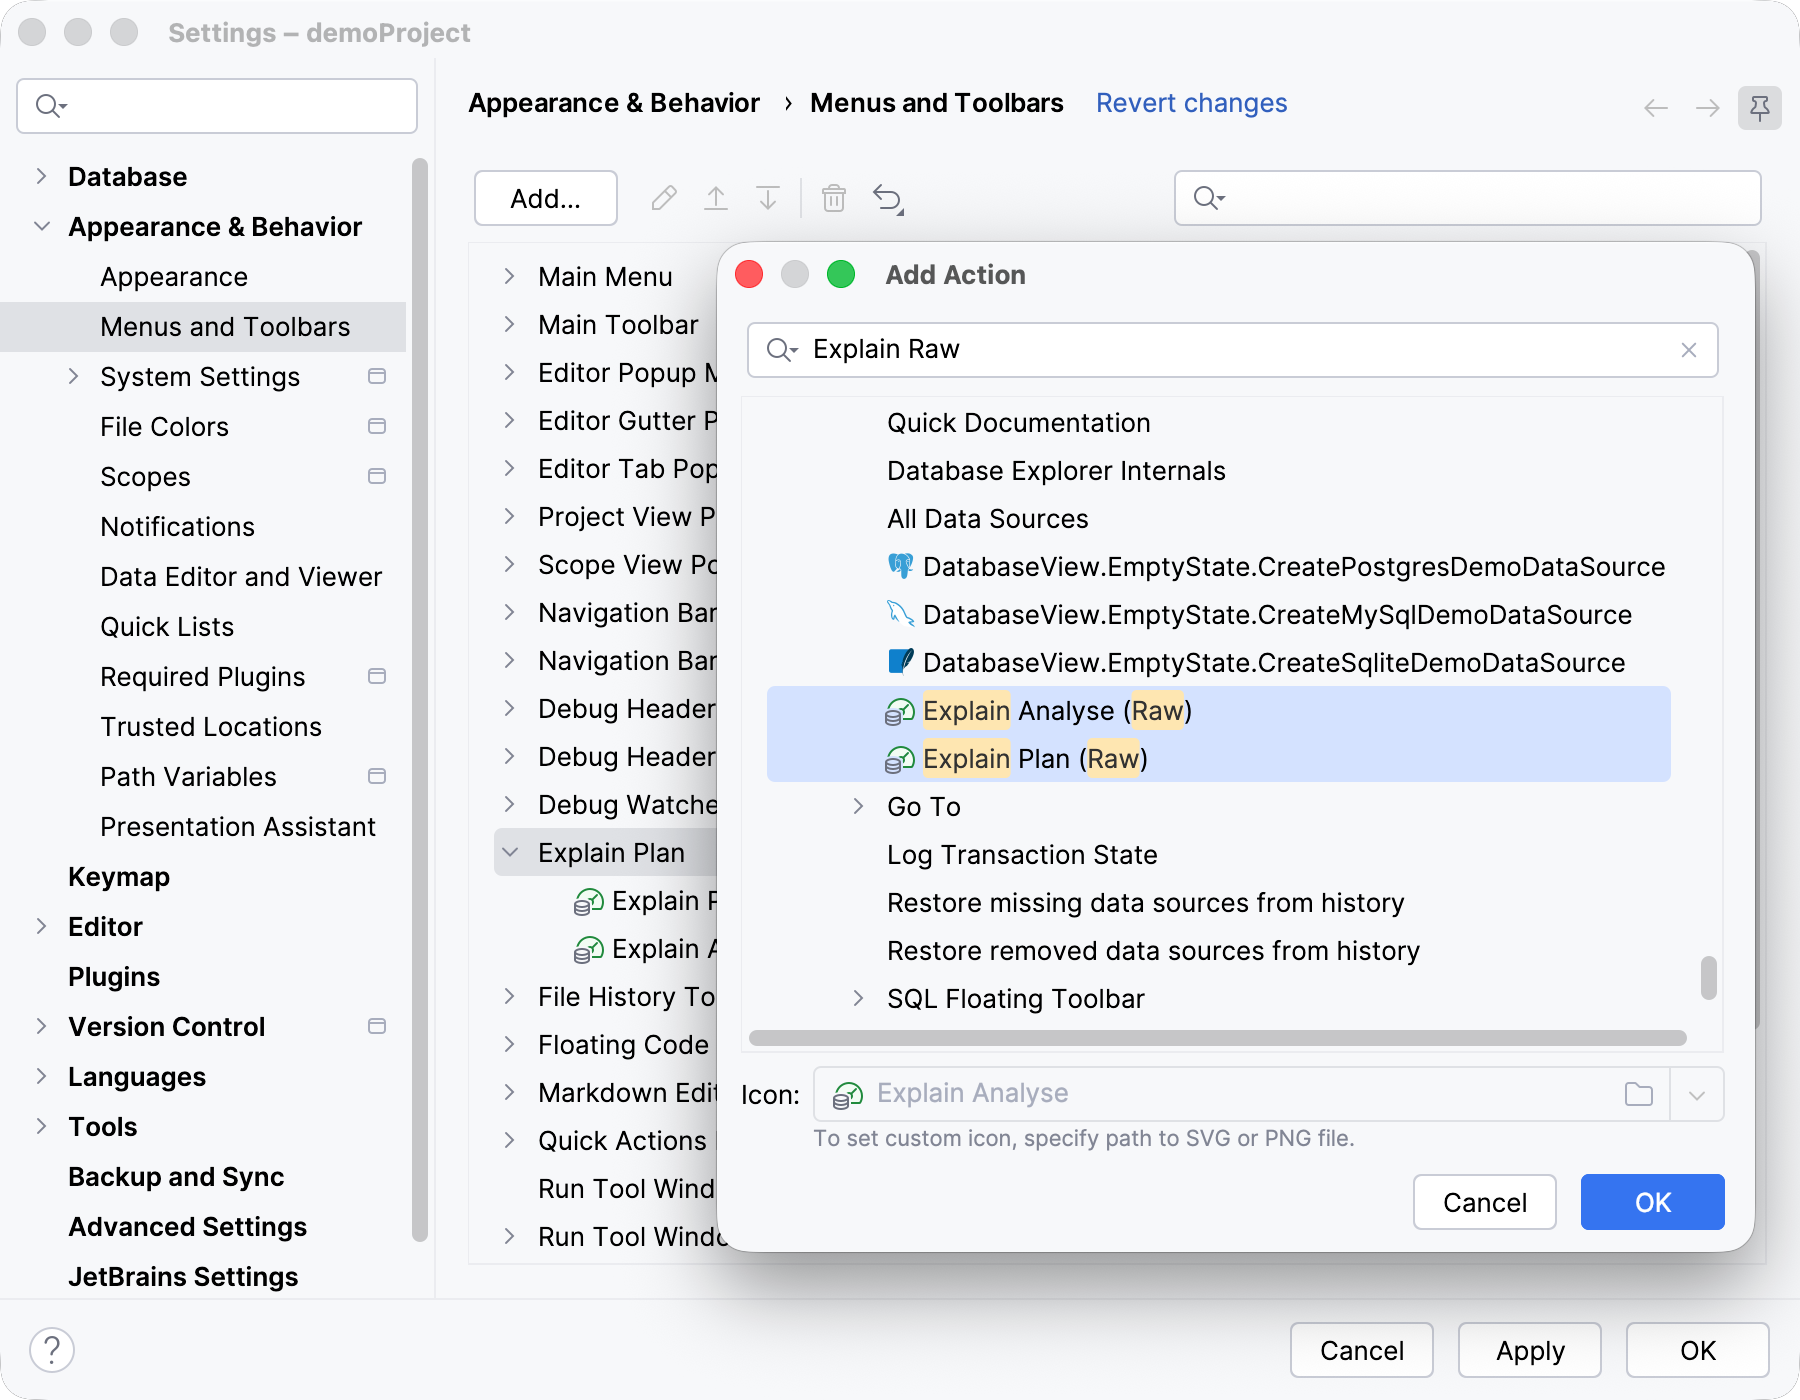
Place the actions in your preferred order. They will then appear in the Explain Plan dropdown.
When you open an execution plan in raw format by using Explain Plan (Raw), the plan opens in the Query Plan tab, too. For this format, the toolbar on the left side of the tab has the Show Tree button instead of Raw.
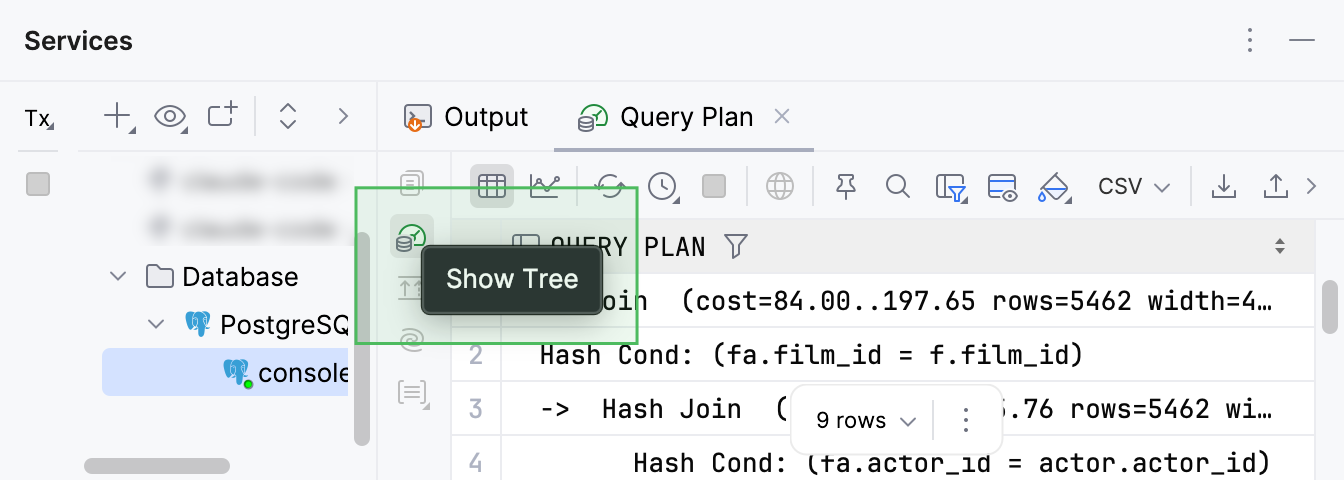
This button opens the Operations Tree inner tab with the execution plan tree. The raw plan remains available in the Raw tab.
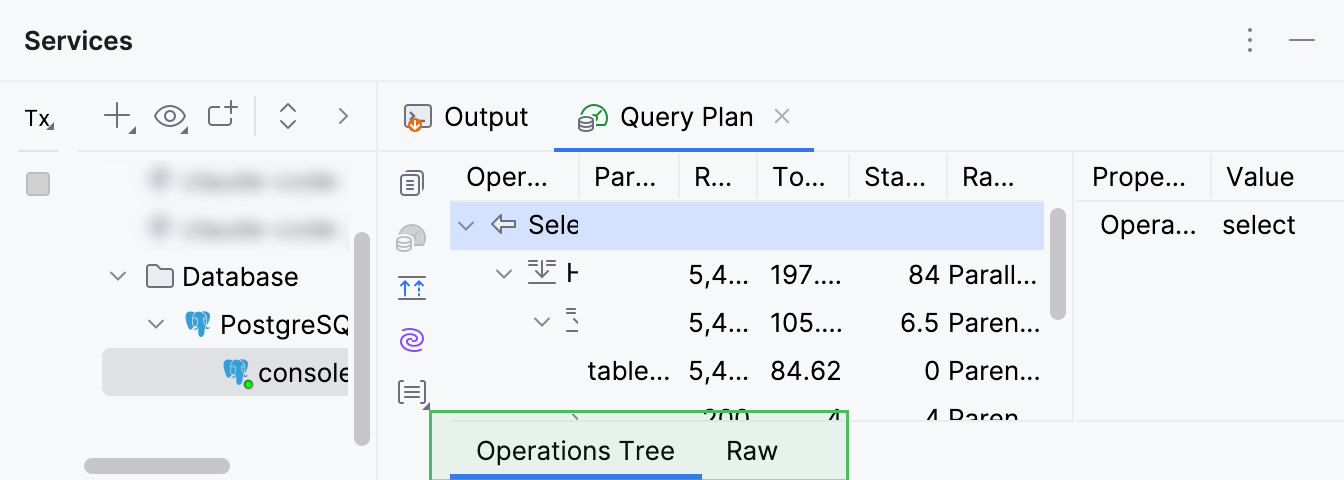
If you use Explain Plan and Explain Plan (Raw) actions on the same query, DataGrip opens the corresponding inner tabs next to each other in the Query Plan tab.
Query files and consoles
Custom query console names in editor tab headers
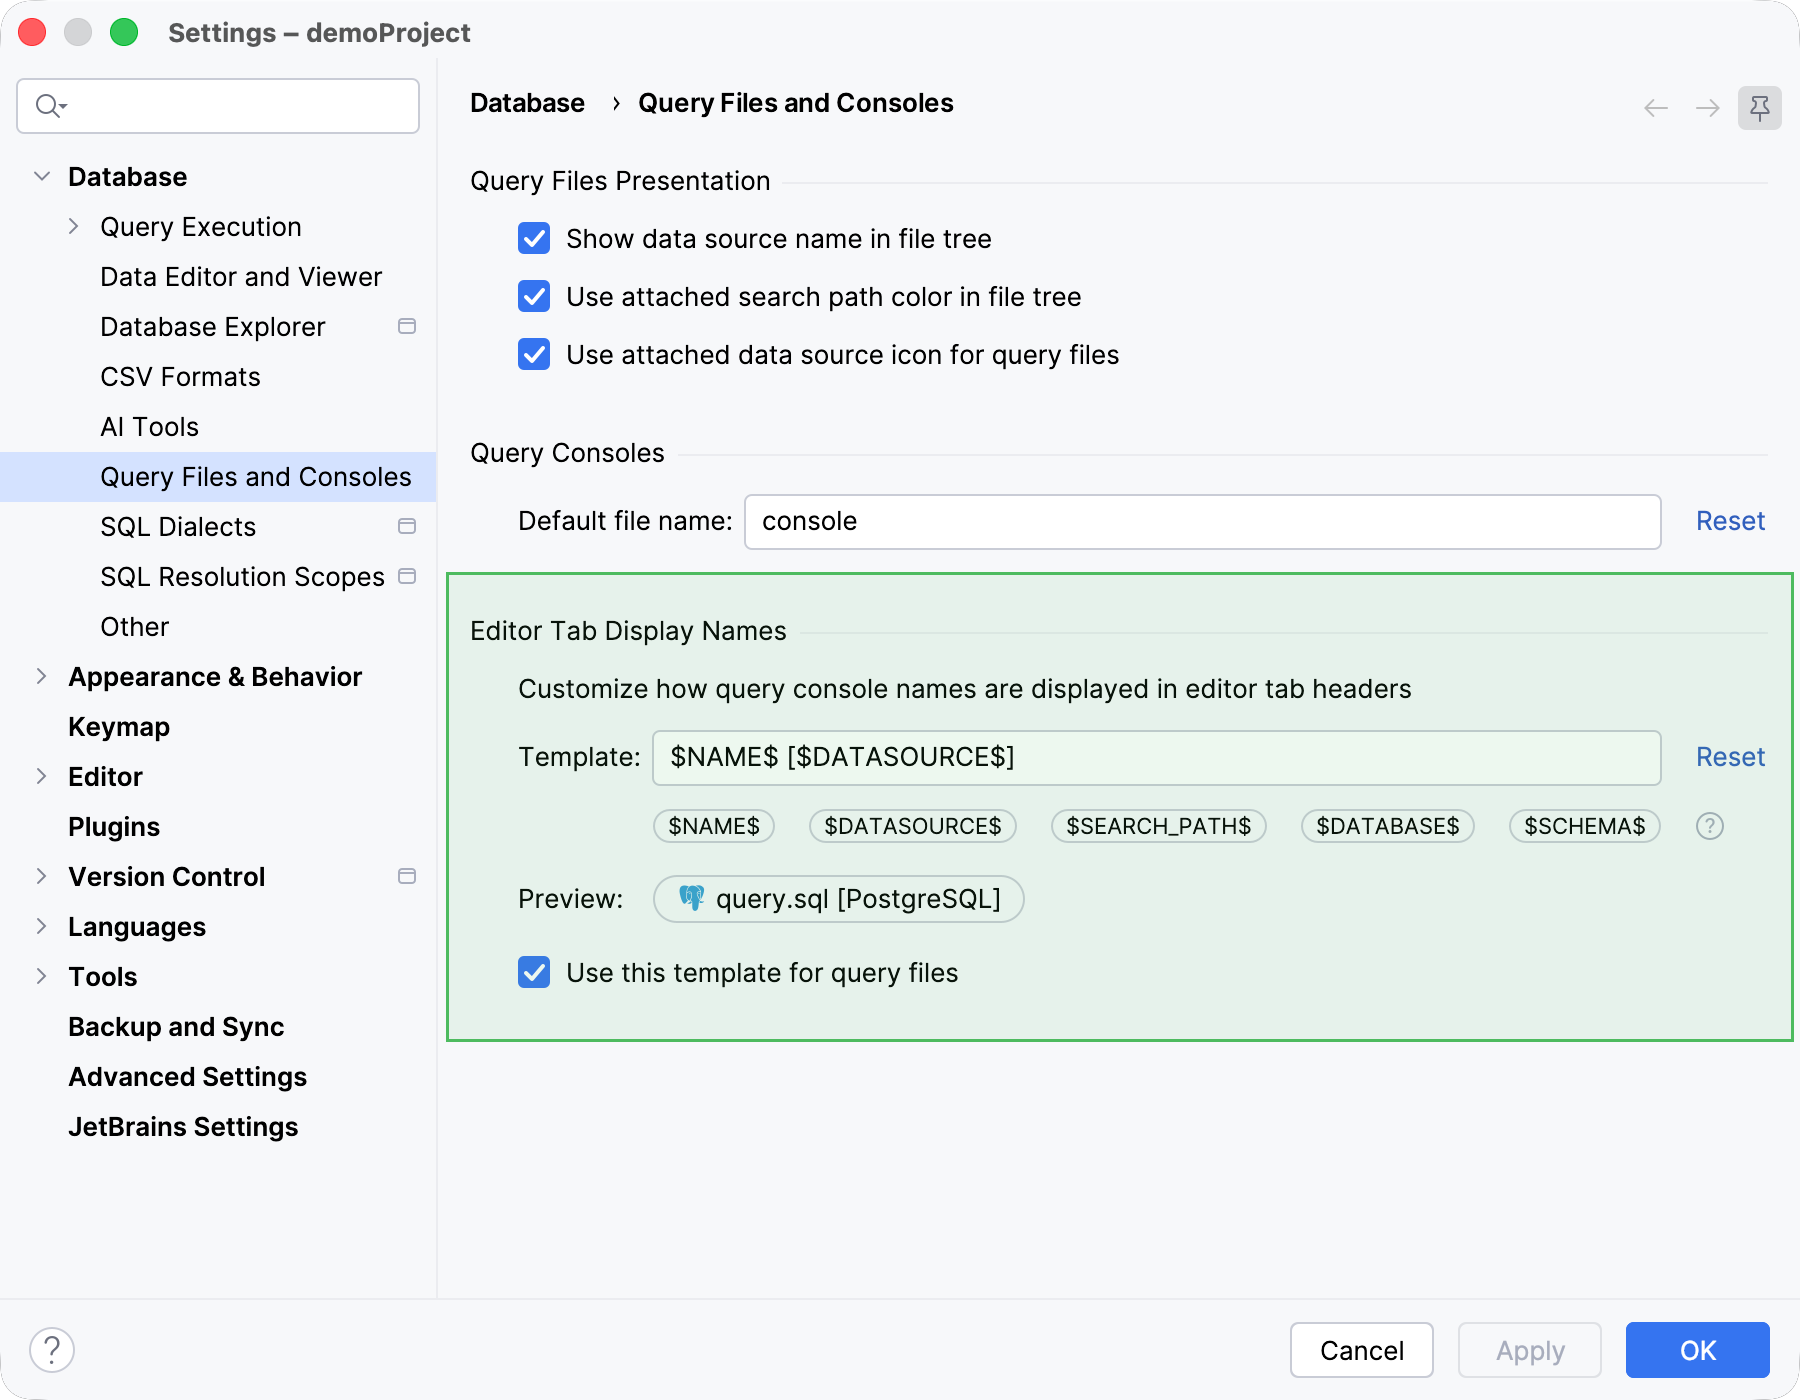
You can now customize how query console names are displayed in editor tab headers – the first place you look when identifying an open file. The customization settings are located in .
Previously, only the data source name was displayed next to the file name. Now, you can use variables to add more details, such as the attached data source, database, schema, or search path. To use a variable, place the caret where you want to insert it in the Template field and click the corresponding variable button.
If you’d like to use this template for query files, too, select Use this template for query files.
Code editor
[Snowflake] Role and warehouse dropdown
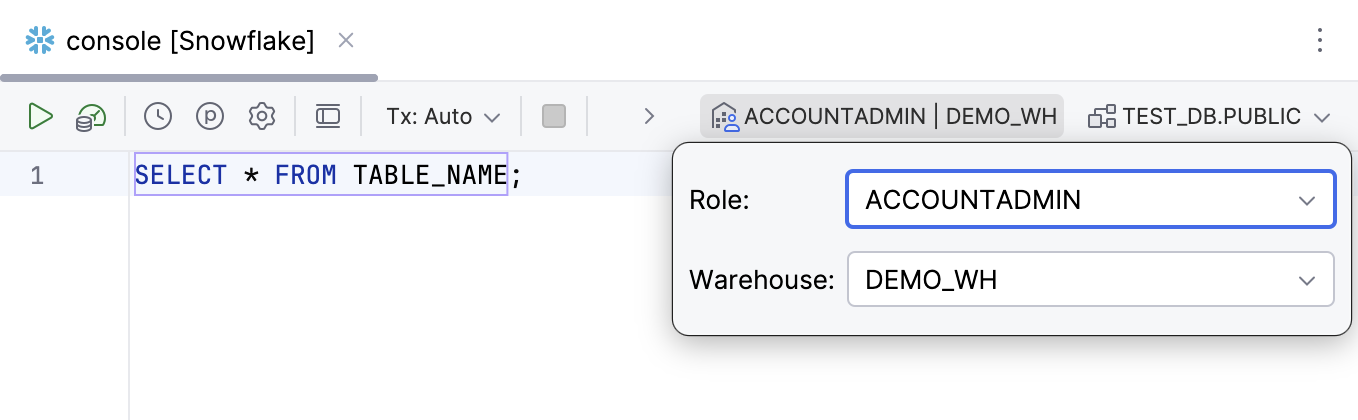
When working in Snowflake, you no longer need to manually execute SET ROLE commands or configure it in connection settings to change your permissions for the current session.
A new dropdown in the query console toolbar lets you swap between available roles and warehouses instantly.
Database Explorer
Reworked database colors
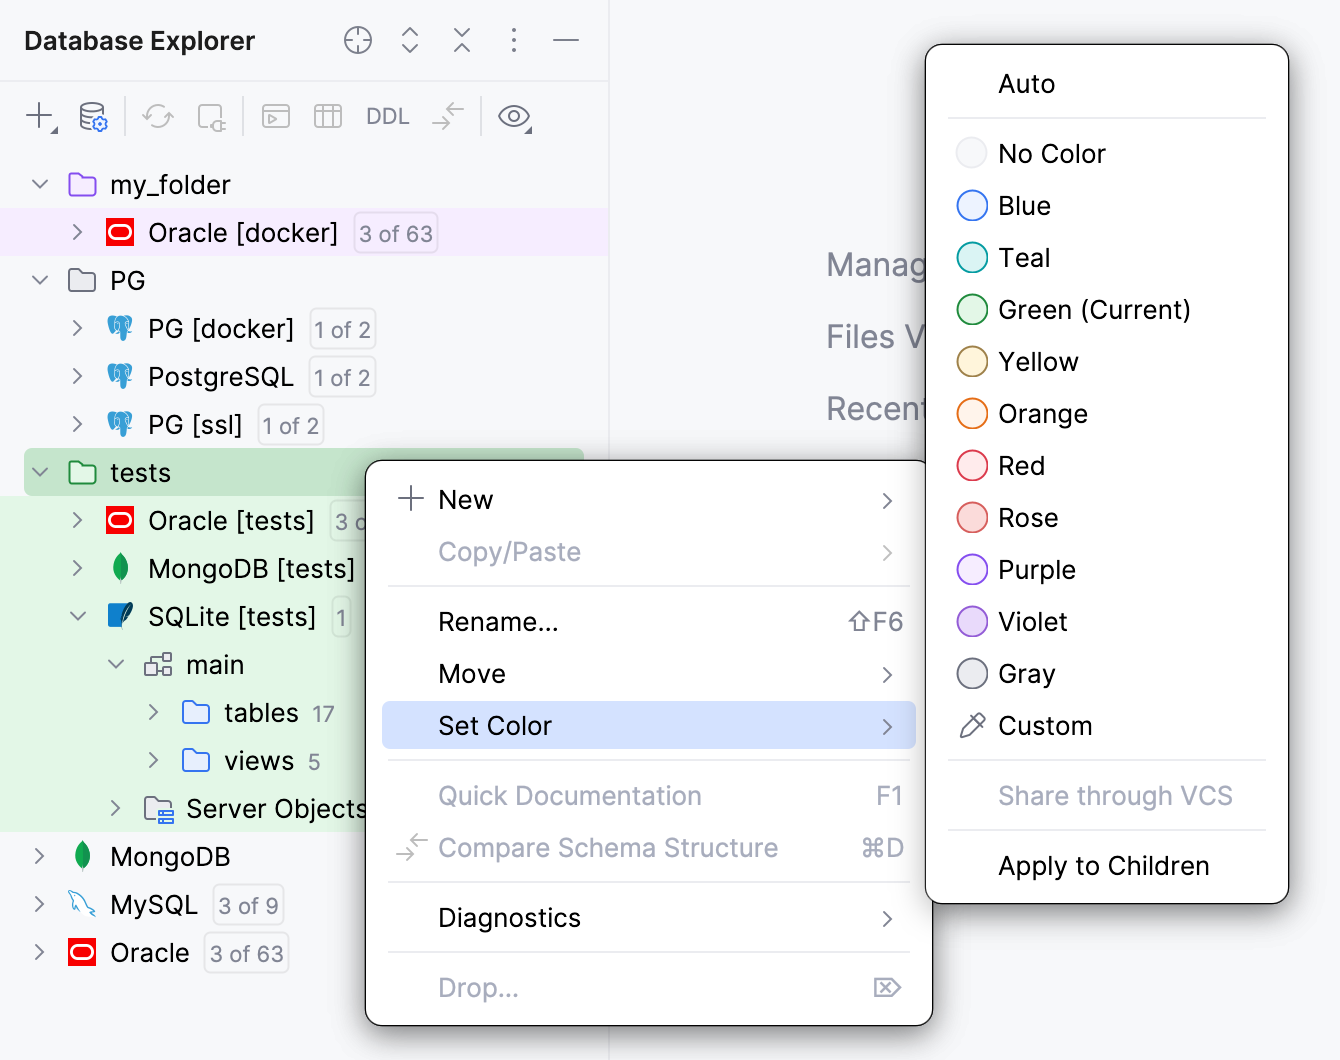
We've completely reworked the colors system. The updates are as follows:
The UI has been improved and it is now consistent.
Custom colors now work differently. Before, the fixed
#RRGGBBhex code looked the same across all IDE themes, meaning it only looked right in either the light or the dark theme, but not both. Now, you can set the Hue, and the system makes the shades automatically.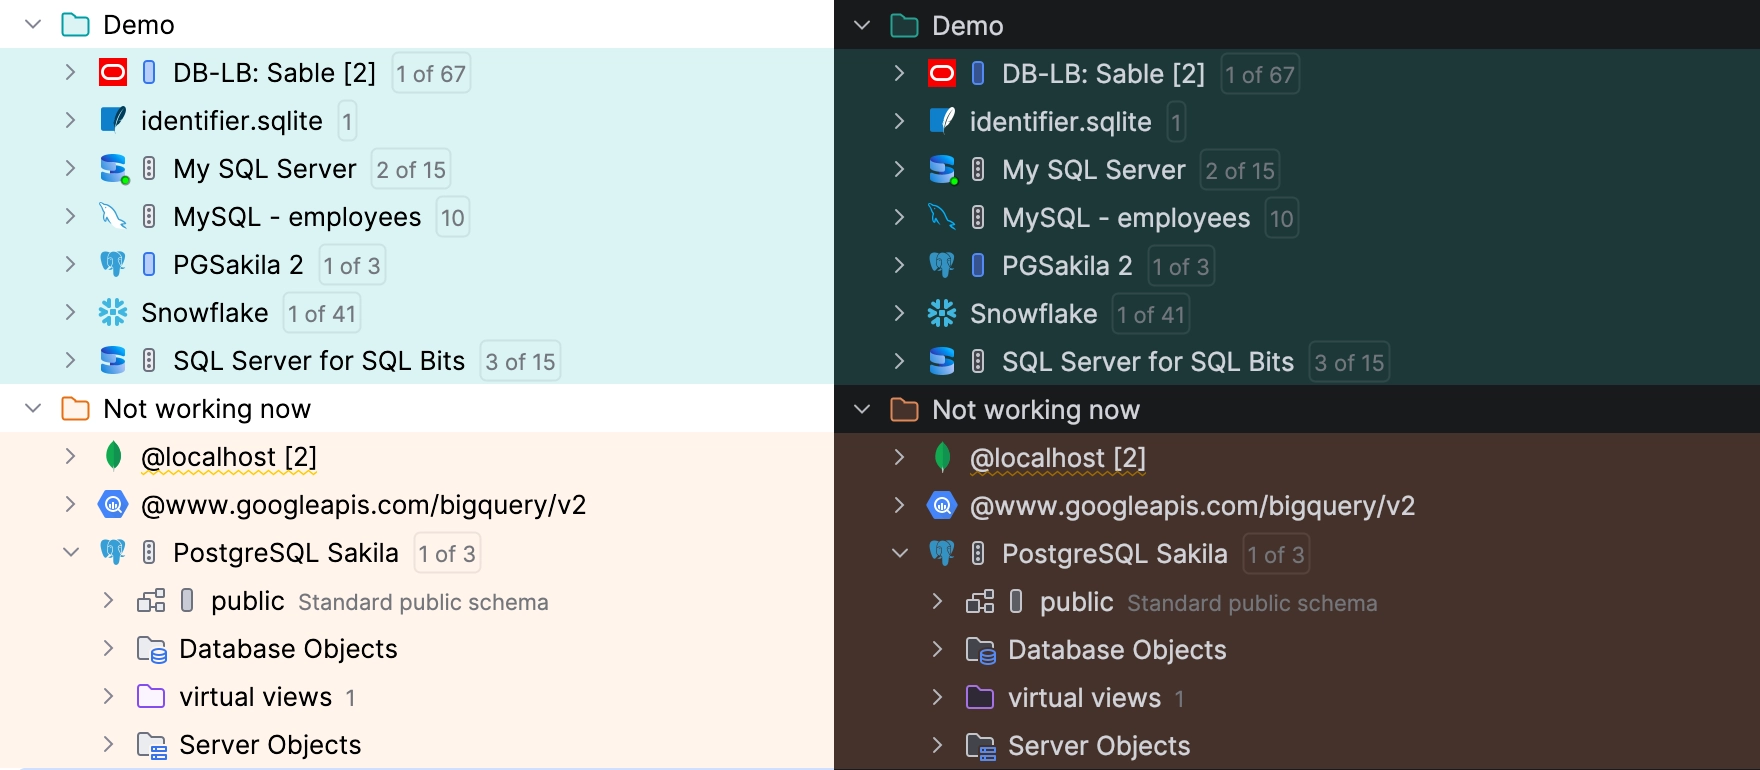
Custom colors are available for folders, as well.
For better discoverability, the submenu has been moved up a level.
We have moved the color settings from the old dialog popup to the main Settings dialog under .
Group schema objects by prefix
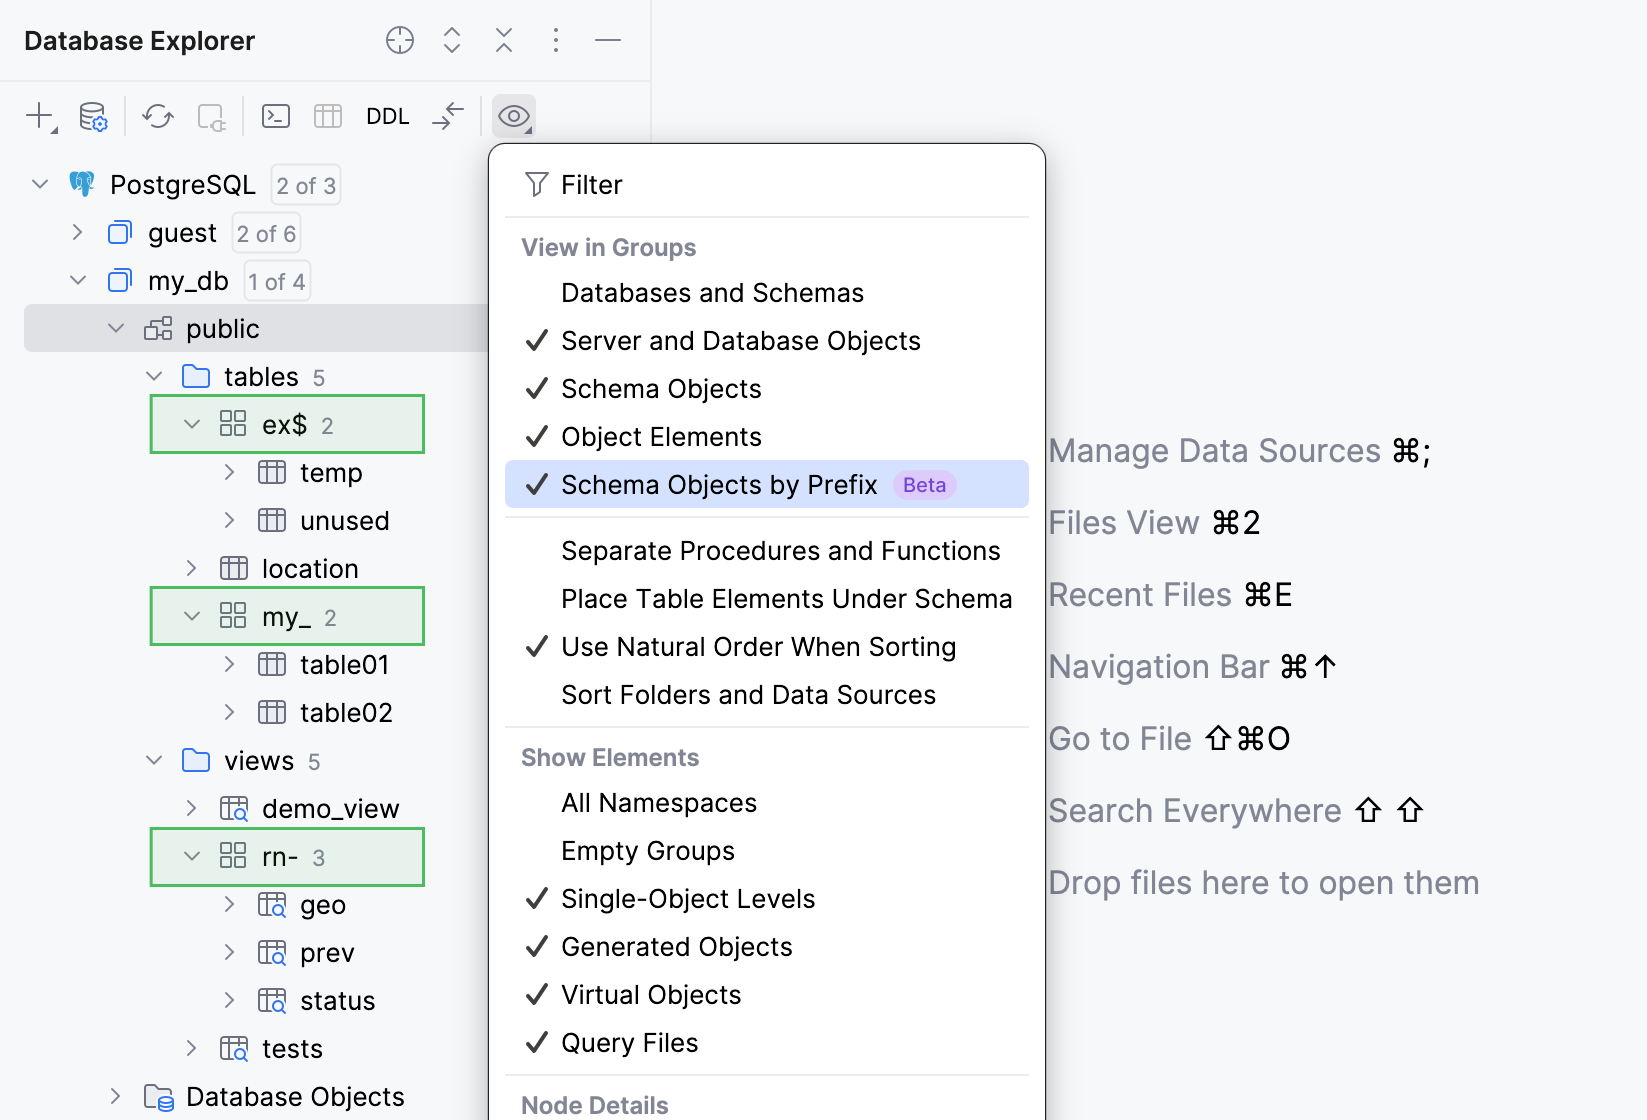
Database Explorer now allows grouping schema objects by prefix in the tree. The following characters are treated as prefix delimiters: _, -, and $. For example, my_table01 and my_table02 are grouped under my_ and their names are displayed as table01 and table02 within the group.
To enable this option, click View Options on the tool window toolbar and select Schema Objects by Prefix.
Deletion of folders and their contents
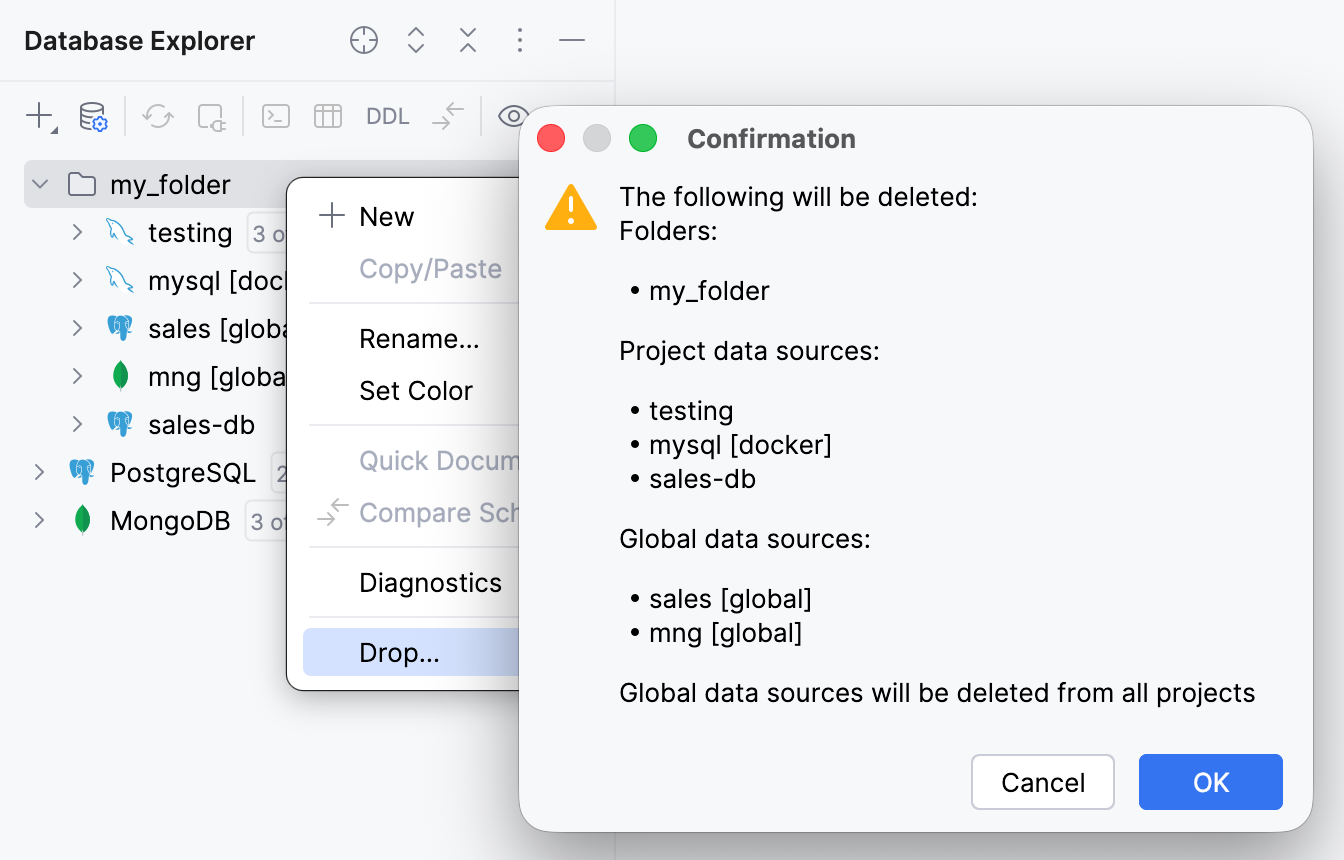
Previously, deleting non-empty folders was not supported. Now, you can delete folders that contain other folders or data sources.
Before deleting a folder, DataGrip will ask for confirmation and display the list of items to be deleted.
Improved support for ClickHouse and Snowflake SQL
ClickHouse SQL support received the following additions:
Query parameter syntax.
Additional
SYSTEMstatements.The
FIRSTclause inALTER TABLE ADD COLUMNstatements.
Other enhancements include:
Improved support for
ORDER BY... WITH FILL STEP.Fixes for false syntax errors related to projection indexes.
For Snowflake, we've added support for:
Flow operations.
DATABASE ROLEsyntax.HASHfunctions, includingHASH(*).INTERSECT,UNION BY NAME, andDISTINCTinSELECTstatements.Object, session, and user parameters in
ALTER USERstatements.