PHP
You can extend IntelliJ IDEA Ultimate with the PHP development functionality by installing the PHP plugin. The plugin implements all the features of PhpStorm, the standalone IDE for PHP developers. For more information about the supported features, refer to PhpStorm documentation.
Work with PHP projects in IntelliJ IDEA
Configure PHP environment
The PHP development environment includes a PHP engine, a web server, and a database server—the so-called AMP (Apache, MySQL, PHP) technology stack that can be installed as a preconfigured package (like XAMPP or MAMP) or separate components to the local or remote operating system, in a virtual machine, or in a Docker container.
IntelliJ IDEA integrates with your PHP development environment for running, debugging, or unit testing the applications opened in the IDE.
To integrate your development environment with IntelliJ IDEA:
Integrate your PHP engine with IntelliJ IDEA as described in Configure local PHP interpreters or Configure remote PHP interpreters.
Set connection between IntelliJ IDEA and your web server as described in Connect to a web server.
Integrate your database server with IntelliJ IDEA as described in Create a data source.
Set up a debugging engine as described in Debugging: Ultimate Guide.
Open or create a PHP project
You can open or clone an existing PHP project in IntelliJ IDEA or create a new one. To create a PHP project:
Go to or on the Welcome screen, click New Project.
In the New Project dialog that opens:
Provide the name of the new project folder and the path to it.
Select PHP as the project type.
Select the Add 'composer.json' checkbox to automatically create a
composer.jsonfile for project dependencies.
Code with smart assistance
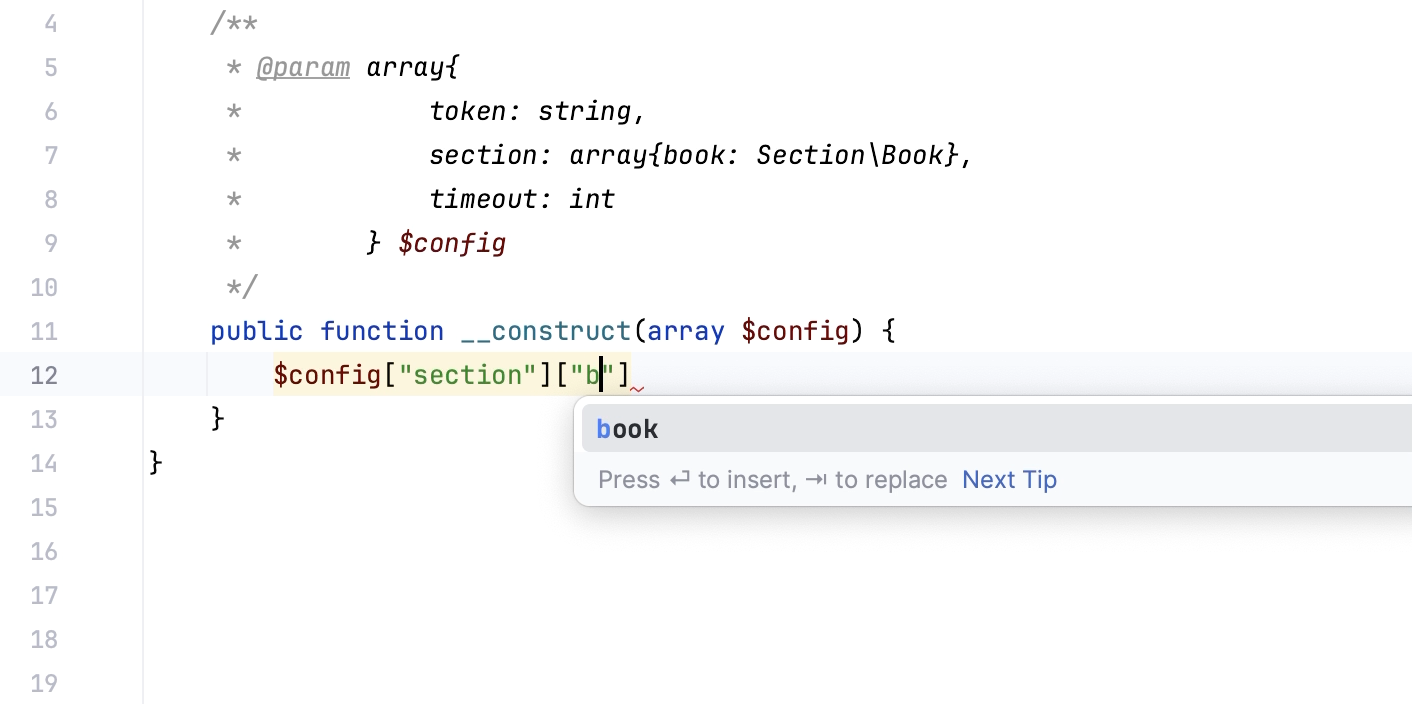
PHP code completion. The PHP plugin helps you speed up the coding process with context-aware PHP code completion and PHP type checking.
Static code analysis. The PHP plugin comes with an extensive set of inspections for static analysis of PHP code. A specific type of inspections is code quality checks by third-party tools, such as PHP CS Fixer, Laravel Pint, PHPStan, Psalm, PHP_CodeSniffer, and PHP Mess Detector.

Inspections not only tell you where a problem is, but also provide quick-fixes that help you deal with it right away. For the code that is correct (that is, not highlighted in the editor) but can still be optimized in the current context, there are intention actions.
Code generation and live templates. The plugin provides multiple ways to generate boilerplate PHP code. For bigger code constructs, such as loops, conditions, declarations, or print statements, there are PHP live templates.
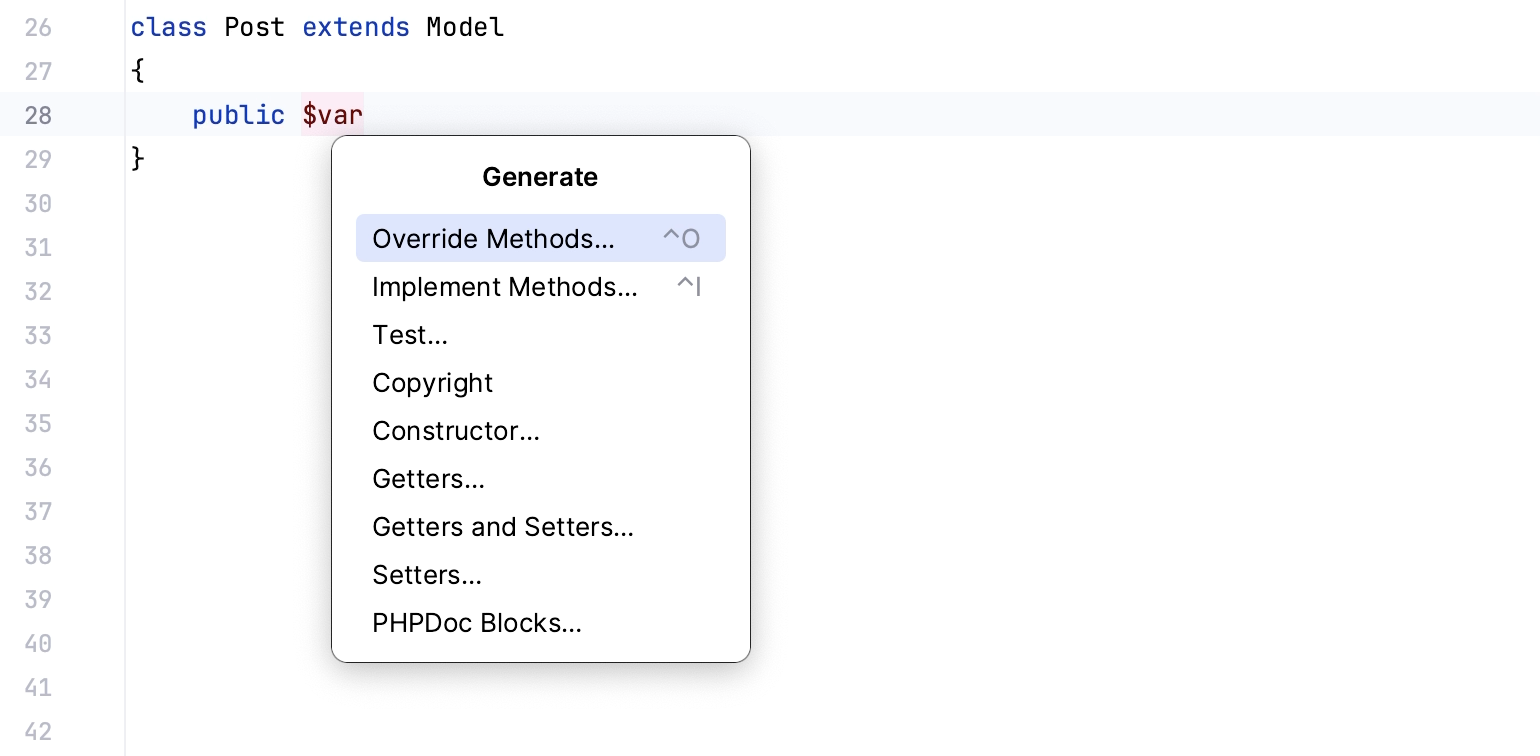
PHPDoc comments. For documentation comments, the plugin provides completion that is enabled by default. IntelliJ IDEA creates stubs of PHPDoc blocks when you type the
/**opening tag and press Enter, or press Alt+Insert and appoint the code construct (a class, a method, a function, and so on) to document.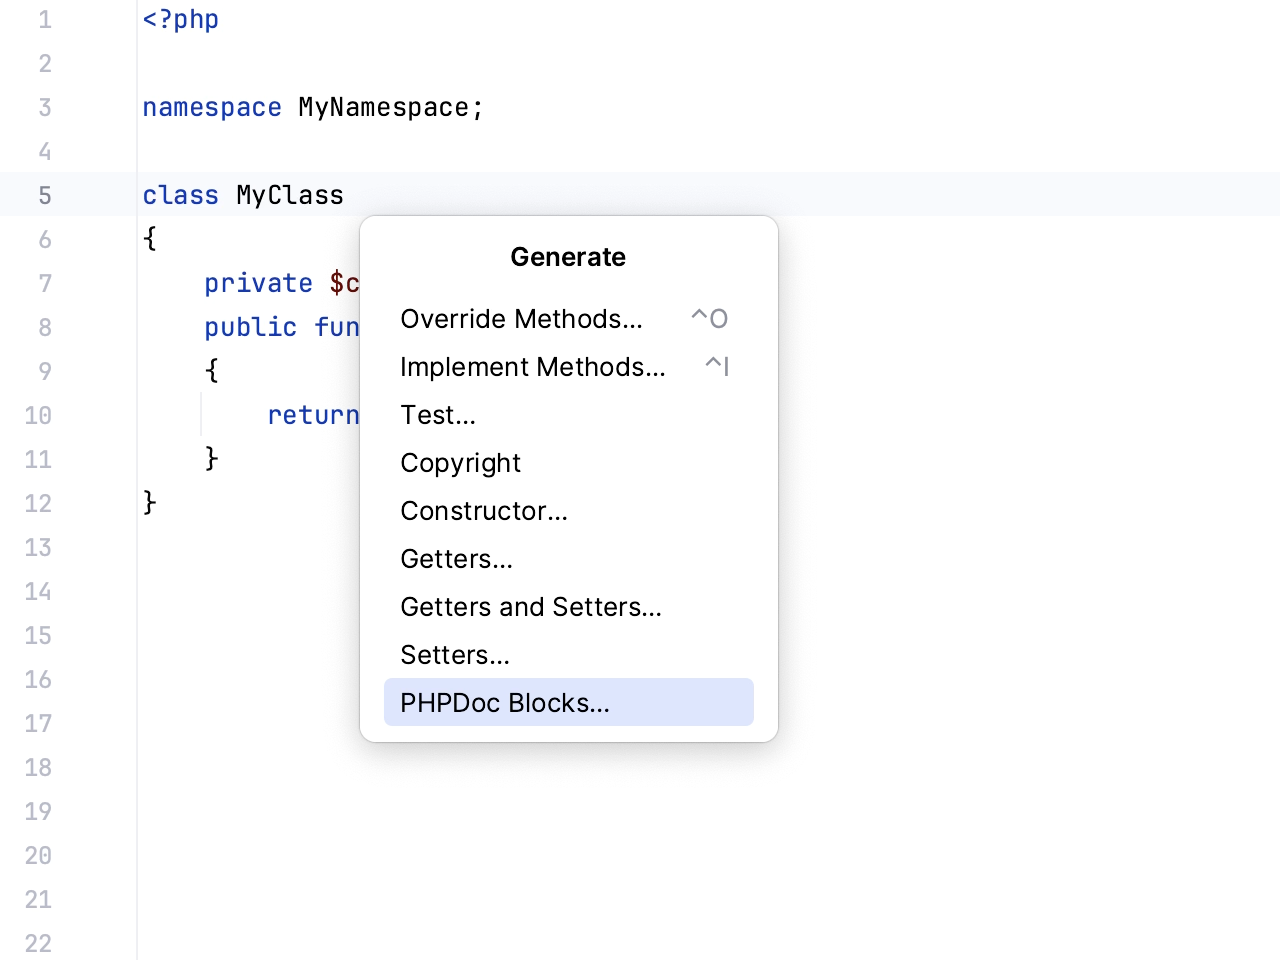
Run PHP code
There are several ways to run a PHP application in IntelliJ IDEA:
From IntelliJ IDEA using a run configuration of the type PHP Web Page to view application output in a browser.
From IntelliJ IDEA using a PHP Script run configuration to view the application output in the Run tool window.
From IntelliJ IDEA, using a built-in Web server. This approach saves your time and effort because you do not need to deploy the application sources.
Debug PHP code
The plugin supports PHP code debugging with Xdebug and Zend Debugger. With Xdebug, the IDE automates the process of getting the debugger up and running, showing you the necessary prompts and action links as you go.
Besides interactive debugging, the IDE's integration with Xdebug also supports profiling. IntelliJ IDEA provides visual representation of the profiling snapshots generated by Xdebug to help you examine how your PHP application uses execution time and memory.
Test PHP code
The PHP plugin supports integration with the most popular PHP test frameworks: PHPUnit, Pest, Behat, PHPSpec, and Codeception, so that you could create, manage, execute tests and review test results from within the IDE.
You can configure and run tests in different modules of a PHP project independently of one another. If your PHP project contains multiple Composer-managed subprojects, and each of such subprojects has its own test framework executable and/or configuration file, IntelliJ IDEA creates a separate test framework configuration for each subproject.
Deploy PHP application
With IntelliJ IDEA, you can flexibly configure deployment of PHP applications. For example, you can set up your PHP project on a local Web server from the very beginning, or develop and test an application locally and then upload it to a remote Web server, and so on.
Supported PHP frameworks and tools
Framework/tool | Plugins required |
|---|---|
PHP, Laravel Idea (paid) | |