Explore PhpStorm features
PhpStorm is an Integrated Development Environment (IDE) for PHP developers built to maximize developer productivity. The IDE desktop application helps you write, edit, analyze, refactor, test, and debug PHP code on Windows, macOS, and Linux.
With PhpStorm, you have full support for developing applications in PHP 5.3 and all later PHP versions, including PHP 8.3. In addition, the IDE has built-in support for HTML5, CSS, JavaScript, XML, and databases. Support for other languages can be added via plugins.
Step 1: Open a project in PhpStorm
Everything you do in PhpStorm is done within the context of a project. It serves as a basis for coding assistance, bulk refactoring, coding style consistency, and many other IDE features. As you launch PhpStorm, the Welcome screen opens.

From the Welcome screen, you can create a new project from scratch, clone and open a project right from the version control system, or open a project created in another IDE or in a dedicated editor.
If you are not going to use a Web server in your project right now, you can just open the folder with the project files. This option imports the selected project to PhpStorm as is (opens it).
If, besides source files, you have a Web server configured for application deployment, use the New Project From Existing Files wizard to set up your PhpStorm project. The wizard covers different scenarios corresponding to different source files location and server configurations (in-place, local, or remote), and takes you through configuring folders under the project root.
Step 2: Explore the user interface

Menus and toolbars provide quick access to some of the IDE's most frequently used commands.
Navigation bar is a quick alternative to the Project view, where you can navigate the structure of your project and open files for editing.
Status bar contains a configurable set of widgets and shows the progress of processes.
The Editor is the working area where you actually write your code. It has tabs for easy navigation between opened files.
Numerous tool windows provide access to development tasks: viewing the project structure, running and debugging your application, integration with version control systems and other external tools, code analysis, search, remote host navigation, and so on.
Shortcuts for everything
In PhpStorm, you have shortcuts for nearly every action, including selection and switching between the editor and various tool windows.
Use the most useful shortcuts to invoke frequent actions without switching your focus from the editor and tune your keymap to assign custom shortcuts for your favorite commands.
Step 3: Configure PHP environment
PhpStorm is a smart IDE, but first you need to inform it which PHP environment to use, where PHP components are stored, and how they are configured.
If you work with a local Web server, follow the Configure local PHP interpreters procedure to prepare your environment.
If you work with a PHP engine that is installed on a remote host or in a virtual environment, follow the Configure remote PHP interpreters procedure to prepare your environment. For more detailed instructions, see:
Step 4: Code with smart assistance
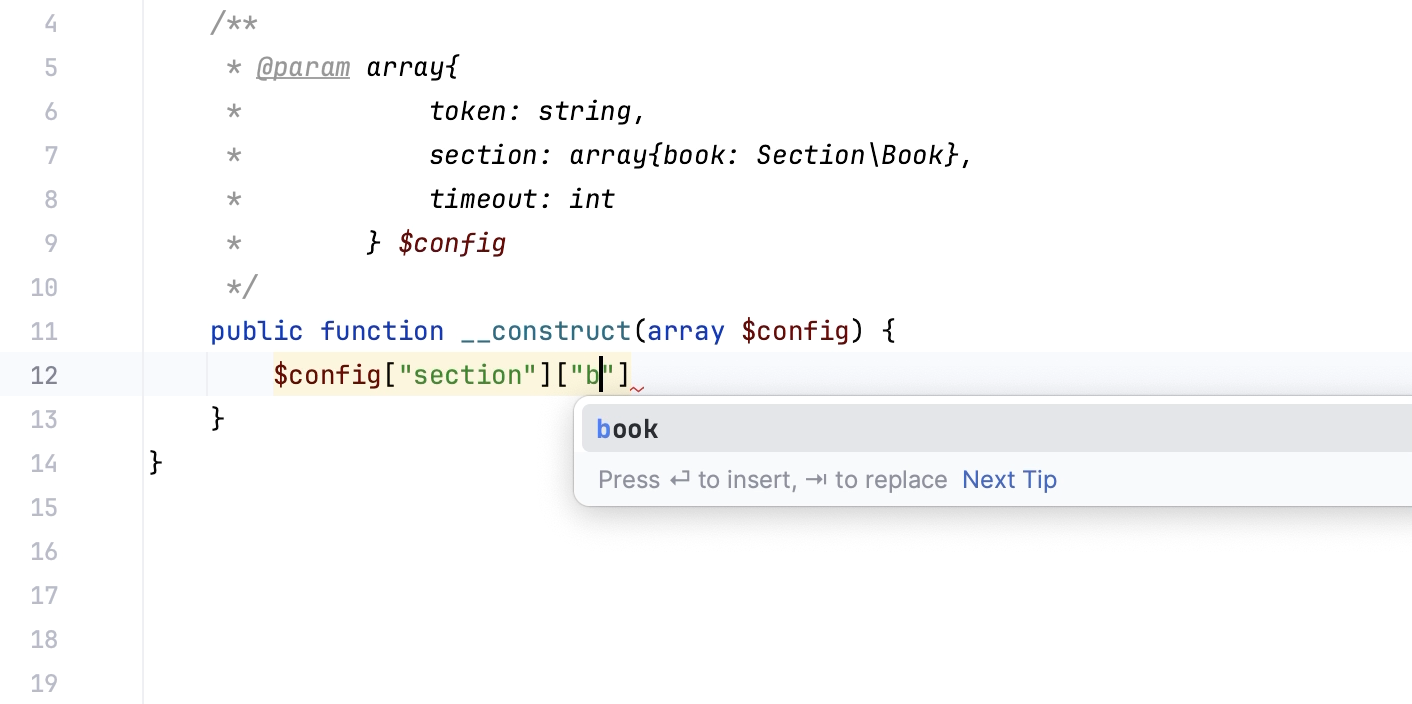
Code completion
PhpStorm helps you speed up the coding process with context-aware code completion and PHP type checking.
Basic completion shows the code completion options for names of classes, methods, and keywords within the visibility scope as you type.
Full Line code completion is an AI-powered feature that uses a locally run deep learning model to suggest entire lines of code.
Suggestions are displayed in the editor as you type PHP, JavaScript/TypeScript, or CSS code.

Static code analysis
The IDE comes with an extensive set of inspections for static code analysis. Inspections help you find any potential bugs that jeopardize the quality, performance and structure of your code, be it critical errors or just typos.

A specific type of PhpStorm inspections is code quality checks by third-party tools, such as PHP CS Fixer, Laravel Pint, PHPStan, Psalm, PHP_CodeSniffer, and PHP Mess Detector.
Inspections not only tell you where a problem is, but also provide quick-fixes that help you deal with it right away. To see and apply the available fixes, click the bulb icon next to the highlighted code, or press Alt+Enter.
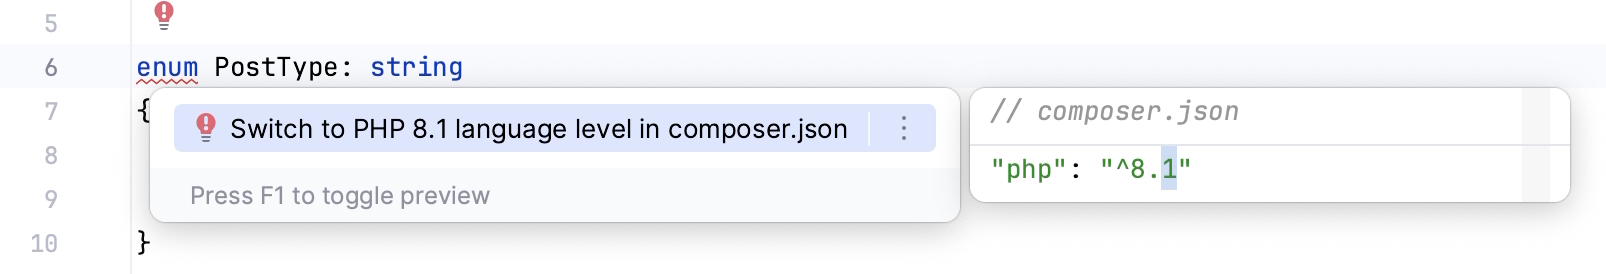
For the code that is correct (that is, not highlighted in the editor) but can still be optimized in the current context, there are intention actions. Intention actions in the IDE are accessed in the same way as quick-fixes: click the bulb icon or set the caret and press Alt+Enter.
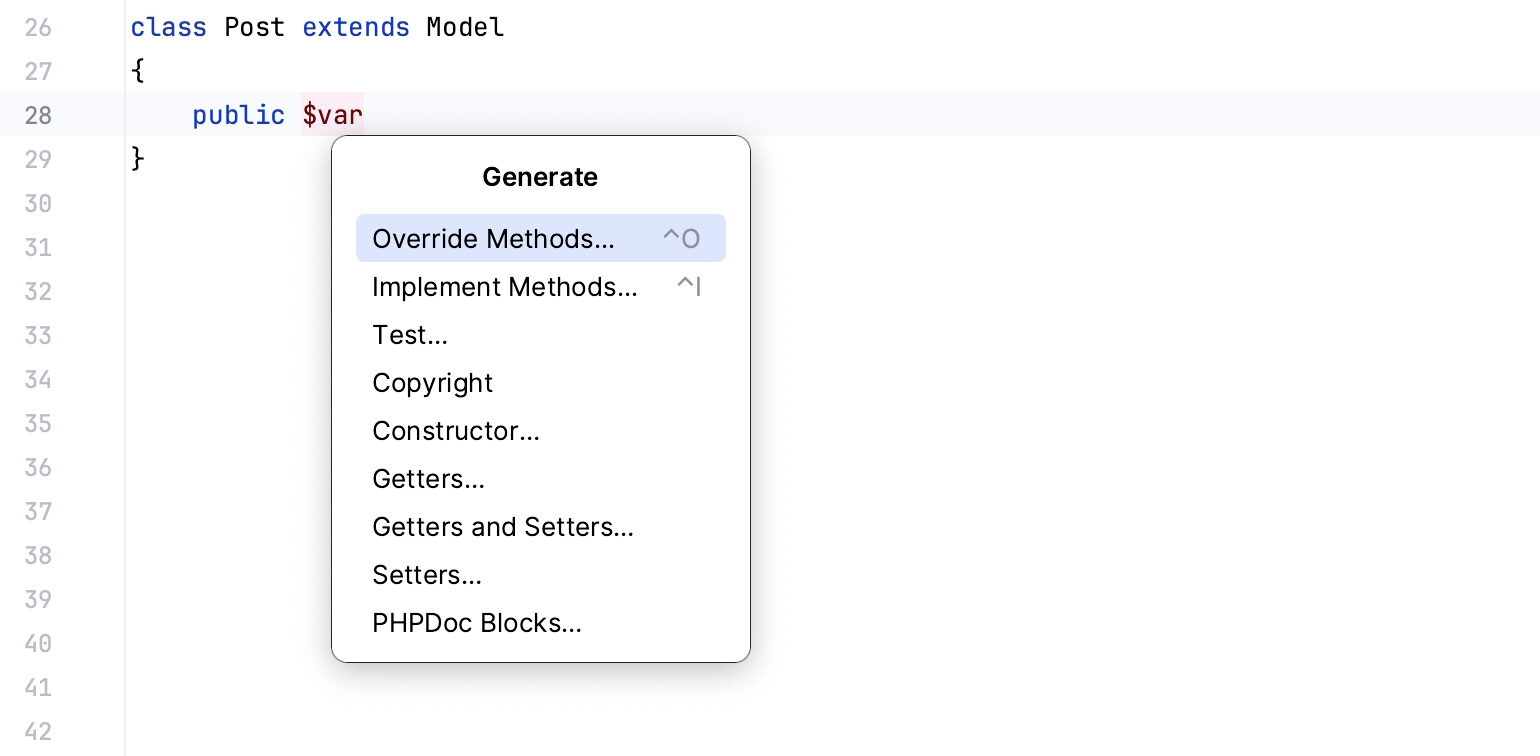
Code generation and live templates
PhpStorm provides multiple ways to generate boilerplate code. To open a popup with the available boilerplate constructs you can generate from your caret position, press Alt+Insert.
To insert bigger code constructs, such as loops, conditions, declarations, or print statements, use live templates. To insert a live template, press Ctrl+J.
Step 5: Navigation and search
Search everywhere
One of the most useful shortcuts that is worth keeping in mind is double Shift that brings up the Search Everywhere dialog: start typing and PhpStorm will look for your search string among all files, classes, and symbols that belong to your project, and even among the IDE actions.
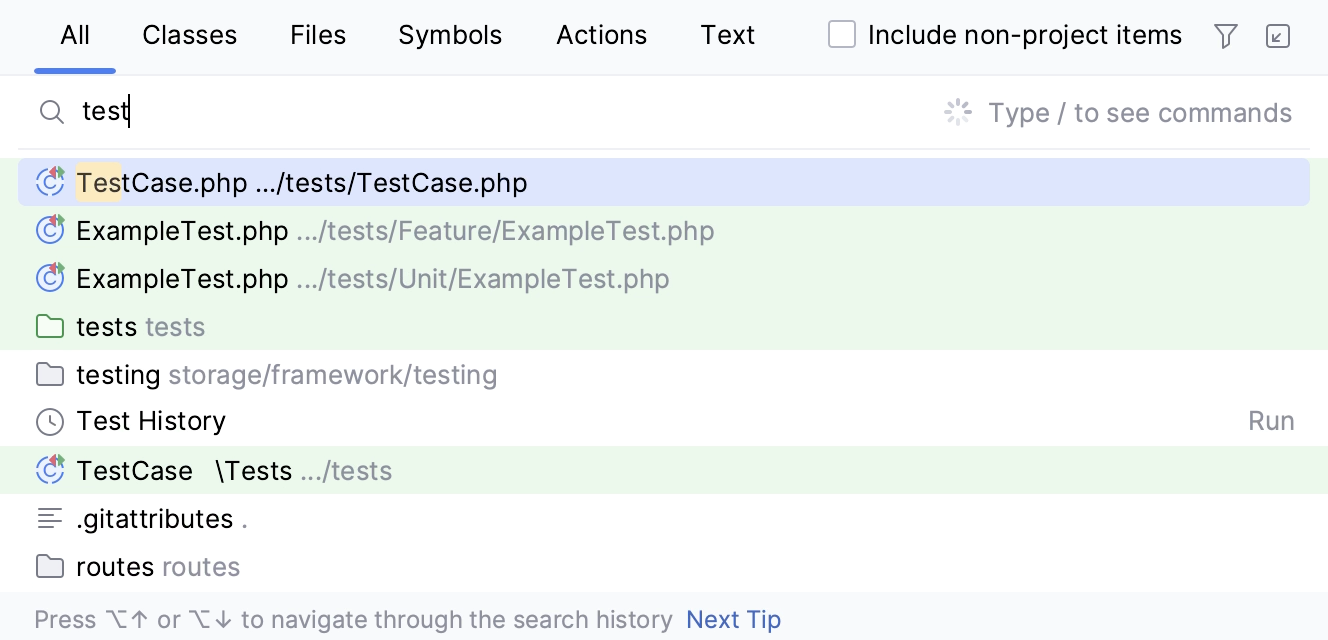
The Search Everywhere dialog accepts CamelHumps and recognizes search patterns and middle matches.
Code navigation
You can quickly navigate through code in the editor, including imports or call hierarchies, using different actions and popups. Here are some of the most useful navigation shortcuts:
Action | Description |
|---|---|
Find usages Alt+F7 | Opens the Find tool window showing where a particular symbol at the caret is used in your project. |
Go to declaration Ctrl+B, Ctrl+Click | Brings you to the location where a particular symbol is first declared. This type of navigation works from any place in the source code, even from another class or comment. |
Go to Implementation Ctrl+Alt+B | Brings you to the implementation of a particular class. If there are several implementations, PhpStorm shows them in a list where you can select the relevant one to navigate to. |
Step 6: Debug your application
PhpStorm integrates with Xdebug to let you get and analyze runtime information, which is useful for diagnosing issues and getting a deeper understanding of how a program operates. It enables you to:
Suspend the program execution to examine its behavior using breakpoints. Multiple types of breakpoints, together with conditions and filters, allow you to specify the exact moment when an application needs to be paused.
Play with the program state by modifying variable values, evaluate expressions, and so on.
Examine variable values, call stacks, thread states, and so on.
Control the step-by-step execution of the program.

PhpStorm automates the process of getting Xdebug up and running, showing you the necessary prompts and action links as you go. For the detailed guide and troubleshooting instructions, see Debugging with PhpStorm.
Step 7: Test your code
PhpStorm integrates with the most popular PHP test frameworks: PHPUnit, Pest, Behat, PHPSpec, and Codeception, so that you could create, manage, execute tests and review test results from within the IDE.

In PhpStorm, you can configure and run tests in different modules of a PHP project independently of one another. If your PHP project contains multiple Composer-managed subprojects, and each of such subprojects has its own test framework executable and/or configuration file, PhpStorm creates a separate test framework configuration for each subproject.
Step 8: Version control and Local History
PhpStorm provides integration with the most popular version control tools: Git, Mercurial, Perforce, and Subversion.
You can review the history of your entire project or separate files, compare file versions, manage branches, and even process GitHub pull requests without leaving the IDE.
You can quickly access all VCS actions from the VCS operations popup Alt+`:

For more information about configuring integration with your VCS and perform the VCS-related operations, refer to Version control.
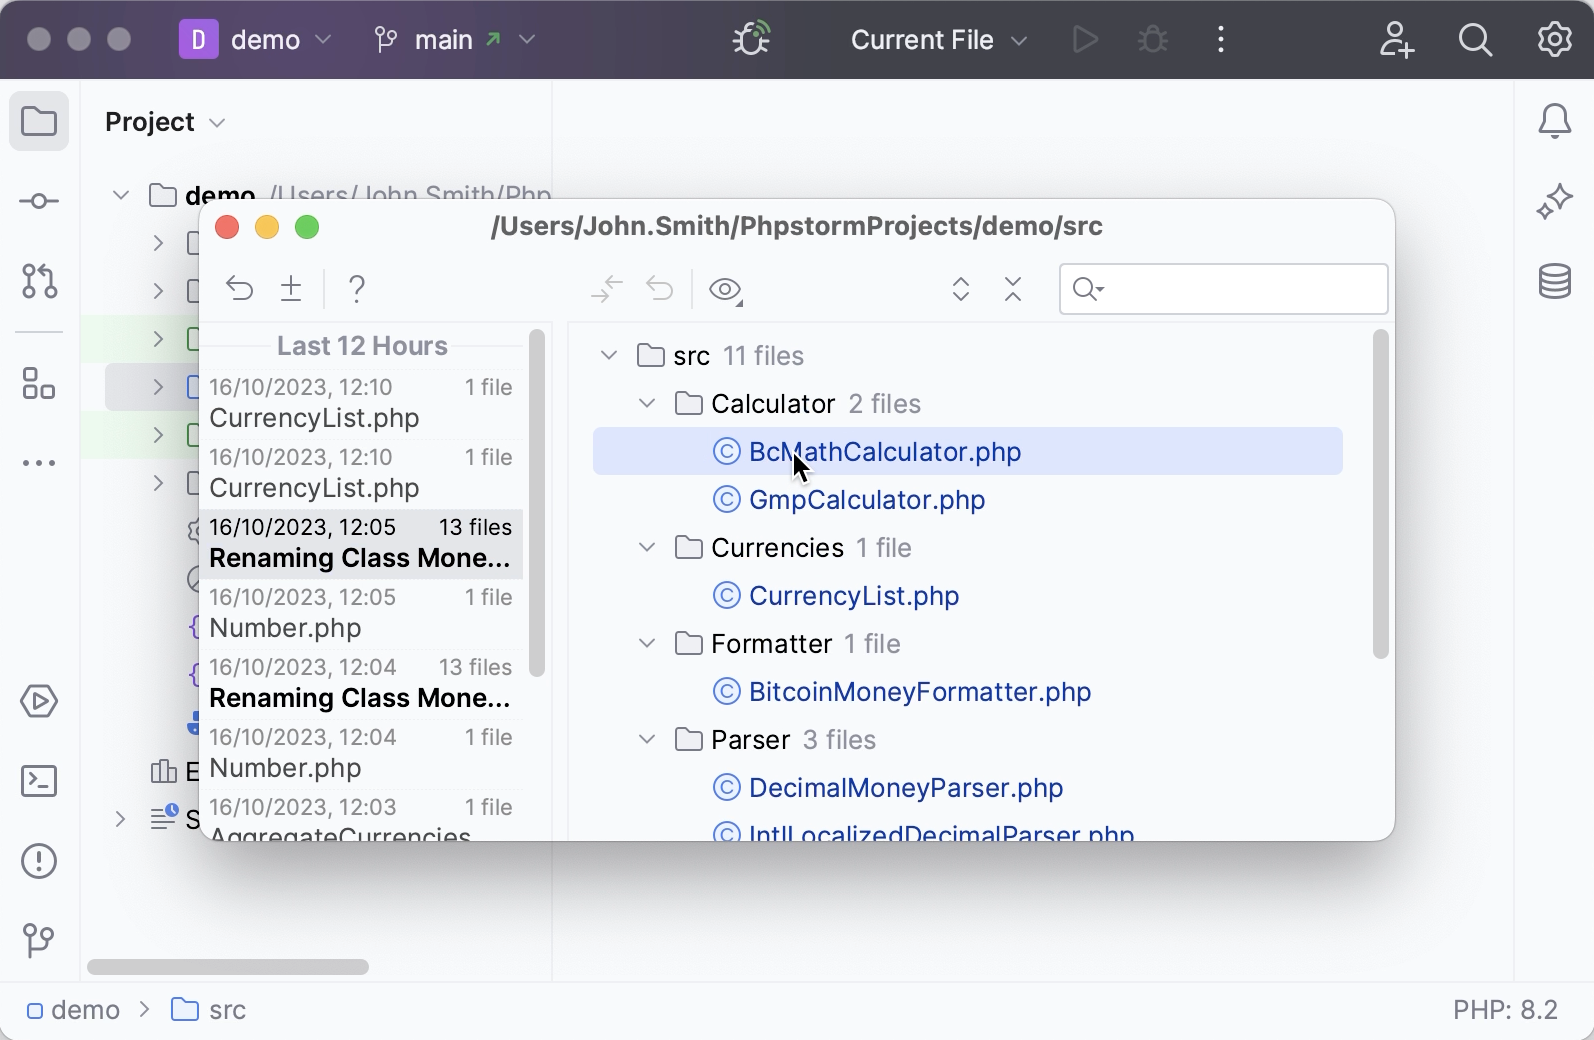
Local History
Even if no version control is enabled for your project yet, you can still keep track of modifications to your project, restore deleted files, revert or separate changes with Local History. Local History is always enabled and acts as your personal version control system. It automatically records your project's revisions triggered by various events as you edit, reformat or refactor your code, run tests, and so on.