AI adoption and usage
The AI adoption and usage segment lets you track AI adoption and engagement in your organization over a period of time by providing insight into the active use of AI in the organization. You can also track the consumption of AI credits and have an overview of consumers who have reached their monthly limits. This can help you analyze the extent of AI adoption and identify where further action may be needed.
The following adoption and usage metrics are available:
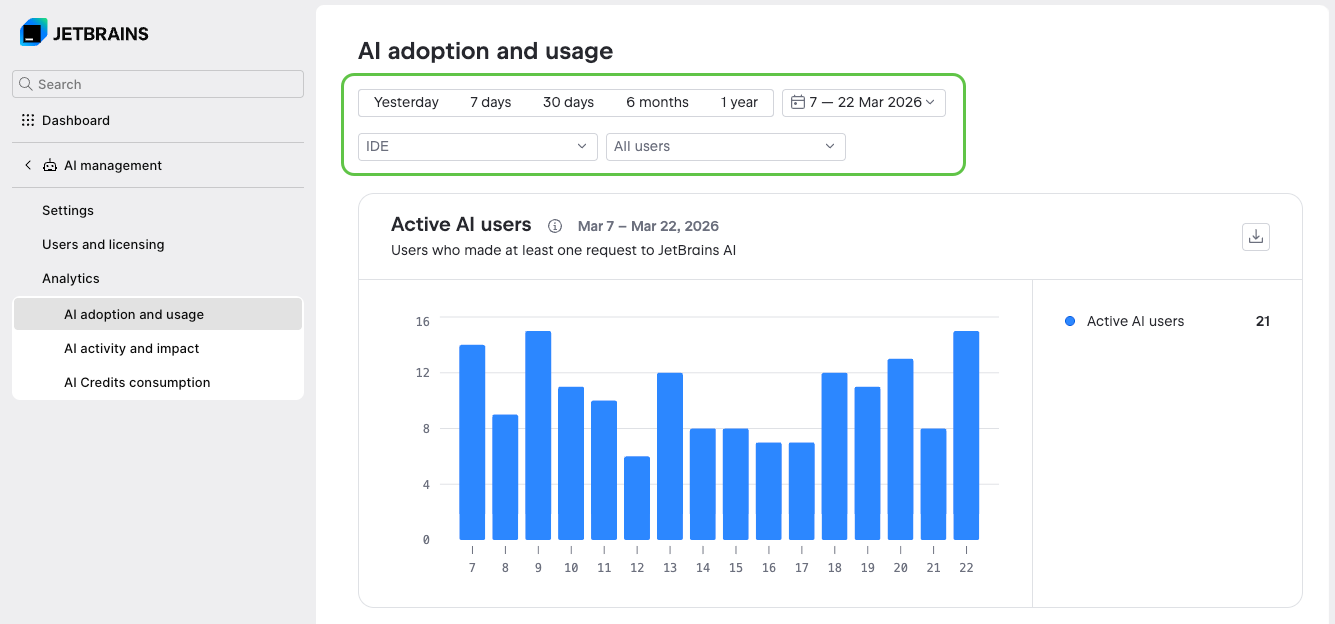
Each metric is presented as a bar chart. The following filters are available:
In the time range filter, select one of the predefined filters that show the last specified period, or select a custom date range. The data includes both the first and the last day of the selected period.
In the tool filter, which displays All tools by default, show only the data that originates from the selected tools. In addition to JetBrains IDEs, the dropdown includes the following tools:
JetBrains Air, the agentic development environment (ADE) by JetBrains.
JetBrains Central CLI, which is a local command-line proxy rather than a development environment. Select it to show the data that comes from the coding agents that it routes.
In the principal filter, which displays All principals by default, search for and select users, service accounts, or groups. Selecting a group includes all of its members and members of its subgroups. Expand a group to select its subgroups.
Filters of different types are combined with a logical AND. For example, data will match both the selected date range and the user the data is attributed to.
Multiple selections of the same filter are combined with a logical OR. For example, selecting a group along with an individual user shows data for that user and all members of the group.
Filter selections are preserved across analytics segments. The filters that you set in one segment are automatically preselected when you switch to another segment.
Sources of adoption and usage data
The data in this analytics segment comes from a specific set of products, tools, and AI agents. For details about what the metrics do and don't include, see the following sections.
Data included in the metrics
The data shown in this analytics segment is mostly based on AI credit consumption for the use of agents and models through the following products and tools:
AI Assistant in JetBrains IDEs, either when using a supported agent or in Chat mode.
JetBrains Central CLI, when using a supported agent wired through the CLI.
JetBrains Air, when using a supported agent in the desktop or web version of JetBrains Air.
The following AI agents are currently supported for data collection:
Junie, an AI coding agent developed by JetBrains. Data is also collected when Junie is used through its dedicated tool window.
Claude Agent, a third-party coding agent by Anthropic.
Pi, a minimal, open-source agent harness.
GitHub Copilot, a third-party coding agent by GitHub.
The charts may also show data labeled as Uncategorized, which includes consumption of AI credits by new or less common tools that don't have a dedicated categorization.
Data excluded from the metrics
The metrics in this analytics segment exclude the following usage of products and tools as they don't consume AI credits:
Using in-editor features such as Next edit suggestions and Code completion.
Using models from a centrally configured third-party AI provider. An organization administrator can configure connections to third-party AI providers and make models from the provider available to users in the organization. The use of such models is charged by the third-party provider directly and is not included in the metrics.
Using models from third-party AI providers configured locally in AI Assistant. When you provide your own API key from a supported AI provider directly in AI Assistant, the usage is also charged directly by the third-party provider and doesn't consume AI credits.
Using agents in AI Assistant with provider accounts or provider-specific authentication methods.
AI access and usage
The AI access and usage bar chart shows how many consumers in your organization have AI access and how many of them are actively using AI. This lets you identify the current level of AI availability and adoption in your organization, as well as adoption trends over time.
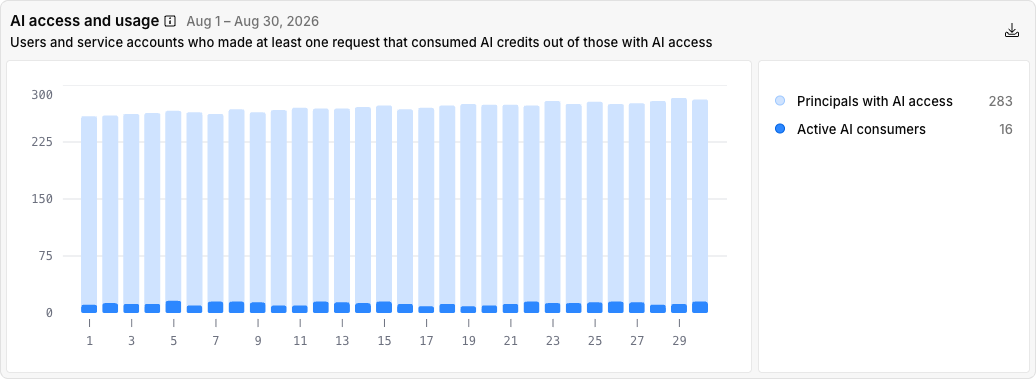
The following sub-metrics in the chart's legend show the total numbers:
Principals with AI access: The total number of unique consumers who had AI access during the selected period. A consumer is added to the count if the period during which they had AI access overlaps with the selected period in the filter. For example, if the selected period on the chart is from January 15 until January 31, and the user had AI access from January 1 until January 20, they are added to the count.
Active AI consumers: The total number of unique consumers who made at least one request to JetBrains AI that spent AI credits during the selected period.
Depending on the period selected in the time-based filter, the chart shows a different granularity: per day, month, or year. In all cases, each consumer is counted only once per bar, even if they appear in more than one time unit.
What each bar counts depends on the sub-metric:
Principals with AI access: Each bar counts the unique consumers who had AI access during that time unit. For example, a consumer who had access throughout January is counted once in the January bar when the chart shows data per month, and once in each daily bar from January 1 to January 31 when the chart shows data per day.
Active AI consumers: Each bar counts the unique consumers who made at least one request that spent AI credits during that time unit. For example, if a consumer makes requests on January 15 and January 26, they are counted once in the January bar when the chart shows data per month, and once in the January 15 bar and again in the January 26 bar when the chart shows data per day.
AI credit consumption
The AI credit consumption chart shows the number of AI credits spent by AI consumers, broken down by tool.
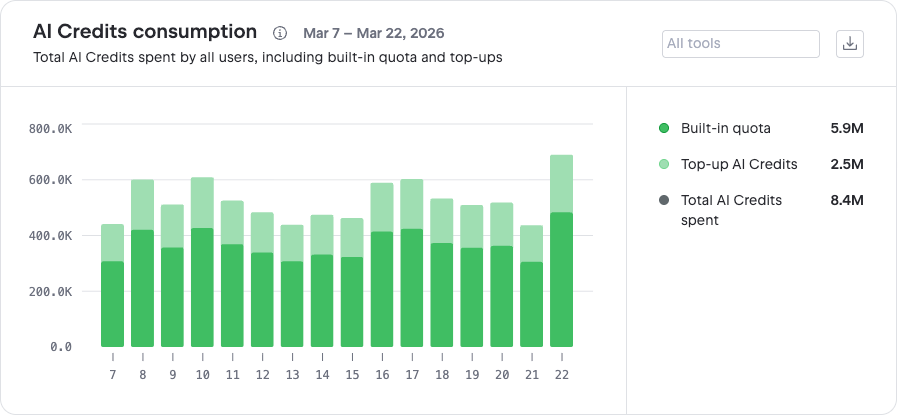
In addition to the filters available for all charts, you can use the All agents filter above the chart to show AI credit consumption for specific AI agents only. By default, the chart shows the five categories with the highest consumption. The legend also includes the following items:
Total: The total number of AI credits spent across all available AI tools.
Uncategorized: Combined consumption by new or less common tools that are not yet assigned to their own dedicated category. Uncategorized can also appear among the five categories with the highest consumption.
Remaining: Combined consumption of all other categorized tools whose individual consumption falls below that of the five categories with the highest consumption.
Number of AI consumers who hit their AI credit limit
This chart shows the number of unique consumers who used up all of their AI credits. These insights let you identify usage patterns and potential needs to adjust the number of AI credits.
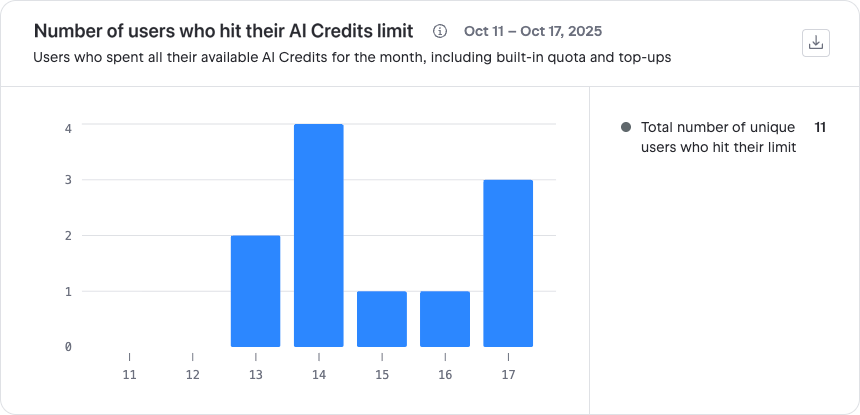
The chart includes the following sub-metric:
Total number of AI consumers who hit their limit: The total number of AI consumers who hit their limit during the selected period.
Depending on the period selected in the time-based filter, the chart shows data per day, month, or year. Each consumer is counted only once per bar, even if they hit their limit multiple times during that period. For example, if a consumer hits their limit on January 15 and again on January 26, they are counted only once in the bar for January when the chart shows data per month. This also applies if a consumer's limit is increased and they reach the new limit within the same period: they are still counted only once for that bar.
For a list of individual AI consumers who hit their limit, see the List of AI consumers who hit their AI credit limit table.
List of AI consumers who hit their AI credit limit
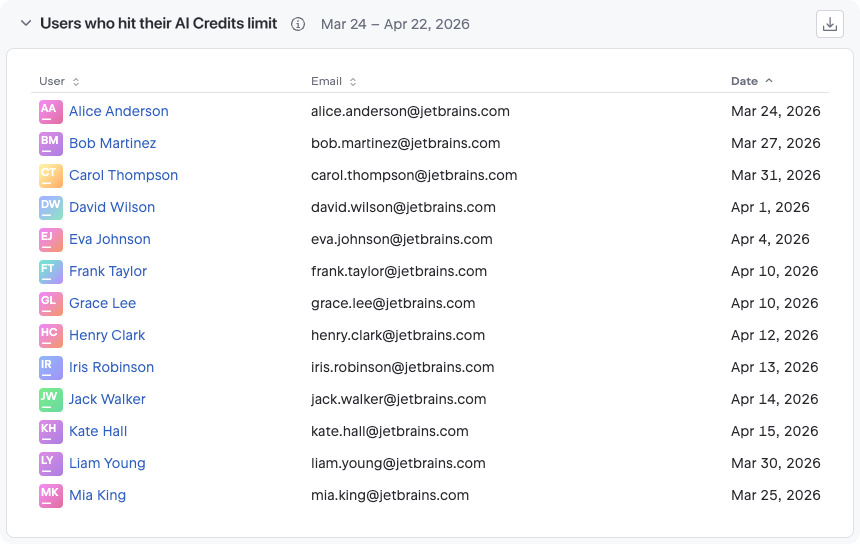
This table lists all consumers who reached their AI credit limit during the selected period. For users, the table includes the consumer's name, email, and the date when they hit the limit. For service accounts, the information includes the service account name, the user who created the account, and the date when it hit the limit.
As a single consumer can hit their quota limit multiple times in a single time period, there may be multiple entries for the same consumer in the table. However, since limit hits are aggregated on a daily level, if a consumer hits more than one limit during the same day, a single entry is added to the table.