AI credit consumption
The AI credit consumption analytics segment lets you track how AI consumers in your organization are spending AI credits. You can review the data per individual AI consumer or per group and open a pane with the consumption details of a specific consumer or group.
Sources of credit consumption data
The data in this analytics segment comes from a specific set of products, tools, and AI agents. For details about what the metrics do and don't include, see the following sections.
Data included in the metrics
This analytics segment tracks spending information for the use of agents and models through the following products and tools:
AI Assistant in JetBrains IDEs, either when using a supported agent or in Chat mode.
JetBrains Central CLI, when using a supported agent wired through the CLI.
JetBrains Air, when using a supported agent in the desktop or web version of JetBrains Air.
The following AI agents are currently supported for data collection:
Junie, an AI coding agent developed by JetBrains. Data is also collected when Junie is used through its dedicated tool window.
Claude Agent, a third-party coding agent by Anthropic.
Pi, a minimal, open-source agent harness.
GitHub Copilot, a third-party coding agent by GitHub.
The charts may also show data labeled as Uncategorized, which includes consumption of AI credits by new or less common tools that don't have a dedicated categorization.
Data excluded from the metrics
The metrics in this analytics segment exclude the following usage of products and tools as they don't consume AI credits:
Using in-editor features such as Next edit suggestions and Code completion.
Using models from a centrally configured third-party AI provider. An organization administrator can configure connections to third-party AI providers and make models from the provider available to users in the organization. The use of such models is charged by the third-party provider directly and is not included in the metrics.
Using models from third-party AI providers configured locally in AI Assistant. When you provide your own API key from a supported AI provider directly in AI Assistant, the usage is also charged directly by the third-party provider and doesn't consume AI credits.
Using agents in AI Assistant with provider accounts or provider-specific authentication methods.
AI credit consumption report
The AI credit consumption report table shows the number of AI credits used during the selected period. Use the tabs at the top of the page to switch between the following views:
Principals: Breaks the data down by individual AI consumer, which is a user or a service account. For details, see Principals view.
Groups: Breaks the data down by group, with the option to expand a group and see its subgroups. For details, see Groups view.
In both views, the table can be filtered by the following criteria:
In the time range filter, select one of the predefined filters that show the last specified period or select a custom date range. The data includes both the first and the last day of the selected period.
In the tool filter, which displays All tools by default, show only the data that originates from the selected tools. In addition to JetBrains IDEs, the dropdown includes the following tools:
JetBrains Air, the agentic development environment (ADE) by JetBrains.
JetBrains Central CLI, which is a local command-line proxy rather than a development environment. Select it to show the data that comes from the coding agents that it routes.
In the agent filter, which displays All agents by default, show consumption data only for the selected AI agents. When no agent is selected, the table shows consumption for all agents, split by agent.
The last filter depends on the selected view:
In the Principals view, the principal filter displays All principals by default. Search for and select users, service accounts, or groups. Selecting a group includes all of its members and members of its subgroups.
In the Groups view, the group filter displays All groups by default. Search for and select the groups whose consumption you want to see.
Filters of different types are combined with a logical AND. For example, data will match both the selected date range and the user the data is attributed to.
Multiple selections of the same filter are combined with a logical OR. For example, selecting a group along with an individual user shows data for that user and all members of the group.
Filter selections are preserved across analytics segments. The filters that you set in one segment are automatically preselected when you switch to another segment.
To change how data is sorted, click the column header.
For more information on how to download data and the data format, see Downloading data.
Principals view
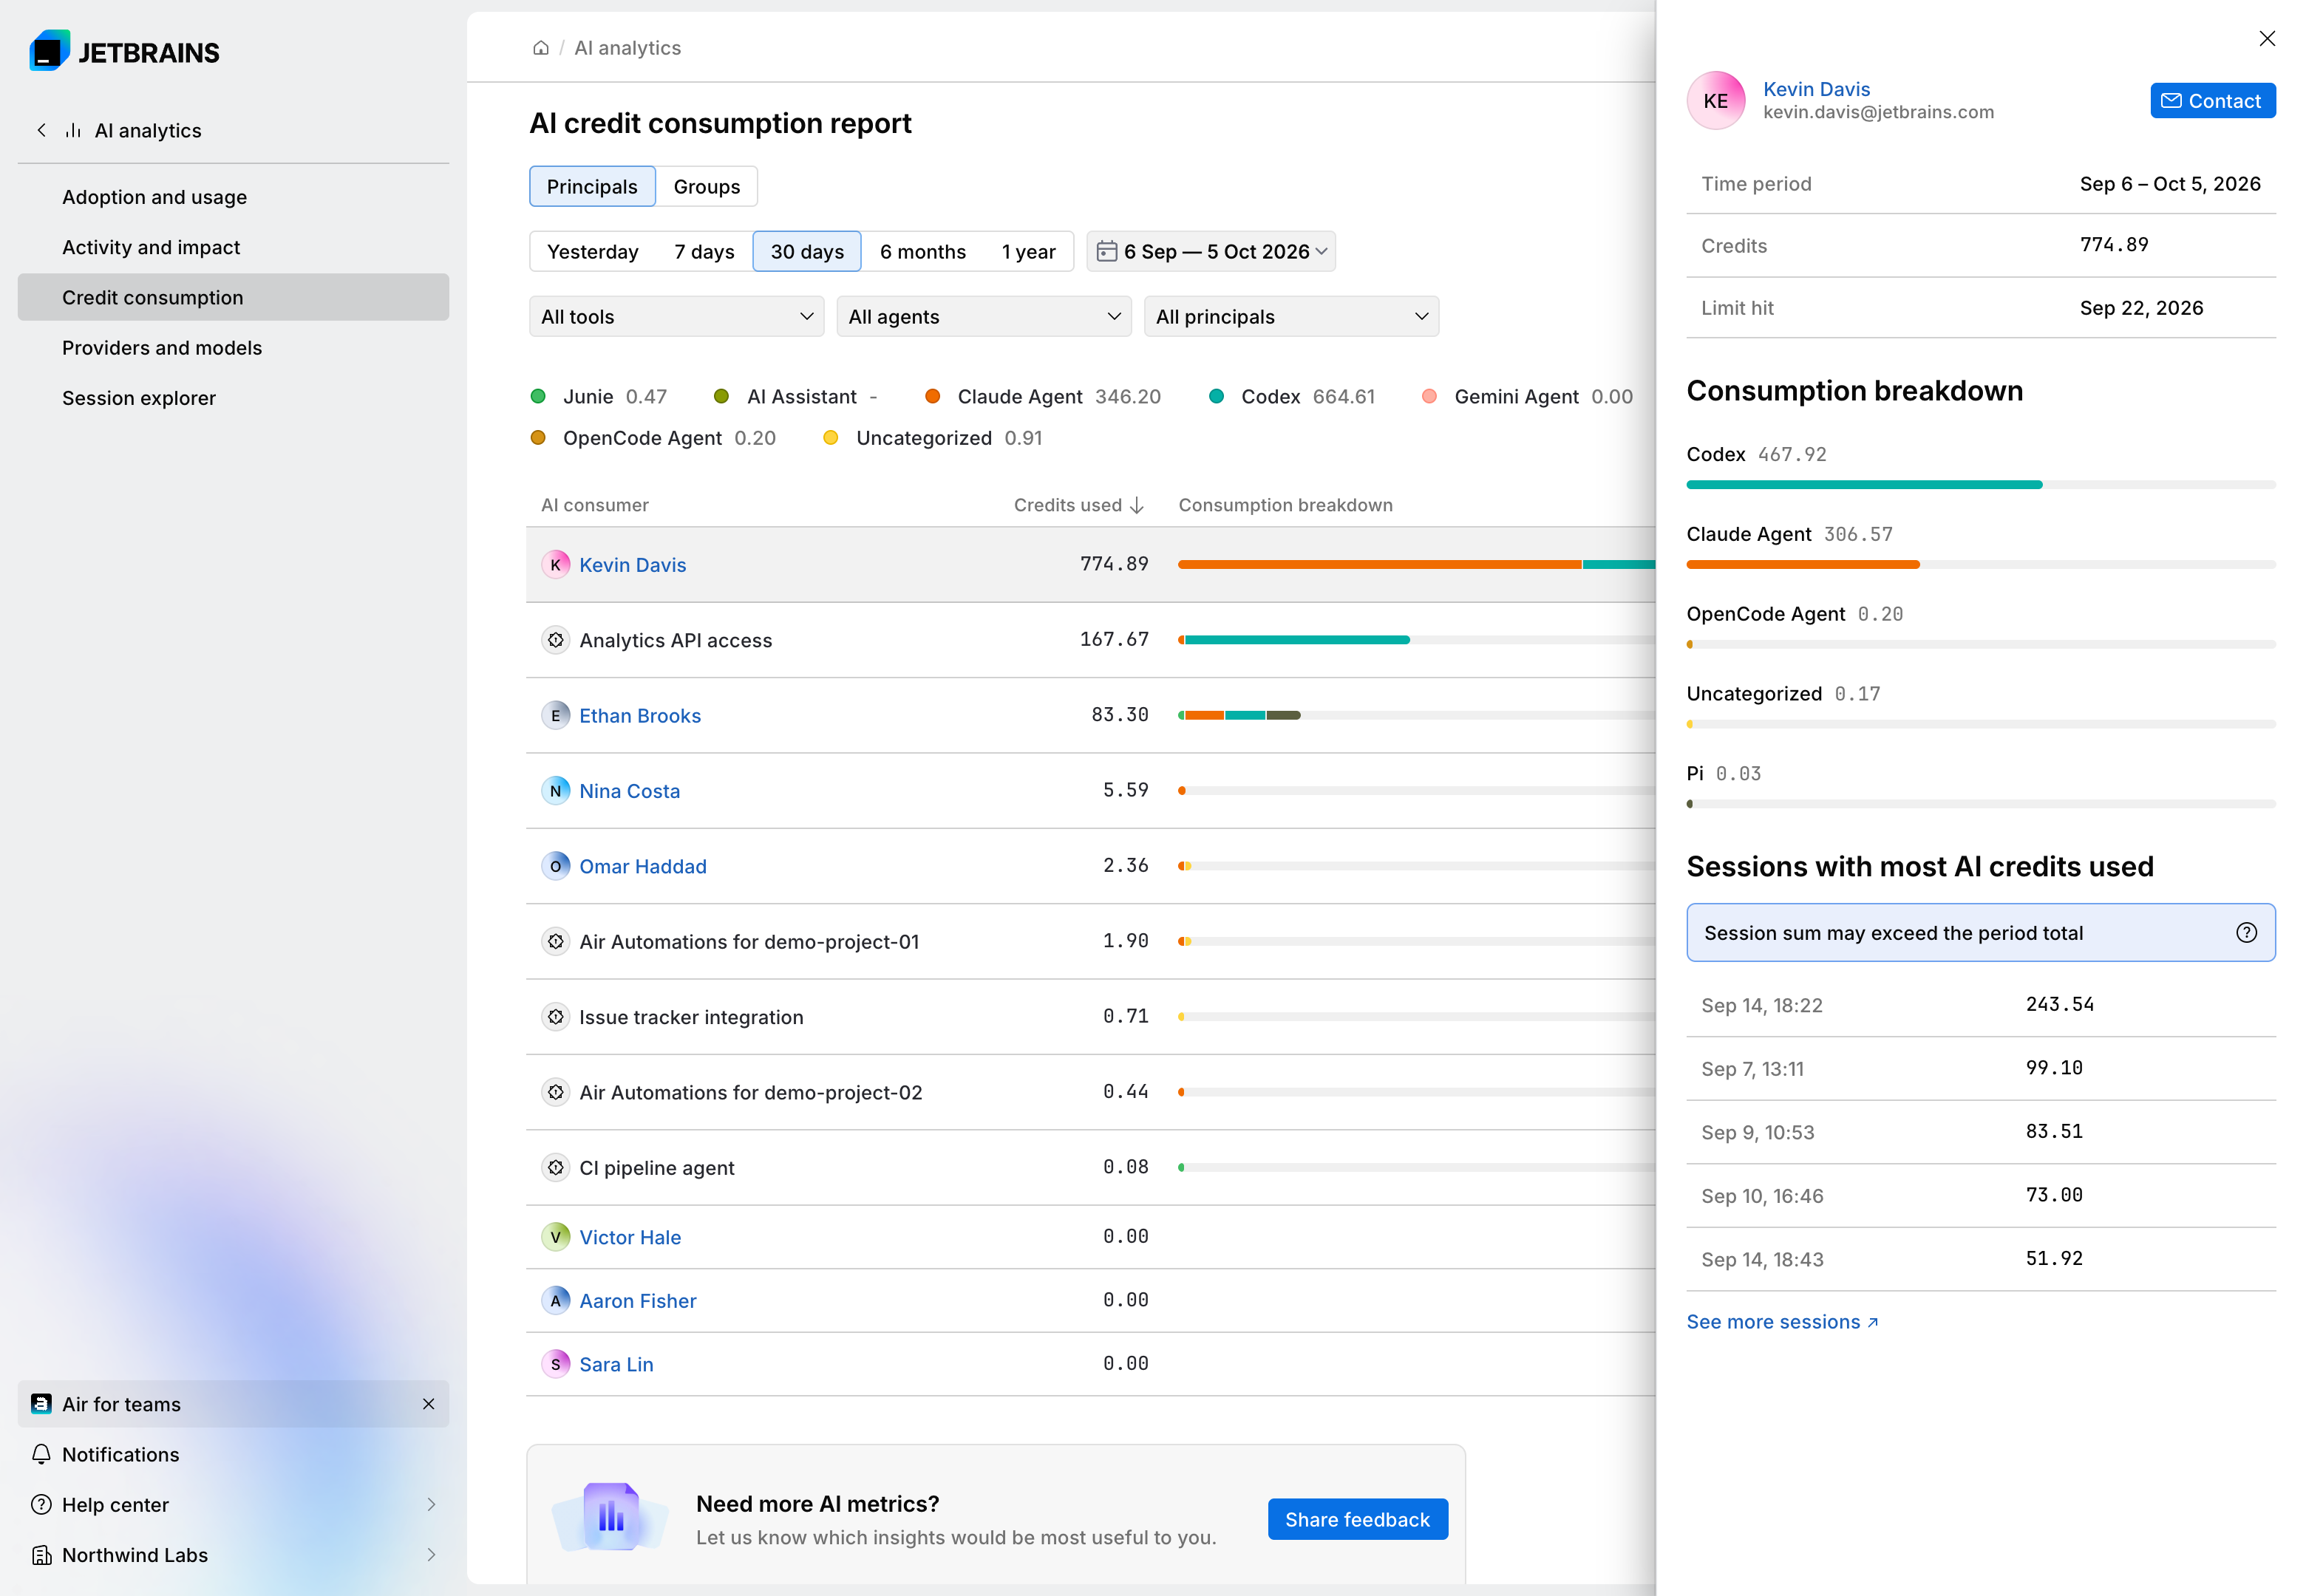
The Principals view breaks the data down by AI consumer. An AI consumer is a user or a service account in your organization that spends AI credits through the use of AI. The table includes the following columns:
AI consumer: The name of the user or service account.
Credits used: The number of AI credits that the consumer used during the selected period.
Consumption breakdown: A bar that shows how the consumer's spending is split between AI agents and tools. The colors of the bar segments match the legend above the table, and the length of the bar is relative to the highest consumption in the table.
Consumption details for a principal
To see more details about the spending of a specific consumer, click their row in the table. This opens a pane with the following information:
The name of the user or service account. To ask the user or service account owner about their AI credit consumption, click Contact. This starts an email addressed to the user.
Time period: The period that is currently selected in the time range filter.
Credits: The total number of AI credits that the consumer spent during the selected period.
Limit hit: The date when the consumer hit their AI credit limit during the selected period.
Consumption breakdown: The number of AI credits that the consumer used per AI agent or tool, sorted from the highest to the lowest consumption.
Sessions with most AI credits used: The sessions that consumed the most AI credits during the selected period, with the start time and the number of AI credits used for each of them. To inspect sessions in more detail, click See more sessions, which takes you to Session explorer.
Groups view
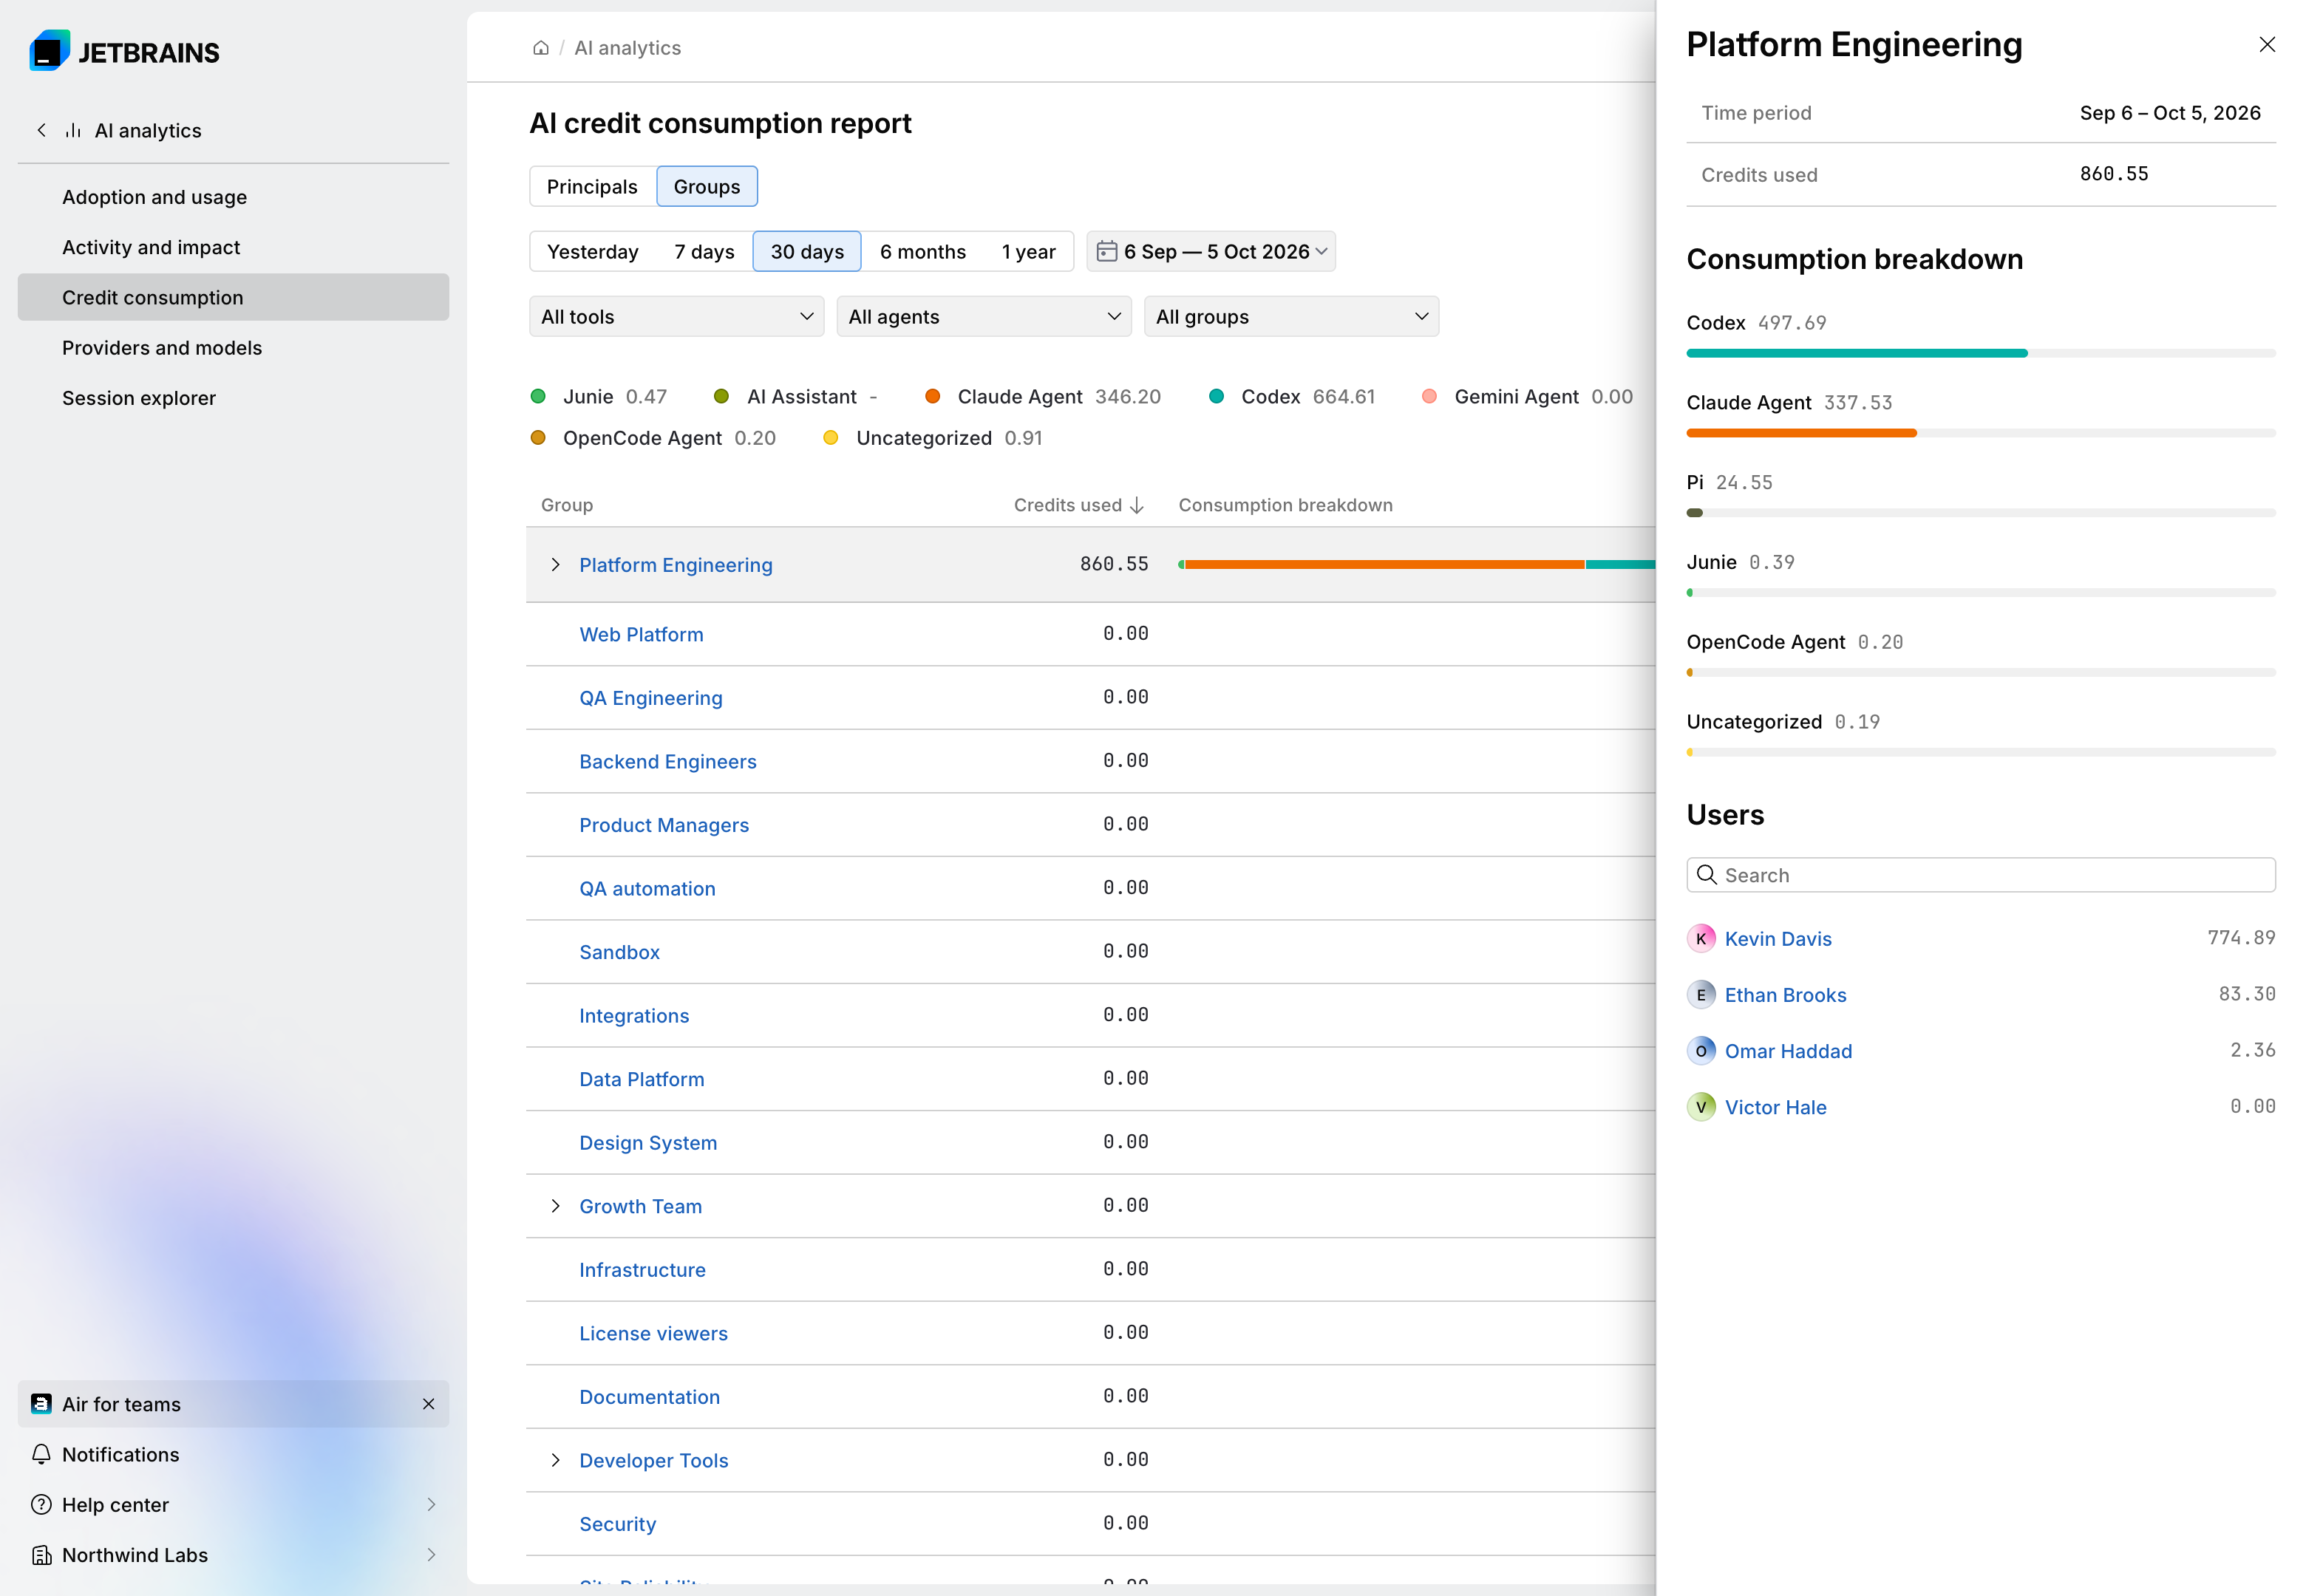
The Groups view breaks the data down by group. This lets you compare AI credit consumption across teams instead of individual consumers. The table includes the following columns:
Group: The name of the group. Expand a group to see its subgroups as nested rows.
Credits used: The number of AI credits used during the selected period by the members of the group, including the members of its subgroups.
Consumption breakdown: A bar that shows how the spending of the group is split between AI agents and tools. The colors of the bar segments match the legend above the table, and the length of the bar is relative to the highest consumption in the table.
Consumption details for a group
To see more details about the spending of a specific group, click its row in the table. This opens a pane with the following information:
The name of the group.
Time period: The period that is currently selected in the time range filter.
Credits used: The total number of AI credits that the group used during the selected period.
Consumption breakdown: The number of AI credits that the group used per AI agent or tool, sorted from the highest to the lowest consumption.
Users: The users in the group and the number of AI credits that each of them spent during the selected period. To find a specific user in the list, type their name in the Search field.