Inspect and fix code
Each C# file that you open in the editor is analyzed on the fly with hundreds of code inspections:
All detected issues are underlined with different colors according to the severity level of the corresponding inspection. For example, red indicates an error (the code will likely not compile), yellow indicates a warning (a compiler warning or suboptimal code), and grey indicates a suggestion (an improvement that can be safely ignored).
Markers on the scrollbar show the relative positions of issues within the file, helping you navigate code issues in large files.
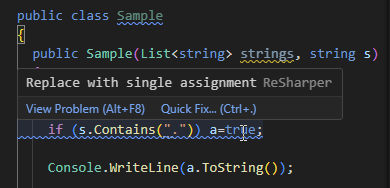
To see why a part of your code is underlined as a code issue, hover over the highlighting:

To go to the next or previous issue in the file, press ⌘ E or ⌘ ⇧ E.
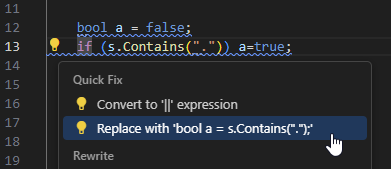
For most detected issues, one or more quick-fixes are available. To see the available fixes, press ⌥ ⏎, then select the desired fix and press ⏎.

In this section:
- Code inspections
- Value and nullability analysis
- Analysis of integer values (integral arithmetic)
- Collection access analysis
- Code analysis and helpers for string literals
- Dispose analysis
- Report and update deprecated APIs
- Use annotations to refine code inspection
- Configure compiler warnings
- List of code inspections