Configure code inspection settings
Configure design-time code inspection
By default, JetBrains Rider enables design-time code inspection in all files corresponding to the supported languages. If necessary, you can disable it. Regardless of whether or not the design-time code inspection is enabled, you can always run code inspection in specific scope.
You can quickly adjust inspection settings right from the editor, using the 'Pencils' widget or go for a more detailed configuration in the settings:
Press Ctrl+Alt+S or choose (Windows and Linux) or (macOS) from the menu , then choose on the left.
Use the Enable code analysis checkbox to toggle the design-time code inspection.
If necessary, you can select the Enable solution-wide analysis checkbox to enable the Solution-wide analysis.
Use other options on that settings page to tune the design-time inspection to your liking.
Click Save in the Settings dialog to apply the modifications and let JetBrains Rider choose where to save them, or save the modifications to a specific settings layer by choosing this layer from the Save selector. For more information, see layer-based settings.
Switch context for multiple target frameworks
The results of code inspection can vary depending on the target .NET Framework because different versions of the framework have different features and capabilities, which can affect the behavior of the code. In most cases, each file belongs to a single project that targets a single .NET Framework, so JetBrains Rider can unambiguously set a specific framework version context for code inspection in that file.
However, there are two cases when a file can be compiled with different framework versions:
Multiple framework versions are defined in the project file where the file belongs.
A file is included in several projects with different framework versions.
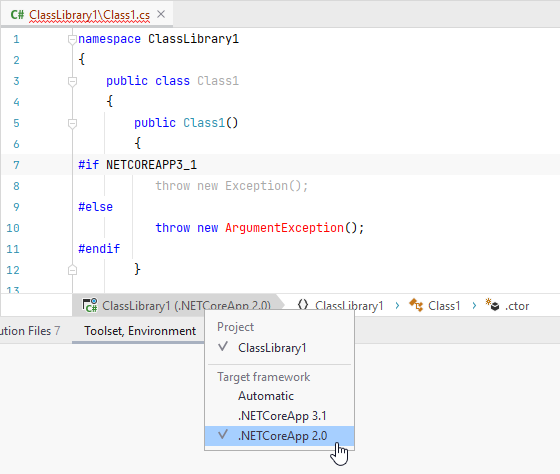
In both cases, the framework version of the current context appears in the editor breadcrumbs, and you can click it to switch the context to another version. In the case of multiple frameworks in the project, the context will be switched for the whole project; otherwise, only the file context will be changed.

In the example above there are two unresolved calls in the file — Exception() and ArgumentException() — but only the second call is highlighted as error because the first one if filtered out for .NETCoreApp 3.1 with the #IF directive and .NETCoreApp 2.0 is selected for analysis.
Exclude files and folders from code inspection
JetBrains Rider allows you to configure the list of files, file masks, and folders that should be excluded from code inspection. The excluded items are ignored by both design-time code inspection and code inspection in specific scope, but they are still indexed by JetBrains Rider, so that you can navigate to or refactor symbols excluded from code inspection.
Exclude specific files and folders from code inspection
Press Ctrl+Alt+S or choose (Windows and Linux) or (macOS) from the menu , then choose on the left.
In the left part of the Elements to skip section, you can specify files or folders to be ignored by the code inspection.
In the right part of this section, you can specify masks (for example *.vb) that will exclude all matching files in the solution from code inspection.
Click Save in the Settings dialog to apply the modifications and let JetBrains Rider choose where to save them, or save the modifications to a specific settings layer by choosing this layer from the Save selector. For more information, see layer-based settings.
You can also quickly exclude the current file from code inspection so that JetBrains Rider adds this file to the list of excluded files without opening the options.
Exclude/include current file from/to code inspection
Press Ctrl+Alt+Shift+8.
You can recognize files where code inspection is disabled by the indicator in the top right corner of the editor.
Partly disable code inspection for generated code
You can also configure the list of files, folders, file masks, and regions that contain generated code. For these items, JetBrains Rider runs only those code inspections that check code for compiler errors and warnings. Some file masks and regions, which are typically used for generated code, for example *.designer.cs are included in this list by default, but you can change the default settings if necessary.
If you use .editorconfig in your solution, you can also mark generated code using the generated_code property. For example:
Specify files and regions with generated code
On the page of JetBrains Rider settings Ctrl+Alt+S, use the Add button to specify files or folders that contain generated code.
In the lower left part of the page, use the Add button to specify masks (for example *.Designer.cs) for generated code files.
In the lower right part of the page, use the Add button to specify names of the regions that contain generated code.
Click Save in the Settings dialog to apply the modifications and let JetBrains Rider choose where to save them, or save the modifications to a specific settings layer by choosing this layer from the Save selector. For more information, see layer-based settings.
Change severity levels of code inspections
Each JetBrains Rider's code inspection has its own default severity level, which is set according to the potential impact of code issues that it detects. Most of the inspections have configurable severity level, which you can change.
You can change the severity level of an inspection right from the editor, where a code issue found by this inspection is highlighted.
Change inspection severity from the editor
Place the caret to a code issue highlighted by a JetBrains Rider's inspection.
Press Alt+Enter or click the action indicator to the left of the caret to open the action list.
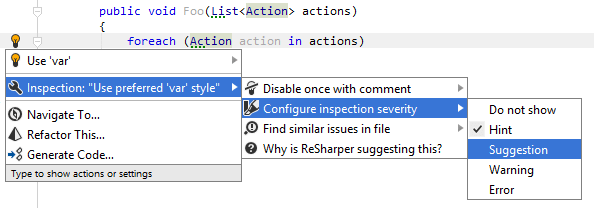
In the action list, choose Inspection [name of inspection] | Configure inspection severity and then select a new severity level:

Your change will be saved using the smart save logic.
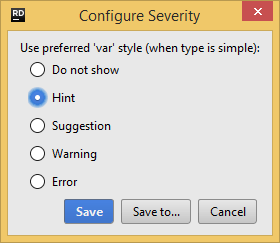
If you need to save the modified severity level in a shared settings layer, click the Configure inspection severity menu item or press Enter when it is selected. In the dialog that appears, choose the desired severity level, click Save To and then choose the desired settings layer.

Another way to save the modified severity level in a shared settings layer, or modifying severity levels of multiple inspections is using the JetBrains Rider Settings dialog Ctrl+Alt+S as described below.
Modify severity levels of code inspections from settings
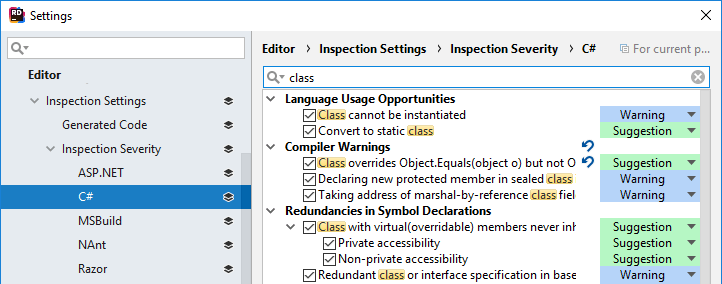
On the page of JetBrains Rider settings Ctrl+Alt+S, you can view all configurable code inspections and their severity levels. The inspections are grouped by languages and then by categories.
Find and select the inspection whose severity you want to modify.
Click the list to the right of the selected entry, and choose a desired severity level:

If the default severity level of an inspection is changed, you will see the Reset to default
.png) button next to it, which allows you to reset the severity to its default value.
button next to it, which allows you to reset the severity to its default value.Click Save in the Settings dialog to apply the modifications and let JetBrains Rider choose where to save them, or save the modifications to a specific settings layer by choosing this layer from the Save selector. For more information, see layer-based settings.
Disable/enable specific code inspections
If some code inspection seems trivial or being of no interest to you, you can disable this inspection so that no relevant issues would be highlighted in the editor or detected when you run code inspection in specific scope. You can enable a disabled code inspection any time later. Some inspections are disabled by default and you can enable them if necessary.
You can disable any code inspection in one of the following ways:
If there is a code issue highlighted by this inspection in the editor, place the caret at the highlighted code, press Alt+Enter and then choose Inspection [name of inspection] | Configure inspection severity | Do not show.
On the page of JetBrains Rider settings Ctrl+Alt+S, use the search field to find the inspection you want to disable or enable, and then use the checkbox next to it.
The disabled/enabled state of inspections is saved in the shared settings layers, exactly the same way as changes to severity levels.
Use EditorConfig to configure code inspections
If you use EditorConfig to maintain code styles for your project, you can also configure code inspections from .editorconfig files.
To configure code inspections from EditorConfig, you have to select the Read settings from editorconfig, project settings and rule sets checkbox on the page of JetBrains Rider settings Ctrl+Alt+S.
As EditorConfig convention suggests, JetBrains Rider will apply inspection settings defined in files named .editorconfig in the directory of the current file and in all its parent directories until it reaches the root filepath or finds an EditorConfig file with root=true. File masks specified in .editorconfig files, for example *Test.cs are also taken into account.
Inspection settings in .editorconfig files are configured similarly to other properties — by adding the corresponding lines:
For example, you can change the severity level of the Possible 'System.NullReferenceException' inspection to Error with the following line:
or you can disable the Redundant argument with default value inspection with the following line:
You can find EditorConfig property for each inspection on pages in the Code inspection index section as well as on the Index of EditorConfig properties page. — just use the browser search to find the property for the desired inspection.
Suppress code inspections in specific scope
One way to ignore specific code issues is to disable the corresponding code inspection. In this case, all code issues detected by this inspection will be ignored everywhere.
Sometimes you may need to suppress a specific inspection in a specific place, while continue to detect other similar issues with this inspection in other places.
For example, JetBrains Rider considers some code to be 'dead' and you can see that it is true. The inspection is helpful and you do not want to disable it. However, you may want to use this code later and do not want it to be highlighted in the editor or appear in the inspection results. To do so, JetBrains Rider allows you to suppress inspections with comments or with attributes. Comments are more convenient for arbitrary pieces of code, attributes are preferable to suppress inspections in whole methods or types.
Suppress code inspection in specific scope
Place the caret to a code issue highlighted by a JetBrains Rider's inspection.
Press Alt+Enter or click the action indicator to the left of the caret to open the action list.
In the action list, choose one of the following:
Inspection [name of inspection] | Disable once with comment — this option inserts a single comment
ReSharper disable once [inspection id], which only suppresses the inspection for the first occurrence of the corresponding issue.Inspection [name of inspection] | Disable once with comment | Disable in file with comment — this option inserts a single comment -
ReSharper disable [inspection id]in the beginning of the file. This comment suppresses the inspection for all corresponding issues in the file.Inspection [name of inspection] | Disable once with comment | Disable and restore with comment — this option inserts a pair of comments before and after the issue -
ReSharper disable [inspection id]andReSharper restore [inspection id]. These comments suppress the inspection for all corresponding issues between them.You can then move these comments to other places in the file so that several issues of this type are suppressed. For example, this can be useful to suppress the 'redundant namespace' inspection if you want to keep several unused namespace imports.
Inspection [name of inspection] | Disable once with comment | Disable for method — this option adds the following attribute to the method:
[SuppressMessage("ReSharper", "[inspection id]")]. This attribute suppresses the inspection in the method.Inspection [name of inspection] | Disable once with comment | Disable for class — this option adds the following attribute to the class:
[SuppressMessage("ReSharper", "[inspection id]")]. This attribute suppresses the inspection in the whole class.Inspection [name of inspection] | Disable once with comment | Disable all inspection in file — this option inserts a single comment
ReSharper disable Allin the beginning of the file. This comment suppresses all inspections in the file.If necessary, you can insert the
ReSharper restore Allto enable code inspections after a specific line.
To suppress all inspections in a type or a method, add the following attribute: [SuppressMessage("ReSharper", "All")].