Code inspections
JetBrains Rider provides over 2500 code inspections in all supported languages. These inspections are applied to detect and highlight code issues in design time in all opened files , and/or to find all code issues in specific scope, which can be as large as the entire solution .
To find out what kind of code inspections JetBrains Rider provides, check out the full list of JetBrains Rider code inspections in different languages.
Code inspections can be divided into the following groups:
Inspections with the fixed severity level 'Error'. These inspections detect compiler errors and there is no way to disable or configure them.
Inspections with configurable severity levels, which detect the rest of code issues (for example, compiler warnings, runtime and logical errors, code smells, redundancies, improvement suggestions, and so on). You can find these configurable inspections on the page of JetBrains Rider settings Ctrl+Alt+S. These inspections can be configured in several ways — you can suppress the detected issues with comments and attributes, disable them or change their severity level in settings or in .editorconfig files.
Severity levels of code inspections
Each JetBrains Rider code inspection has one of the following severity levels:
Error
Code inspections with this severity level are aimed at code issues that either prevent your code from compiling or result in runtime errors. Most of these inspections are not configurable, that is you cannot disable them or change their severity level.
In design-time inspection, JetBrains Rider displays unresolved symbols in red:

and highlights erroneous statements or part of them with a red curly underline:

If there is at least one error in the current file, the status indicator displays the Error ![]() icon, and red markers are shown for each error on the error stripe.
icon, and red markers are shown for each error on the error stripe.
Code issues that are found with inspections having the 'Error' severity level, appear in the All Solution Files tab of the Problems tool window Alt+6 if the solution-wide analysis is enabled.
Warning
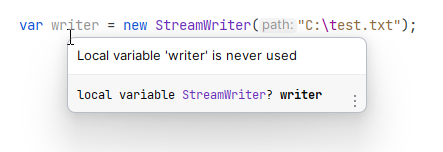
This severity level corresponds to compiler warnings and to other issues that do not prevent your code from compiling but may nevertheless represent serious coding inefficiencies. For example, JetBrains Rider informs you about redundant type casts or namespace import directives, incorrect format strings, declared but never used local variables or private fields, unused private methods, and so on.
In design-time inspection, JetBrains Rider displays redundant symbols with greyed text:

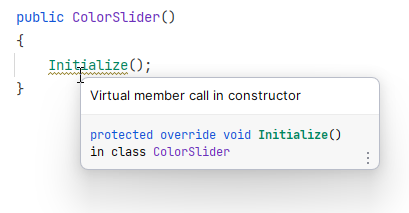
and highlights statements or part of them with a yellow curly underline:

If there is at least one warning in the current file, the status indicator displays the Warning ![]() icon, and yellow markers are shown for each warning on the error stripe.
icon, and yellow markers are shown for each warning on the error stripe.
Warnings also appear in the All Solution Files tab of the Problems tool window Alt+6 if the solution-wide analysis with warnings is enabled
Suggestion
Code issues with this severity level provide insights into code structure, drawing your attention to things that aren't necessarily bad or wrong, but probably useful to know.
In design-time inspection, JetBrains Rider highlights suggestions with a green curly underline:

and adds green markers for each warning on the error stripe.
Hint
This is the lowest severity level. Code issues with this severity bring your attention to a particular code detail and/or recommends a way of improvement.
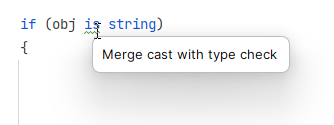
In design-time inspection, JetBrains Rider highlights hints by adding a dashed green underline to the initial two letters of the corresponding symbol:

Unlike errors, warnings and suggestions, hints are not taken into account when you navigate between code issues in the editor, and not shown in the error stripe.
Note that when you place the caret over a highlighted hint, no popup is shown, the corresponding message only appears in the status bar.
When you inspect code in specific scope, JetBrains Rider adds corresponding icons to the detected issues and allows sorting issues by the severity level in the Problems window.
Categories of code inspections
JetBrains Rider groups configurable code inspections by several categories. These categories roughly define purposes of inspections and kinds of code issues that they detect. The categories are used to group code inspections on the page of JetBrains Rider settings Ctrl+Alt+S, and to group code issues found in specific scope and displayed in the Problems window.
- Potential Code Quality Issues
This category includes inspections that detect critical issues (code smells), mostly with Error or Warning level. This category also includes inspections that ensure localization assistance.
- Common Practices and Code Improvements
This category groups inspections that hunt for medium severity issues that mainly affect code readability.
- Redundancies in Code
Code inspections in this category look for redundancies and dead code, which affect code readability and style, and could be safely removed. Some code redundancies cannot be fixed automatically, and quick-fixes for them are performed in the interactive mode, requiring the user input. But the majority of the redundancies can be fixed without user interaction, using either fix in scope or code cleanup.
- Language Usage Opportunities
This category includes code inspections, mostly with the suggestion severity level, which notify you when more advanced language constructs can be used. These inspections detect syntax of outdated language versions and suggest using features from more modern language versions. For most of the supported languages, language version can be detected automatically or set manually.
- Code Notifications
This category groups code inspections with minor severity levels.
- Code Style
Inspections in this category detect violations of code syntax styles. In contrast to most code inspections, these inspections can either detect the same code construct as a code issue or not depending on the corresponding code style rule configured on the page of JetBrains Rider settings Ctrl+Alt+S. You can also fix issues that these inspection detect using code cleanup.
- Constraints Violations
This category includes code inspections, mostly with the warning severity level, which detect violations related to symbol attributes, including JetBrains Rider's code annotations, and other similar issues.
- Redundancies in Symbol Declaration
This category includes code inspections, mostly with the warning severity level, which detect empty and unused symbol declarations.
- Compiler Warnings
Inspections in this category detect compiler warnings before you compile.
- Spelling Issues
These inspections detect typos in various contexts.
- NUnit
These inspections detect code issues related to NUnit tests.
- Xunit
These inspections detect code issues related to xUnit.Net tests.
- Formatting
Inspections in this category detect code formatting problems.
- Clang-Tidy Checks
Inspections in this category are provided by Clang-Tidy — a powerful open-source code analysis tool integrated with JetBrains Rider.
- Clang
Inspections in this category correspond to Clang compiler warnings integrated with JetBrains Rider.
- Clang Static Analyzer Checks
Inspections in this category are diagnostics from Clang Static Analyzer integrated with JetBrains Rider.
All static analyzer checks are disabled by default, since enabling them significantly slows down Clang-Tidy.
- Unreal Engine
Inspections in this category are specific to Unreal Engine projects.
- Unreal Build System
Inspections in this category are specific to Unreal Engine projects.
- Unity
Inspections in this category report code issues specific to Unity projects.
- Unity Burst Compiler Warnings
Inspections in this category report warnings of the Unity Burst Compiler before the code is actually compiled.
- Unity Performance Inspections
Inspections in this category report computationally inefficient patterns Unity projects.
Identifiers of configurable code inspections
Each configurable code inspection has two unique identifiers that you can use to configure it. Let's take the Possible 'System.NullReferenceException' inspection as an example:
- Inspection ID
is used to suppress the inspection with a comment for a single issue:
// ReSharper disable once PossibleNullReferenceExceptionor from the comment to the end of the file:
// ReSharper disable PossibleNullReferenceExceptionor, alternatively with an attribute for a type or a method:
[SuppressMessage("ReSharper", "PossibleNullReferenceException")].
- Inspection EditorConfig property
can be used to configure the inspection from .editorconfig files. For example, you can change the inspection's severity level to Error with the following line:
resharper_possible_null_reference_exception_highlighting=error
You can find identifiers for each configurable inspection in the Code inspection index — just choose a language page and then use the browser search to find the details of the desired inspection.