What's New in ReSharper 2026.1
Welcome to the ReSharper 2026.1 release overview. This version is designed to make everyday .NET development more comfortable and efficient, with:
- Enhanced performance monitoring – All runtime behavior insights can now be displayed in a single tool window.
- Expansion beyond Visual Studio – Use ReSharper in VS Code–compatible editors like Cursor and Google Antigravity.
- Improved C# support – Better handling of extension members, new inspections, and early support for upcoming features.
- More stable Out-of-Process mode – Over 70 fixes for improved reliability.
- Modernized editor UI – Updated completion, tooltips, and popups with better scaling.
Evolved performance monitoring
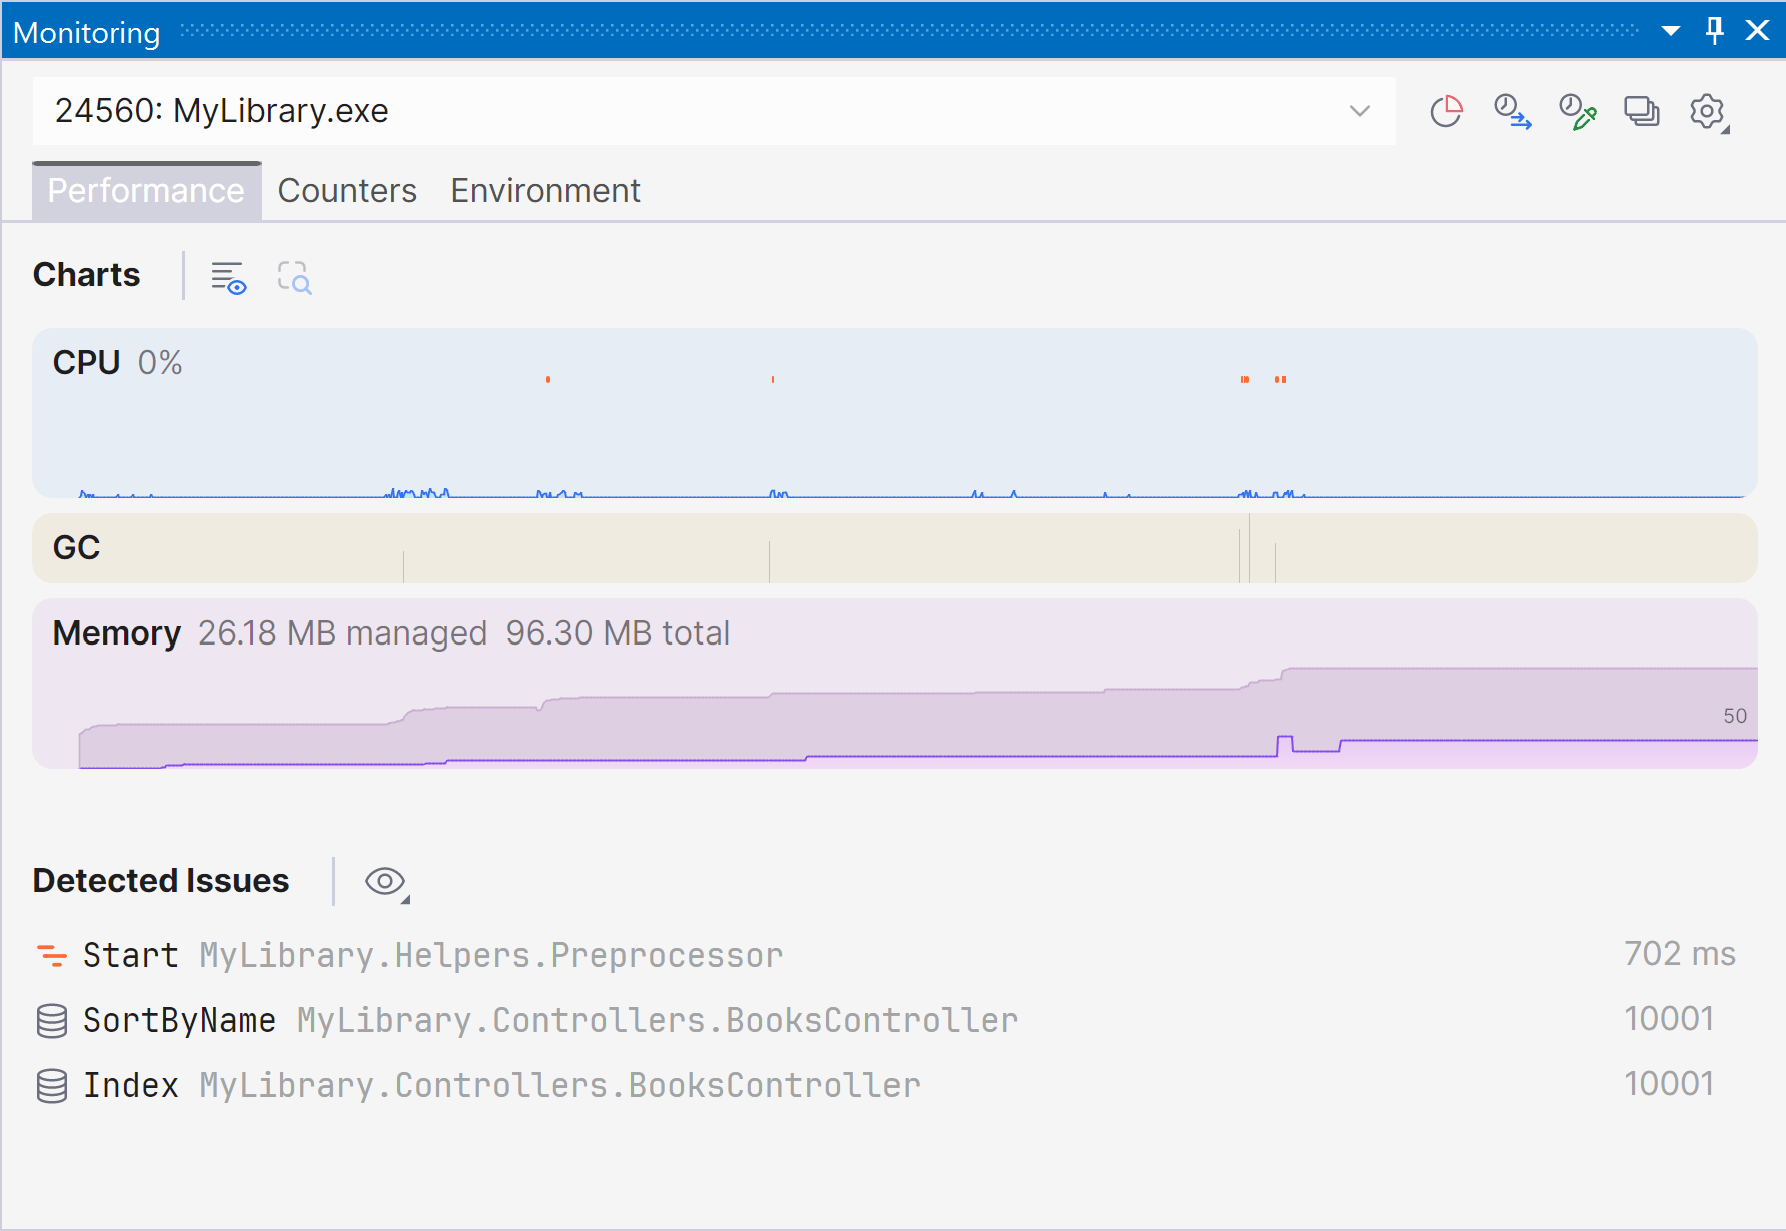
Marking a new step in the evolution of performance monitoring, ReSharper 2026.1 introduces the Monitoring tool window. This new dedicated tool window provides a clearer, more complete picture of runtime performance and offers automated issue detection to help you identify optimization opportunities.
The Monitoring tool window lets you observe key runtime metrics of your application as it runs or during debugging. It builds on the capabilities already previously available through our .NET profiling tools and Dynamic Program Analysis (DPA), but brings them together in a single view that makes it easier to evaluate runtime behavior at a glance.
Starting with ReSharper 2026.1, the Monitoring tool window is available when using ReSharper as part of the dotUltimate subscription.
The Dynamic Program Analysis (DPA) feature will be retired in the 2026.2 release, while its core capabilities will continue to be provided through the new monitoring experience.
Current limitations:
The Monitoring tool window is not currently supported in Out-of-Process mode. We are working to remove this limitation in ReSharper 2026.2.
For more details on how monitoring works and how to use it, see our documentation.
Expansion to VS Code-compatible editors
ReSharper is now available for Visual Studio Code and compatible editors such as Cursor and Google Antigravity, bringing JetBrains’ C# tooling to your editor of choice.
The extension provides real-time code analysis, refactorings, and navigation for C#, XAML, Razor, and Blazor. It also includes a Solution Explorer for managing projects and source generators, as well as built-in unit testing support for NUnit, xUnit.net, and MSTest.
ReSharper for VS Code and compatible editors is available under the ReSharper, dotUltimate, and All Products Pack subscriptions. A free subscription is also available for non-commercial use.
Learn more in this dedicated blog post.
Language support
Improved support for C# extensions
ReSharper 2026.1 expands its support for C# extension members, helping you work more efficiently with the evolving language features.
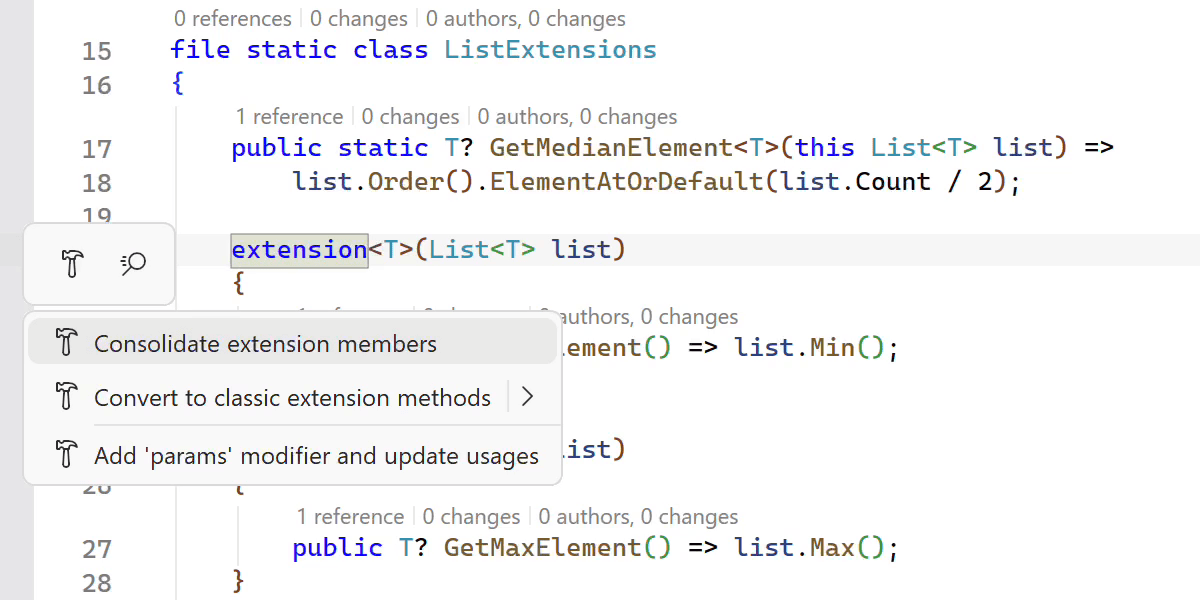
A new Consolidate extension members context action merges compatible extension declarations and classic extension methods into a single block. The Import extension member quick-fix has also been improved and now supports all kinds of extension members, automatically adding missing using directives when needed.
We’ve also improved navigation and refactoring for extension members. ReSharper can now decompile extension blocks and navigate to generated sources, and the Extension Method to Plain Static refactoring now works with methods declared inside extension blocks.
Early support for upcoming C# language features
ReSharper 2026.1 introduces early support for upcoming C# language updates, helping you experiment with new syntax as the language evolves.
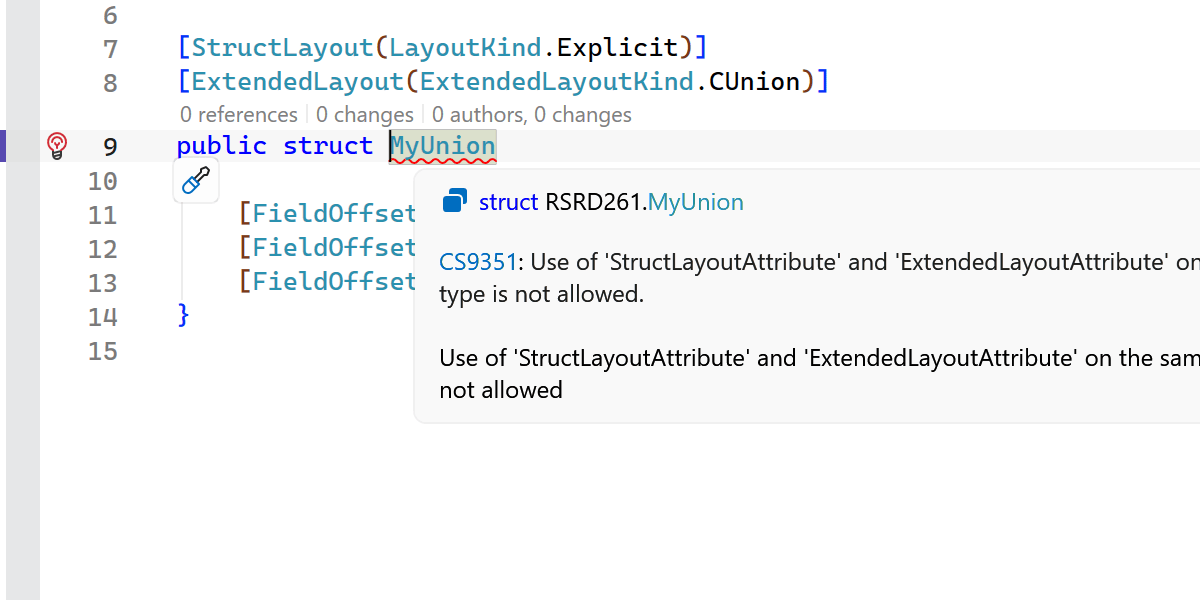
This release includes initial support for collection expression arguments and support for the [ExtendedLayout] attribute, ensuring ReSharper continues to work smoothly with the latest compiler innovations.
New inspections and code style options
This release adds several new inspections and style options to help you write safer and more consistent code.
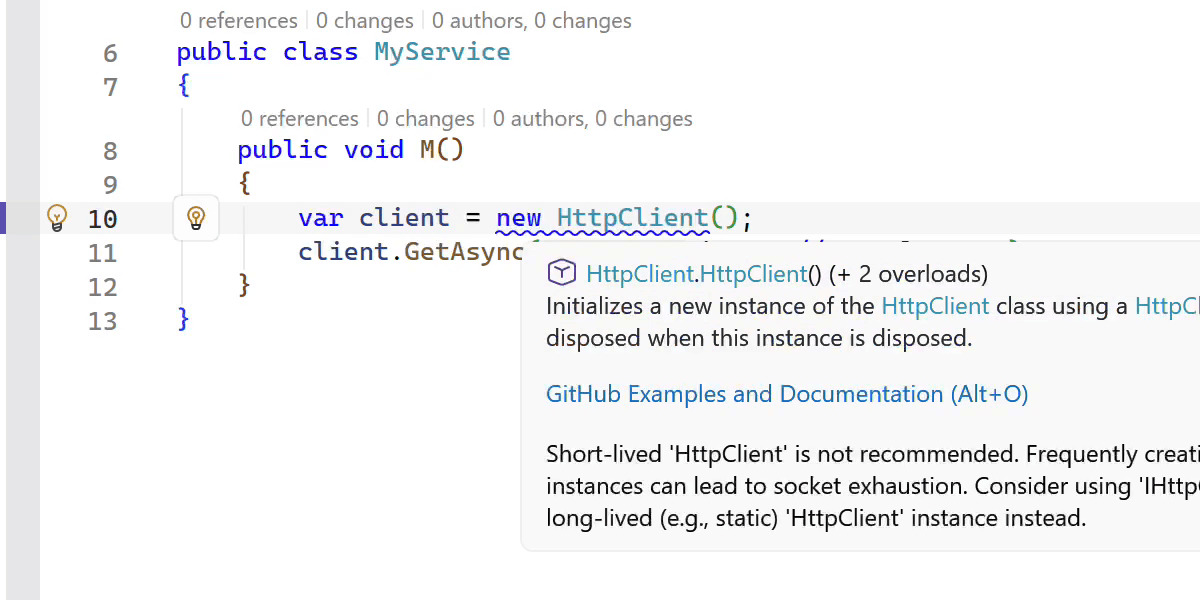
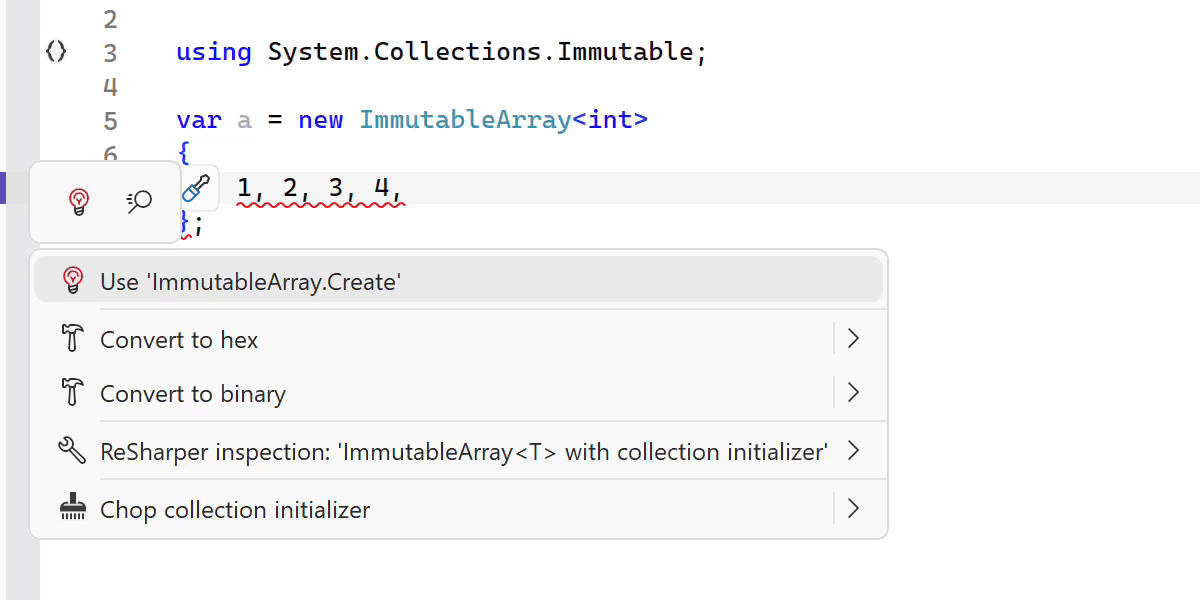
ReSharper now detects short-lived HttpClient instances and suggests safer reuse patterns. It also warns you when ImmutableArray<T> is used with collection initializers, which can lead to a runtime NullReferenceException.
Additional improvements include:
- A new inspection for enforcing the order of accessor methods in properties and events.
-
A syntax style option for empty strings, allowing you to choose between
string.Emptyand"". -
Improved nullable reference type migration, with an option to insert
#nullable enableautomatically in new files. -
Enhanced code completion that can generate method definitions based on
[LoggerMessage]attributes.
Faster indexing, code completion, and analysis
This release brings several performance improvements across indexing, code completion, and code analysis.
We reworked the indexing of annotated type members defined in assemblies, making it significantly faster and more memory efficient.
Import completion is now more responsive by eliminating certain expensive computations.
We also optimized several performance-critical code paths by reducing costly interface type checks, resulting in faster code analysis and lower overall overhead.
C++ improvements
ReSharper 2026.1 improvements to C++ support include:
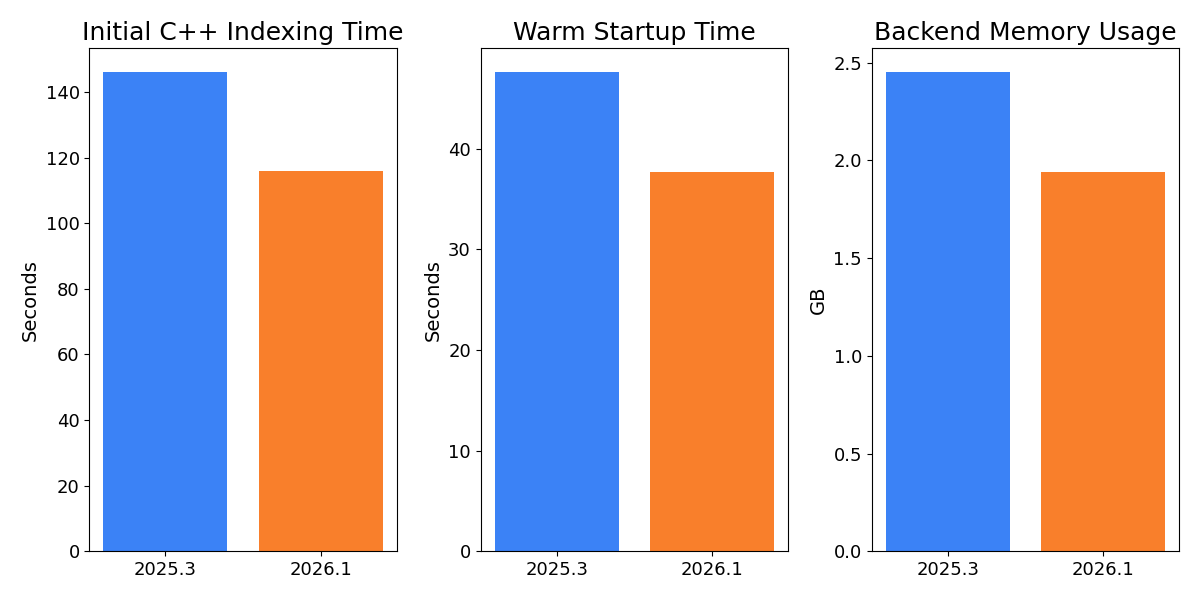
- Performance: Faster startup times and lower memory usage in Unreal Engine projects.
-
Language support: Support for the C23/C++26
#embeddirective, C++23 extended floating-point types, the C2Y_Countofoperator, and other features. - Coding assistance: Auto-import for C++20 modules and postfix completion for primitive types, literals, and user-defined literal suffixes.
- Code analysis: New inspections for out-of-order designated initializers and override visibility mismatches, update of bundled Clang-Tidy to LLVM 22.
- Unreal Engine: Richer Blueprint integration in Code Vision and Find Usages, compatibility fixes for the upcoming Unreal Engine 5.8.
Learn more about the C++ updates from the What's New in ReSharper C++ 2026.1 page.
Improved stability in Out-of-Process mode
We continue to improve the stability of ReSharper’s Out-of-Process (OOP) mode, which improves responsiveness and resilience by separating ReSharper’s backend from Visual Studio.
In this release, we resolved over 70 issues and made improvements related to the Out-of-Process architecture. The fixes address problems across a wide range of scenarios, including navigation (particularly Peek actions), UI interactions, unit testing sessions, and solution state synchronization.
The .NET runtime used by ReSharper in Out-of-Process (OOP) mode has also been updated to .NET 10.
Modernized completion and popup UI
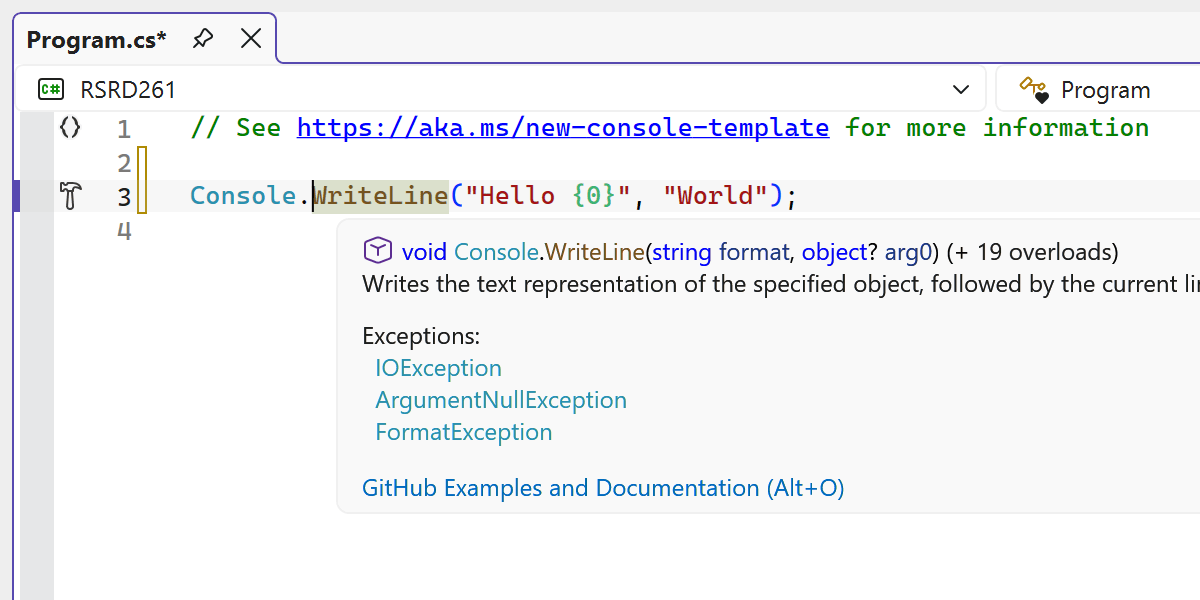
Several editor UI elements in ReSharper have been refreshed to better align with the modern look of the Visual Studio experience.
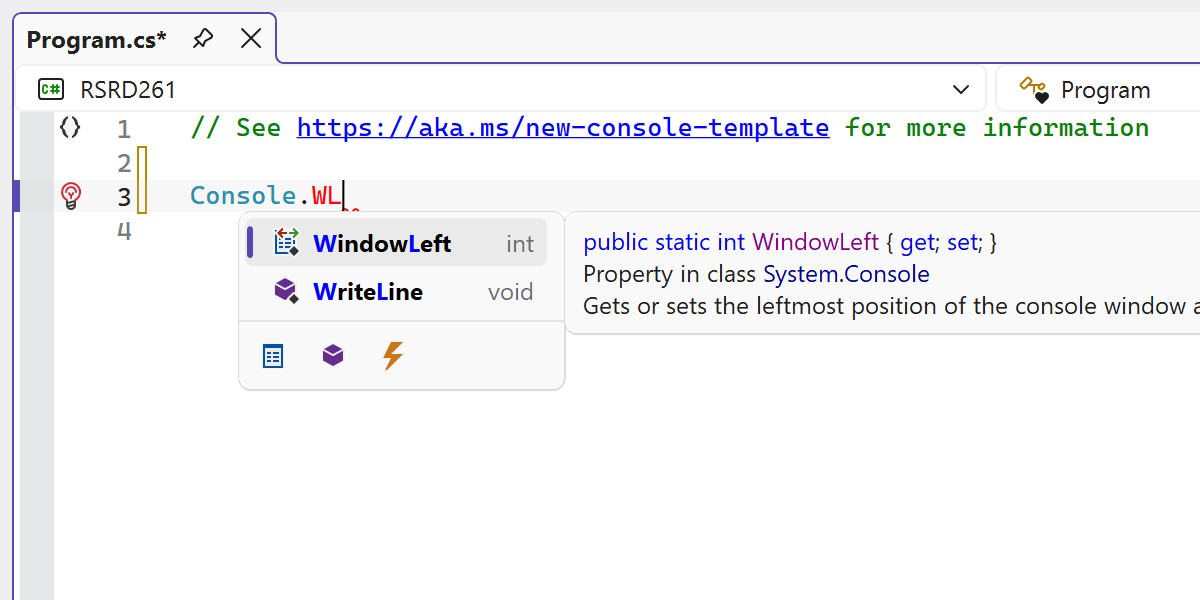
Thanks to a redesign, the code completion UI now provides a cleaner and more consistent look within the editor.
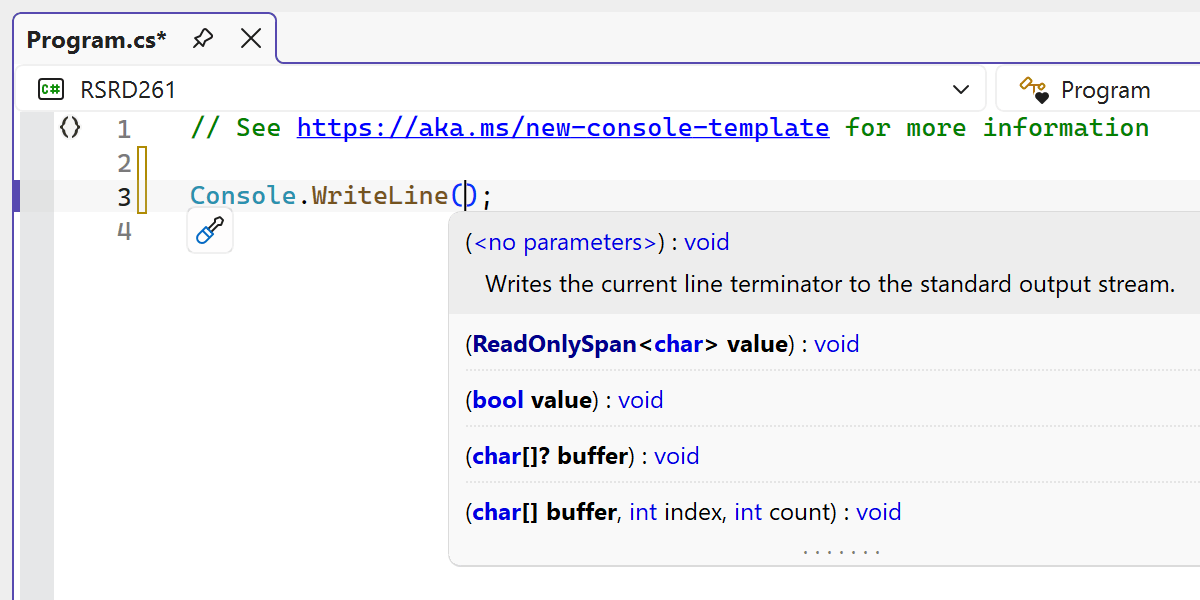
We also modernized a number of related UI components, including parameter info popups, tooltips, and other editor popups, replacing outdated visuals and improving their appearance across themes and DPI settings.
The updated UI now supports Visual Studio’s editor zoom feature, ensuring completion lists and parameter info scale correctly when zoom levels change.