Automatic Inspections
Detect common memory issues - automatically.
Memory profiling on autopilot 👩✈️
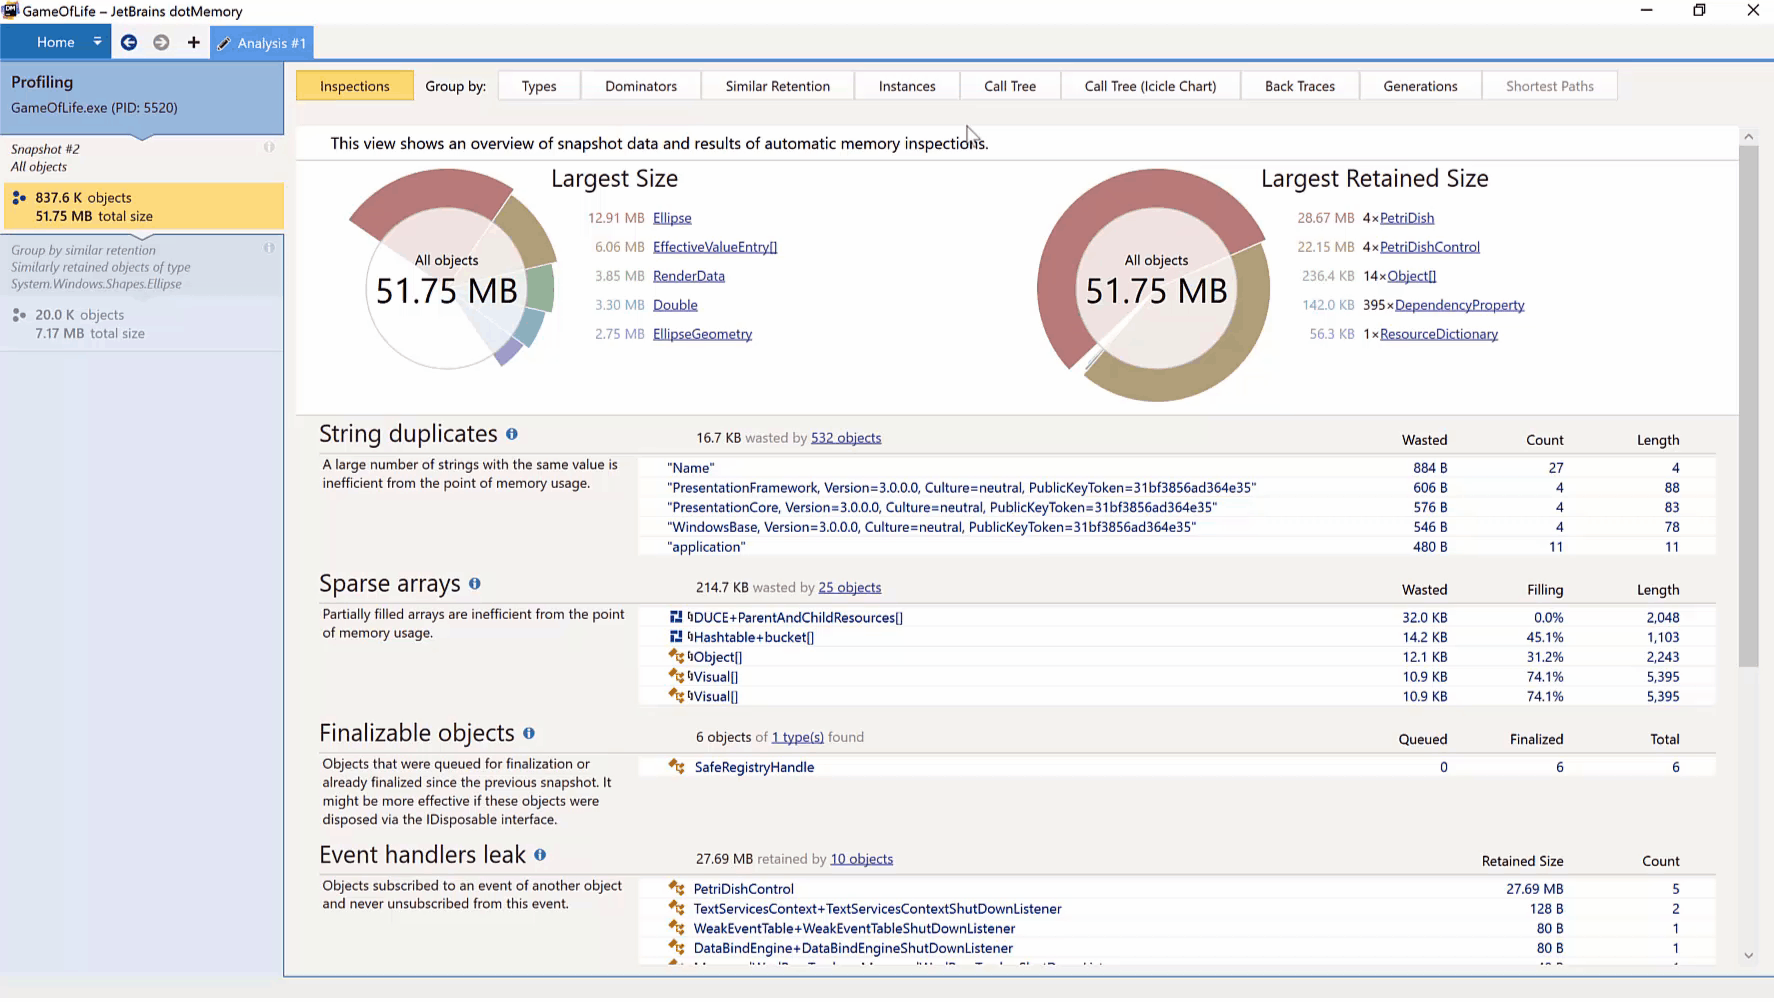
While profiling, dotMemory runs automatic inspections for common memory issues.
Get information on wasteful duplicate strings, sparse arrays holding more memory than they are using, finalized objects, and expensive event handler leaks.
Always a great start to any memory investigation!