Quick start guide
New to RustRover? This guide will help you explore the IDE's workspace and features and try out all the main aspects of the Rust development process.
1. Open or create a Rust project
You have three options to start working on a Rust project.
Create a new Cargo project
Launch RustRover.
To start a new project, do one of the following:
Click New Project on the Welcome screen.
Select from the main menu.
Click the Project widget in the main window header and select New Project.

In the left-hand pane, make sure Rust is selected.
Specify the project location and name.
Specify the location of the Rust toolchain and standard library.
If the toolchain and standard library are installed, RustRover will detect them automatically. Otherwise, you will be suggested to download Rustup.

Select the desired project template and click Create.

Open a local Cargo project
In the main menu, go to . In the file chooser, select the directory containing the root Cargo.toml file (or Cargo.toml itself) and click Open:
")
In the dialog that opens, select Open as project.

When opening the project for the first time, RustRover will prompt you to confirm that you consider it safe.

Click Trust Project if you are certain the project poses no threats and you would like to enable all IDE features. If you have any doubts, select Preview in Safe Mode. For more information, refer to Project security.

Clone a repository from VCS
In the main menu, go to or click Get from VCS on the Welcome screen.
Specify the repository URL and the destination directory. Click Clone:

2. Explore the workspace and features
RustRover's feature set is designed to simplify the Rust development process. Let's take a closer look at what it has to offer.
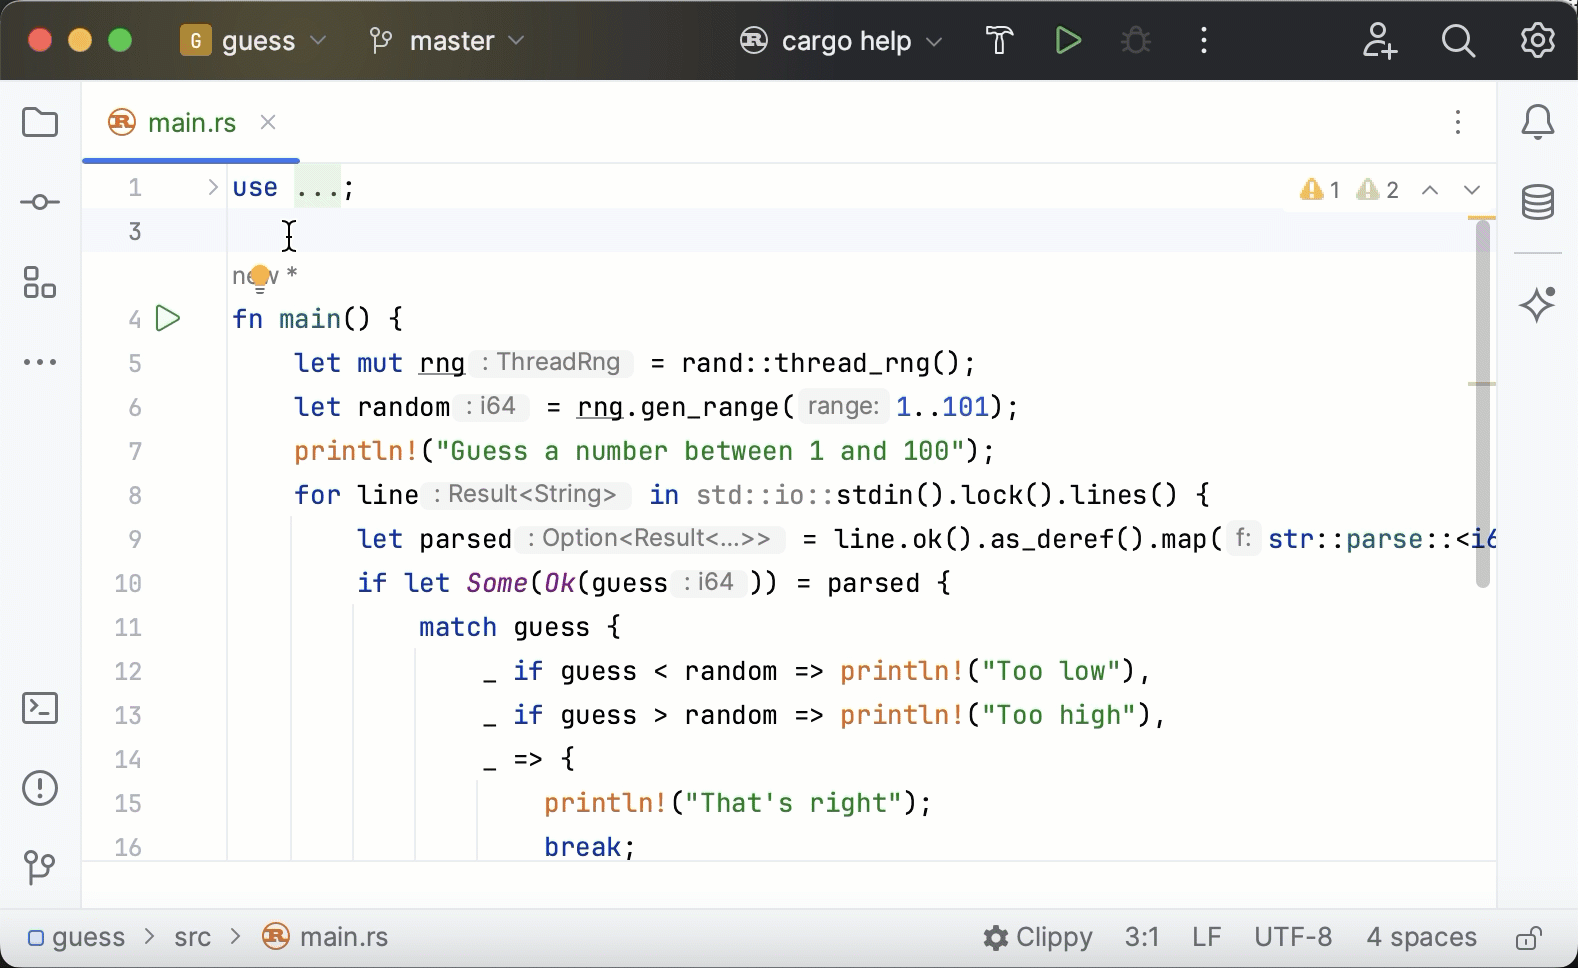
Syntax highlighting and code reference
To help you quickly read and understand Rust code, RustRover provides highlighting, inlined hints, macro expansion, quick access to documentation, and more.
Here are some shortcuts you may find useful:
Action | Shortcut |
|---|---|
Alt+Enter | |
Go to declaration | Ctrl+Click |
Get type info | Ctrl+Shift+P |
Ctrl+Q | |
Ctrl+Shift+I |
For more information, refer to Code reference information.
Code analysis and error reporting
To help you fight errors and inconsistencies in code, RustRover offers built-in inspections and integrates with external linters.
For a summary of all detected problems, use the Inspections widget in the upper-right corner of the editor. To see the details, click the widget and refer to the Problems tool window (or select ):

Inspections
Inspections run on the fly for all files currently open in the editor. You can also run them manually for a larger scope. To view inspection results, use the Problems tool window ().
RustRover will suggest quick-fixes and intentions where possible. Quick fixes are marked with a red bulb (![]() ) and address errors. Intentions are marked with a yellow bulb (
) and address errors. Intentions are marked with a yellow bulb (![]() ) and suggest possible enhancements and optimizations.
) and suggest possible enhancements and optimizations.
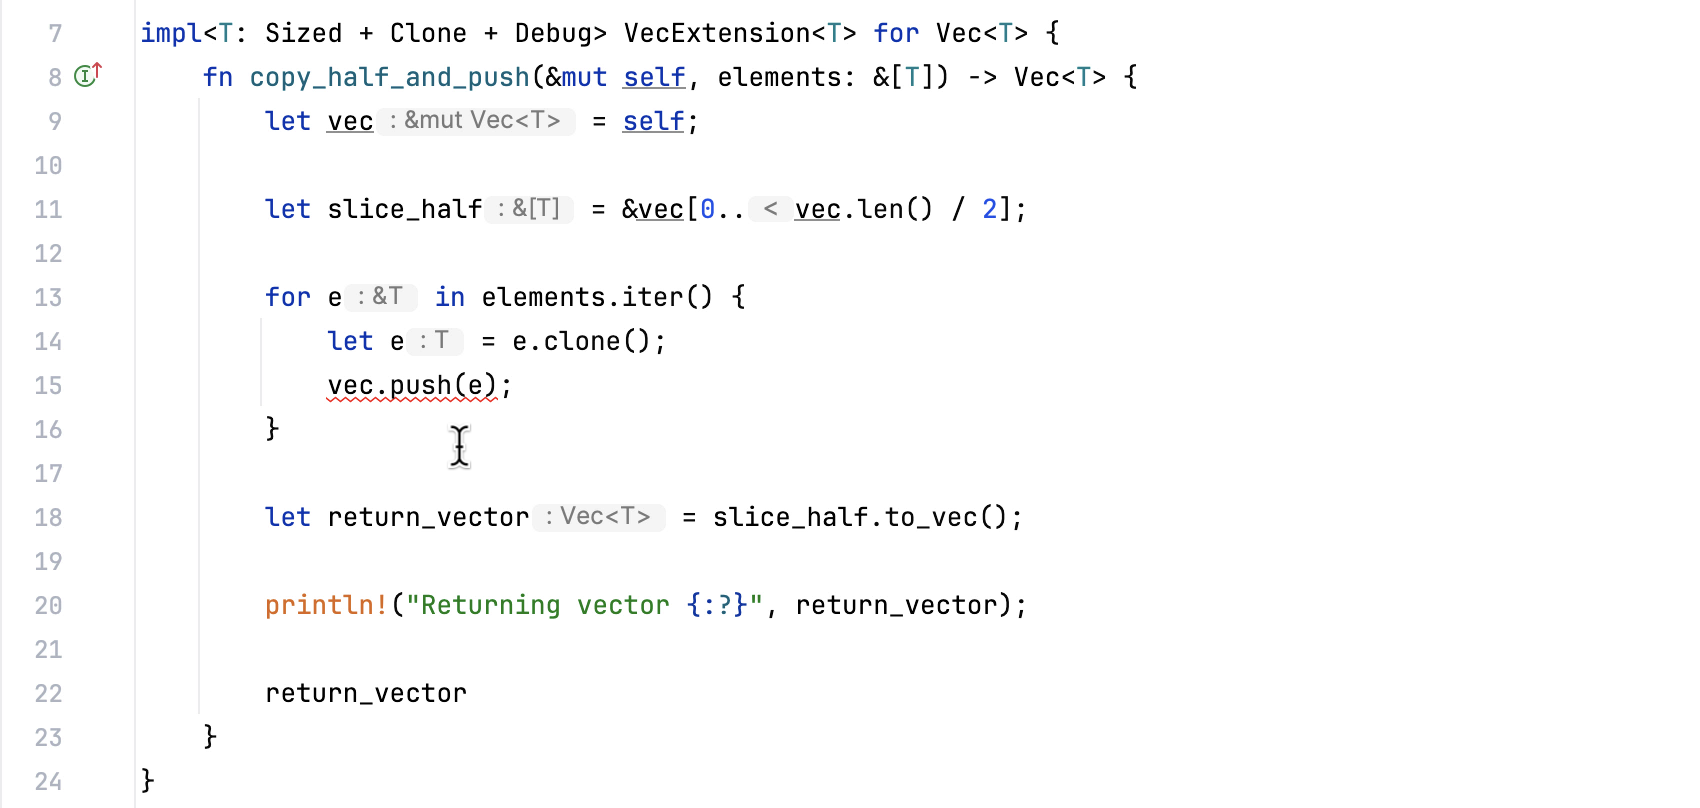
Apply a quick-fix/intention
If an inspection has detected a problem in your code, you can quickly apply a fix in the editor. Place the caret at the highlighted piece of code and press Alt+Enter.

For more information, refer to Code inspections.
External linters
In addition to the built-in set of inspections, RustRover uses external linters to verify your code. You can choose between Cargo Check and Clippy and preset the calls the way you like.
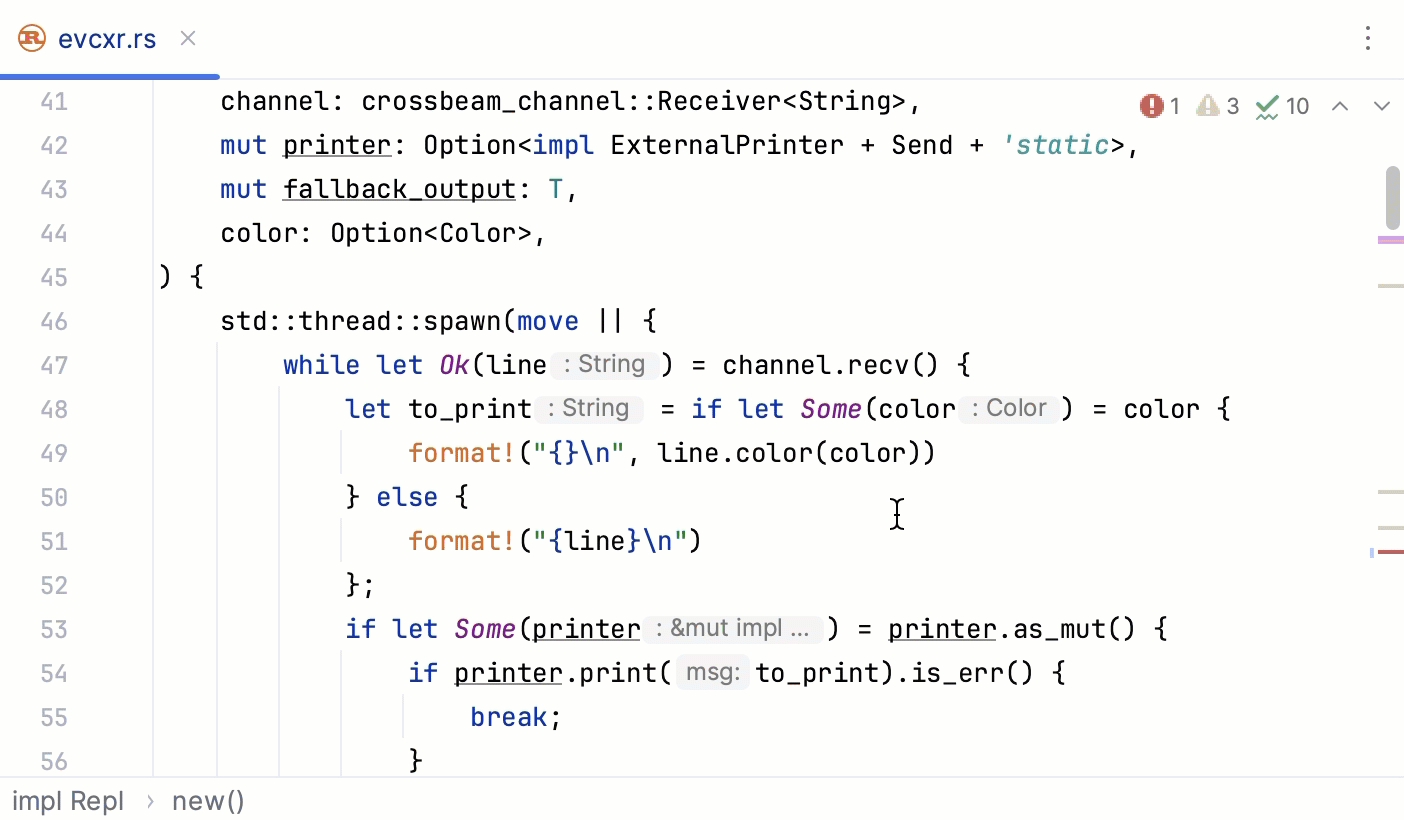
With an external linter running on the fly, you can enjoy the variable lifetime visualization feature: whenever the linter reports a borrow checker error, simply click the variable and you will see a visualization of its lifetime.
For more information, refer to External linters.
Formatting
You can easily format your code using either the IDE's built-in formatter or Rustfmt (enabled by default).
Enable (or disable) Rustfmt instead of the built-in formatter
Open settings by pressing Ctrl+Alt+S and navigate to .
To enable Rustfmt, set the Use Rustfmt instead of built-in formatter checkbox. To disable Rustfmt, clear the checkbox.

Click OK to apply the changes.
Reformat a file
Open the file you want to reformat in the editor.
Press Ctrl+Alt+Shift+L or select .
In the dialog, select additional options if necessary and click .

For more information, refer to Built-in formatter and Rustfmt.
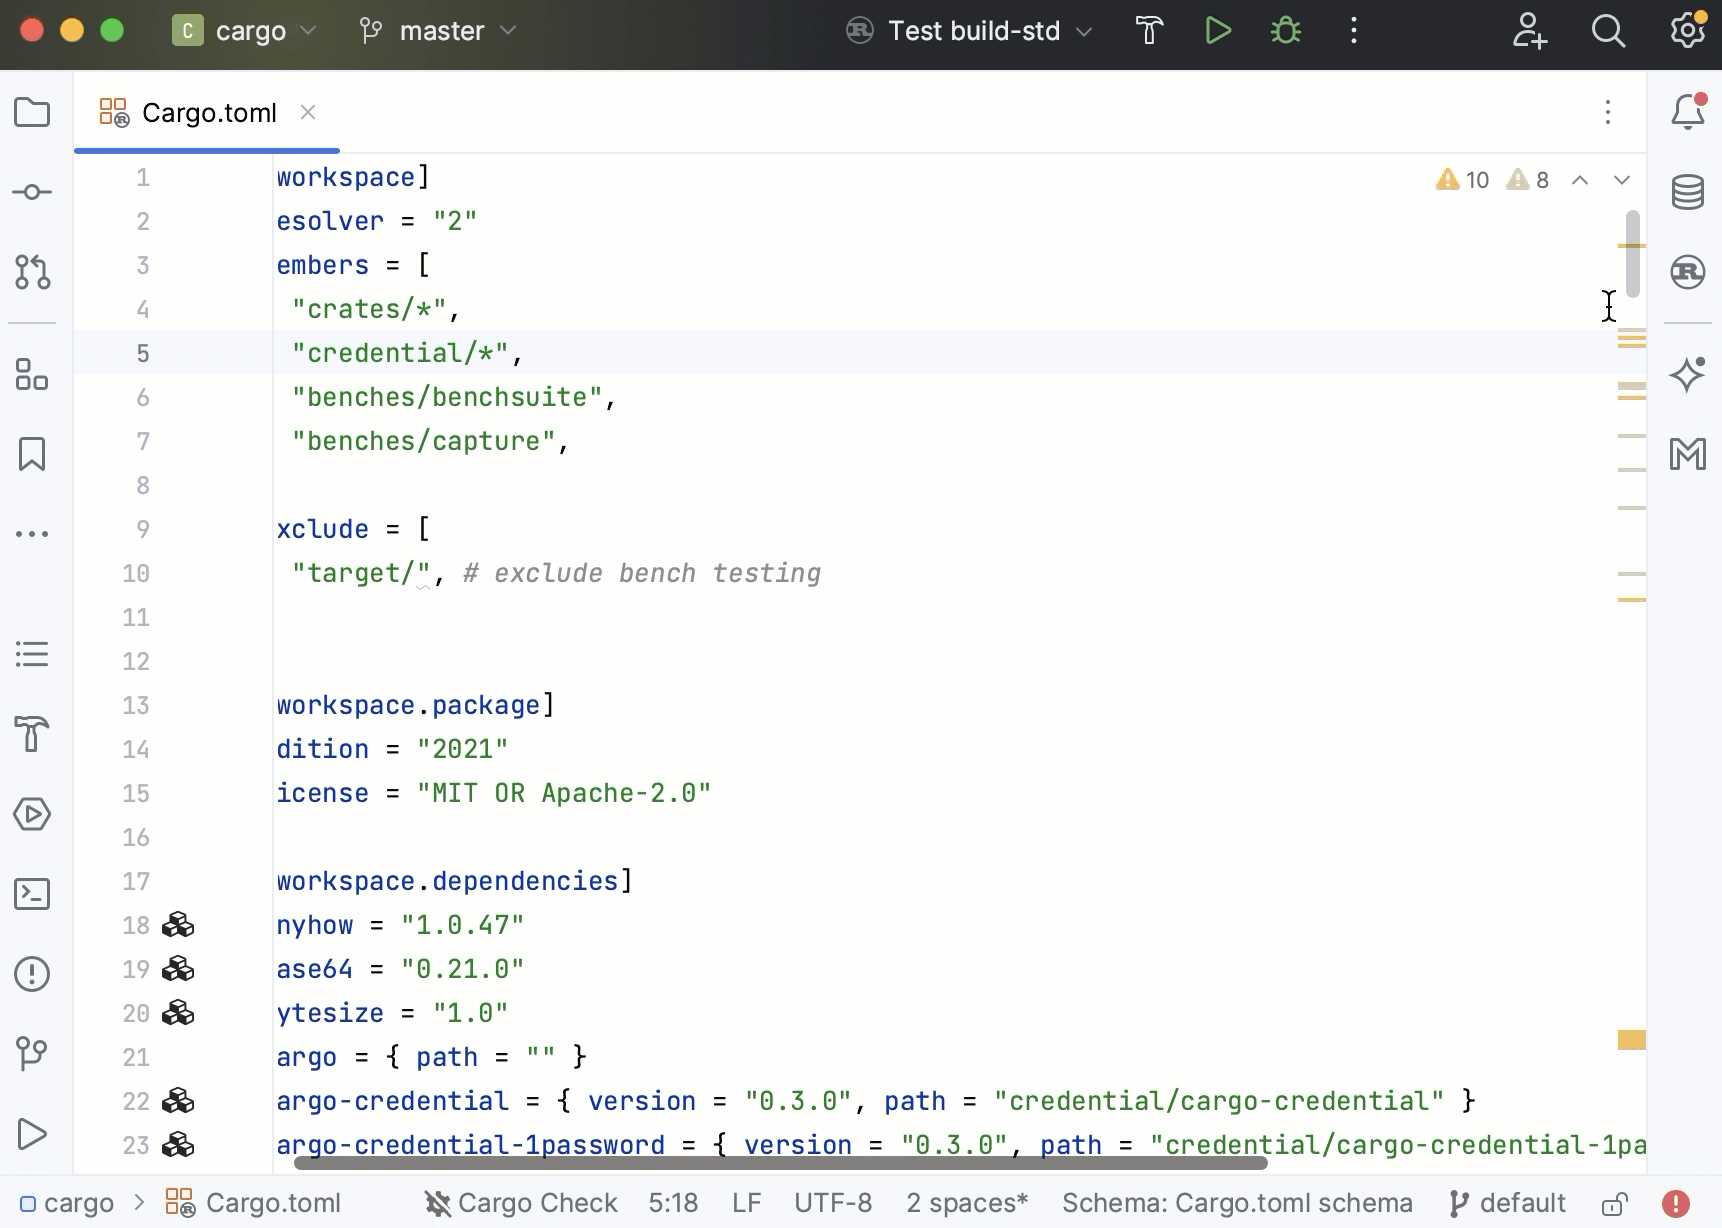
The Cargo tool window
The Cargo tool windowCargo tool window is designed to help you with Cargo tasks. By default, it is pinned to the tool windows bar. You can show or hide it by clicking the window indicator on the sidebar ![]() (alternatively, select from the main menu).
(alternatively, select from the main menu).

The Cargo tool window provides convenient access to common Rust tools such as Rustfmt and external linters. It also gives you a quick way to call Cargo commands, reload the project model, and run project targets.
For more information, refer to Cargo tool window.
Sharing code in Playground
You can share your code in Rust Playground without leaving the editor.
Share in Playground
Select the code fragment you'd like to share (otherwise, the IDE will copy the whole file).
Right-click and choose .
RustRover will create a GitHub Gist and display a notification popup with a link to the playground.
3. Build and run
Use the Build action to compile your code and Run to execute it. There are several ways to perform these actions:
Build/run Rust code
To build or run a particular target, open the Cargo tool window () and double-click the target.

To run from a particular entry point, locate it in the editor, click
 in the gutter, and select Run:
To run a particular file or module, open the Project view, right-click the necessary file or module, and select Run:

If you want to build or run code using a predefined configuration (with custom parameters and settings), select it in the switcher on the main toolbar and:
click
 to build (Ctrl+F9)
click
to run (Shift+F10)

You can always build/run using a Cargo command.
For more information, refer to Building and running.
4. Debug
RustRover provides a full-fledged debugger – with breakpoints, variable monitoring, stepping, memory and disassembly views, and other handy features.
Start a debug session
To start debugging from a particular entry point, locate it in the editor, click
in the gutter, and select Debug: 
To debug code using a predefined configuration (with custom parameters and settings), select it in the configuration switcher on the main toolbar and click
 :
: 
You can always start a debug session by running a Cargo command.
For more information, refer to Start the debugger session.
Learn how to perform basic debugging actions from these guides:

For more information, refer to the Debug section.
5. Test
You will likely support your code with tests, doctests, and/or benchmarks. Here are a few quick ways to run them:
Run test(s), doctest(s), or benchmark(s)
To run a single test or doctest, open it in the editor, click
in the gutter, and select Run:
To run a test/benchmark target, open the Cargo tool window () and double-click the target:
You can always run tests using a Cargo command.
The Run tool window will open, automatically displaying the results:

For more information, refer to the Test section.
6. Run with coverage
RustRover allows you to explore code coverage statistics.
Run with Code Coverage
To get code coverage statistics, do one of the following:
Locate the desired entry point, click
in the gutter, and select Run with Coverage: 
Locate the necessary file in Project view, right-click, and select Run with Coverage:

If you want to run a predefined configuration (with custom parameters and settings), select it in the switcher on the main toolbar, then press
 and select Run with Coverage:
The Coverage tool window () will open, automatically displaying the results:

For more information, refer to Code coverage.
Tune RustRover settings
You can customize RustRover functionality to match your own needs. Here are some of the available customizations: