Work with interactive reports
This topic explains how to work with interactive reports. This type of report allows users to view the notebook output as a completed HTML page, interact with it, and edit the published notebook's copy collaboratively. Compared to static reports, interactive reports allow viewers to dynamically change data presentations (tables and charts) using interactive controls.
Before you open an interactive report
Refer to these topics to learn how to build, publish, and share a static report.
Build a report: describes the process of preparing the notebook as a report before publishing it.
Publish a report: describes the process of publishing the notebook as a report.
How you can open a report varies based on your access to the report. View the details in this topic.
Copy report content
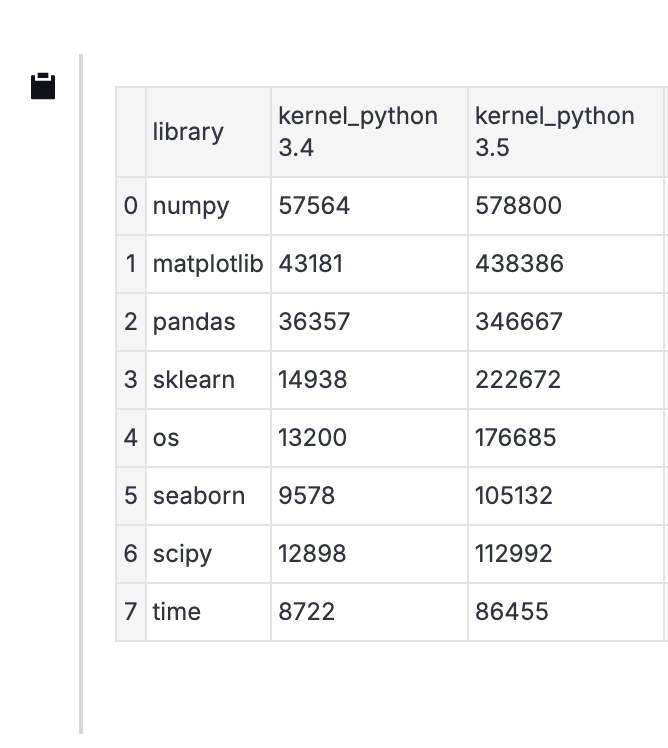
You can copy interactive report content to clipboard. This can be performed on the following types of output:
Code cell text
Markdown plain text and Markdown with expressions
HTML
Tables
Code cell plots
To copy the output of a specific cell, hover over that cell and click the clipboard icon that appears to the left of the cell.

Interact with the report
Interactive reports allow viewers to manipulate data presentations (tables and charts) using the provided controls and table interactivity.
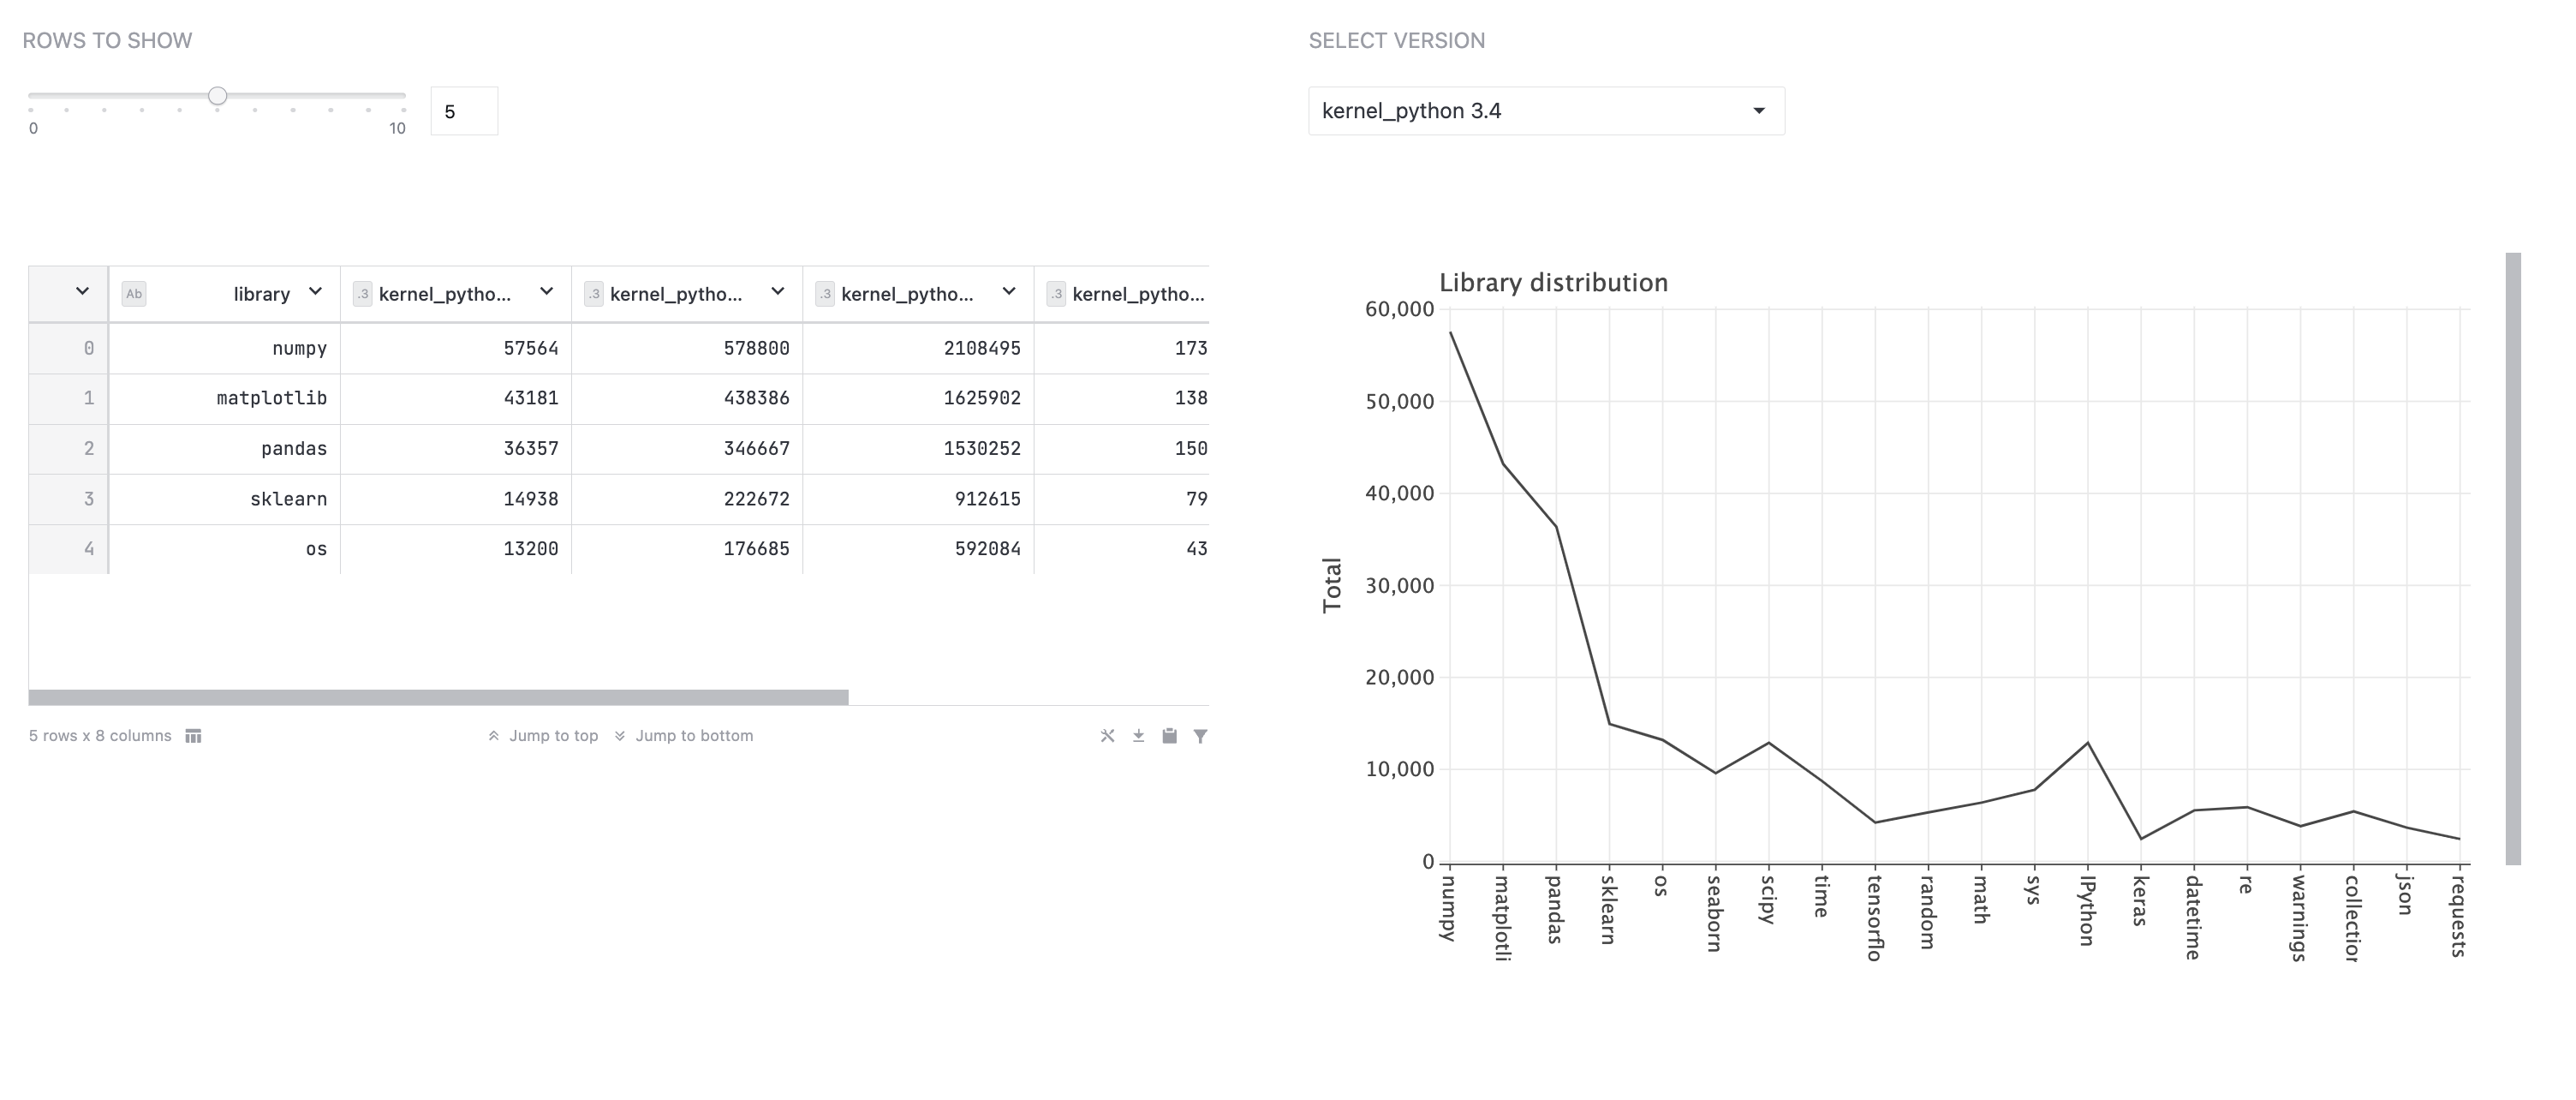
Open the report and click the Recalculate button in the upper right corner to ensure report interactivity. In the image below, there is an interactive report containing a table and a chart.

Use one of the provided controls to change the respective data presentation. If the Reactive mode is on, the report will update automatically. If Reactive mode is off, click Recalculate in the upper right corner.
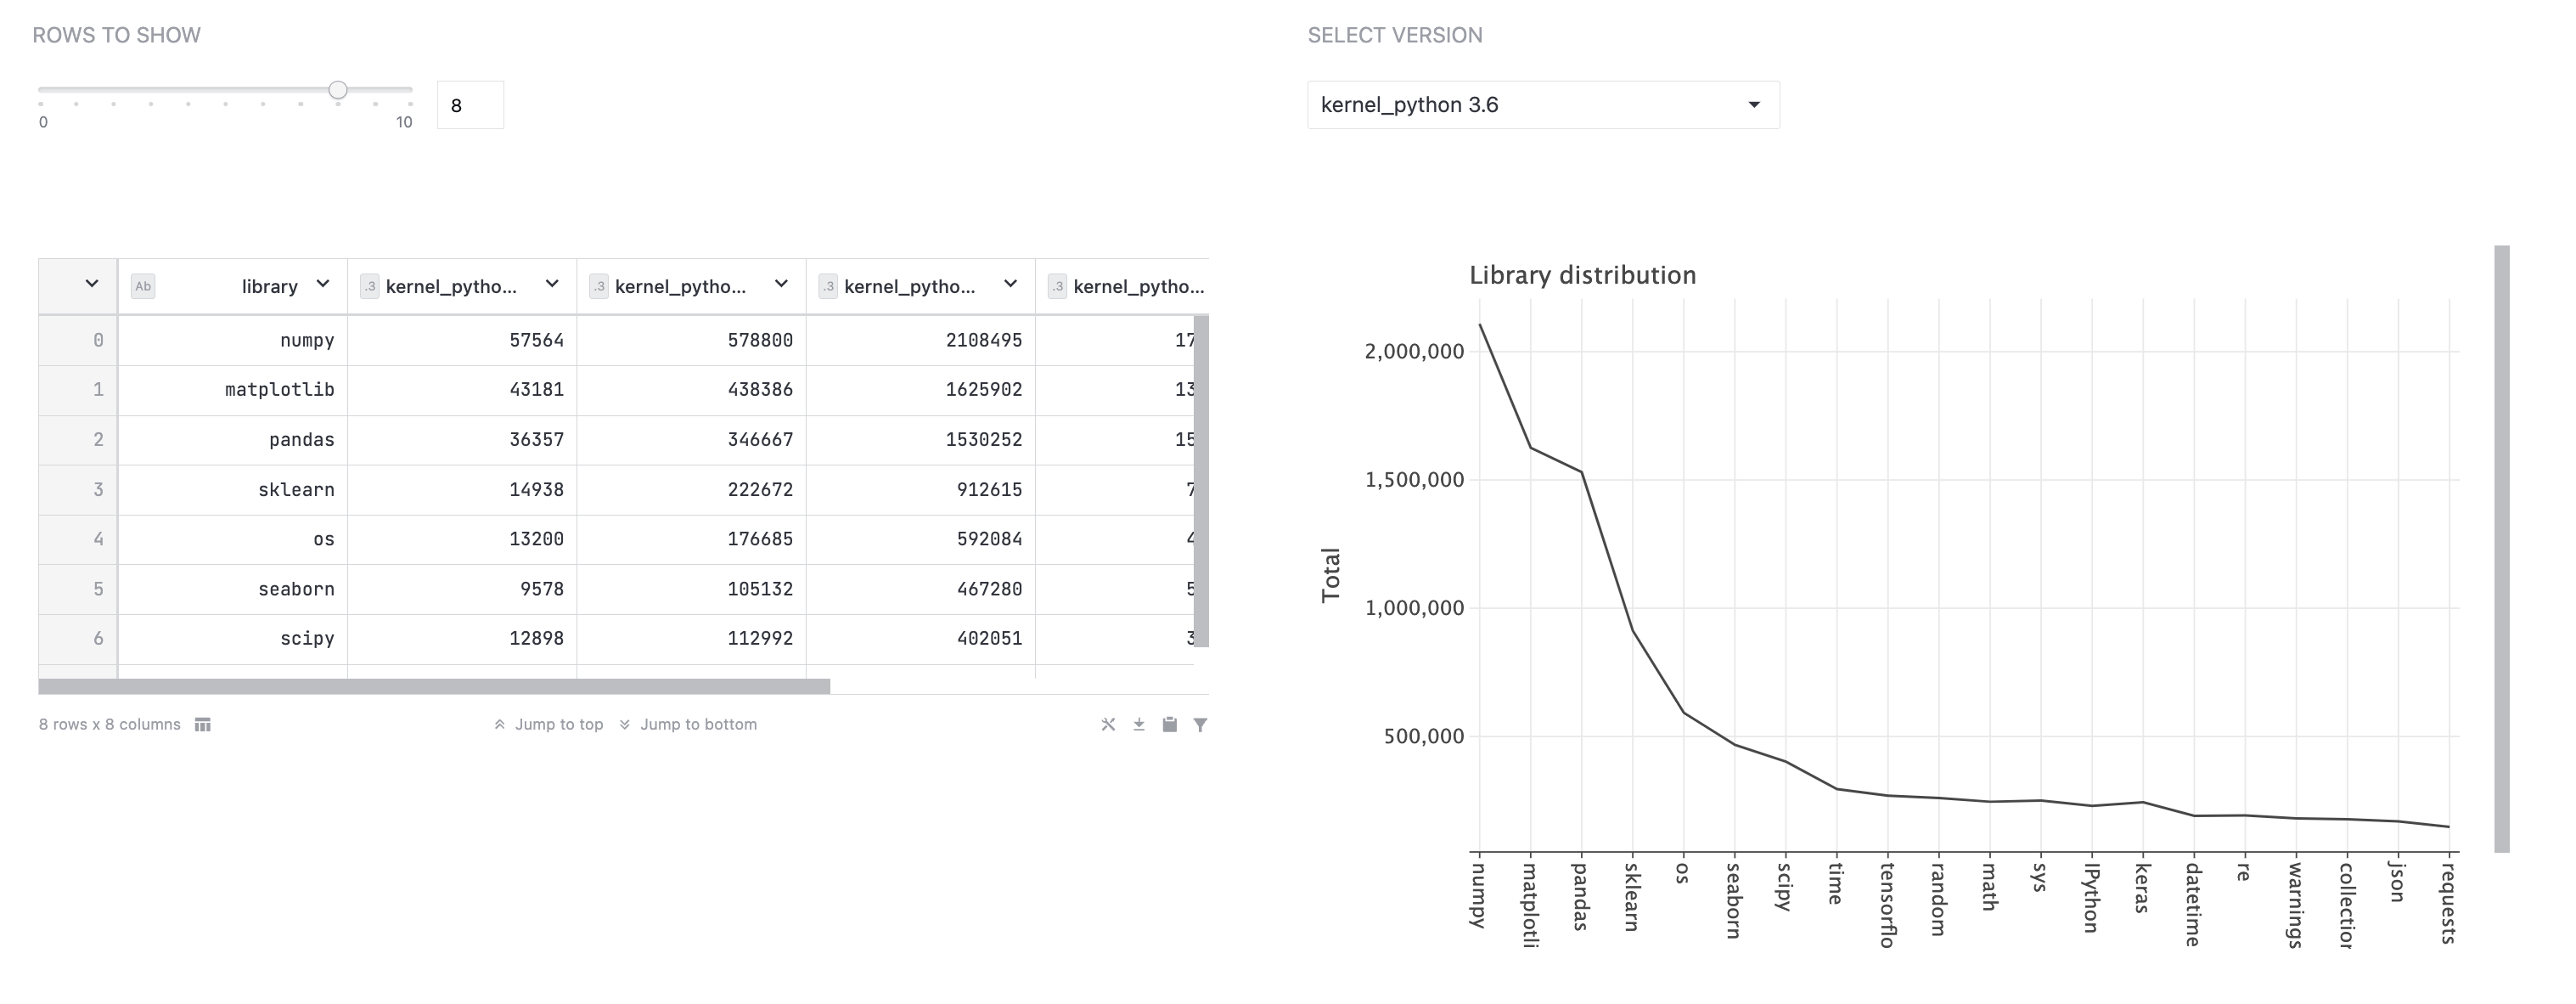
In the example below, the controls are:
A slider used to select a number of rows displayed in the table (changed from 5 to 8)
A dropdown used to select a column for the Y axis (changed from kernel_python 3.4 to kernel_python 3.6)

Manipulate with table content just as you would in the editor
To recalculate the whole report, click Recalculate in the upper right corner.
.
Share a report with currently selected parameters
If an interactive report has controls, such as text inputs, dropdowns, date pickers, or sliders, you can share the report with the values that are currently selected.
Open the report you want to share.
Set the parameters to desired values.
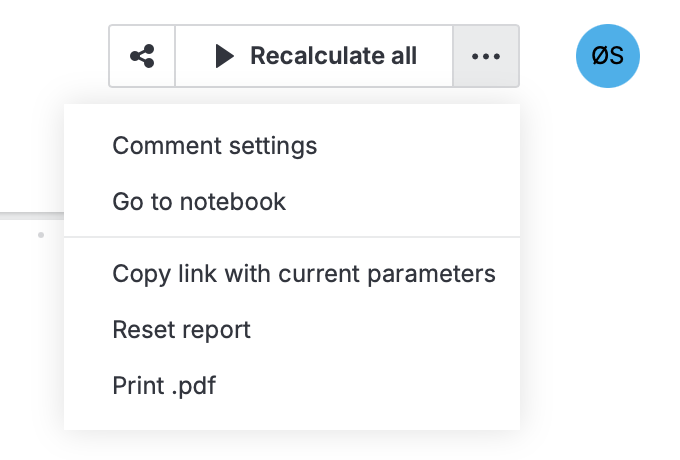
Click
(More) at the top right and select Copy link with current parameters.

Reset an interactive report
You can an interactive report to its initial state.
Open the report you want to reset.
Click
(More) at the top right and select Reset report.

The report will be displayed as if you opened it for the first time.
Manage static report publishing
As a report owner, you can change the publishing settings of a report. Click the sharing icon in the upper right corner of the report. This will open the Update report dialog. Follow this procedure to make the required changes.
Related topics
Refer to these topics to learn about other actions with interactive reports.
Comment a report: describes how to comment interactive report cells and collaborate with other viewers.
Work with report code: describes how access the code of the notebook used for an interactive report to edit its copy or original version.
Save a report: describes how to save an interactive report.
Manage reports in workspaces: describes how to manage interactive reports in workspaces.