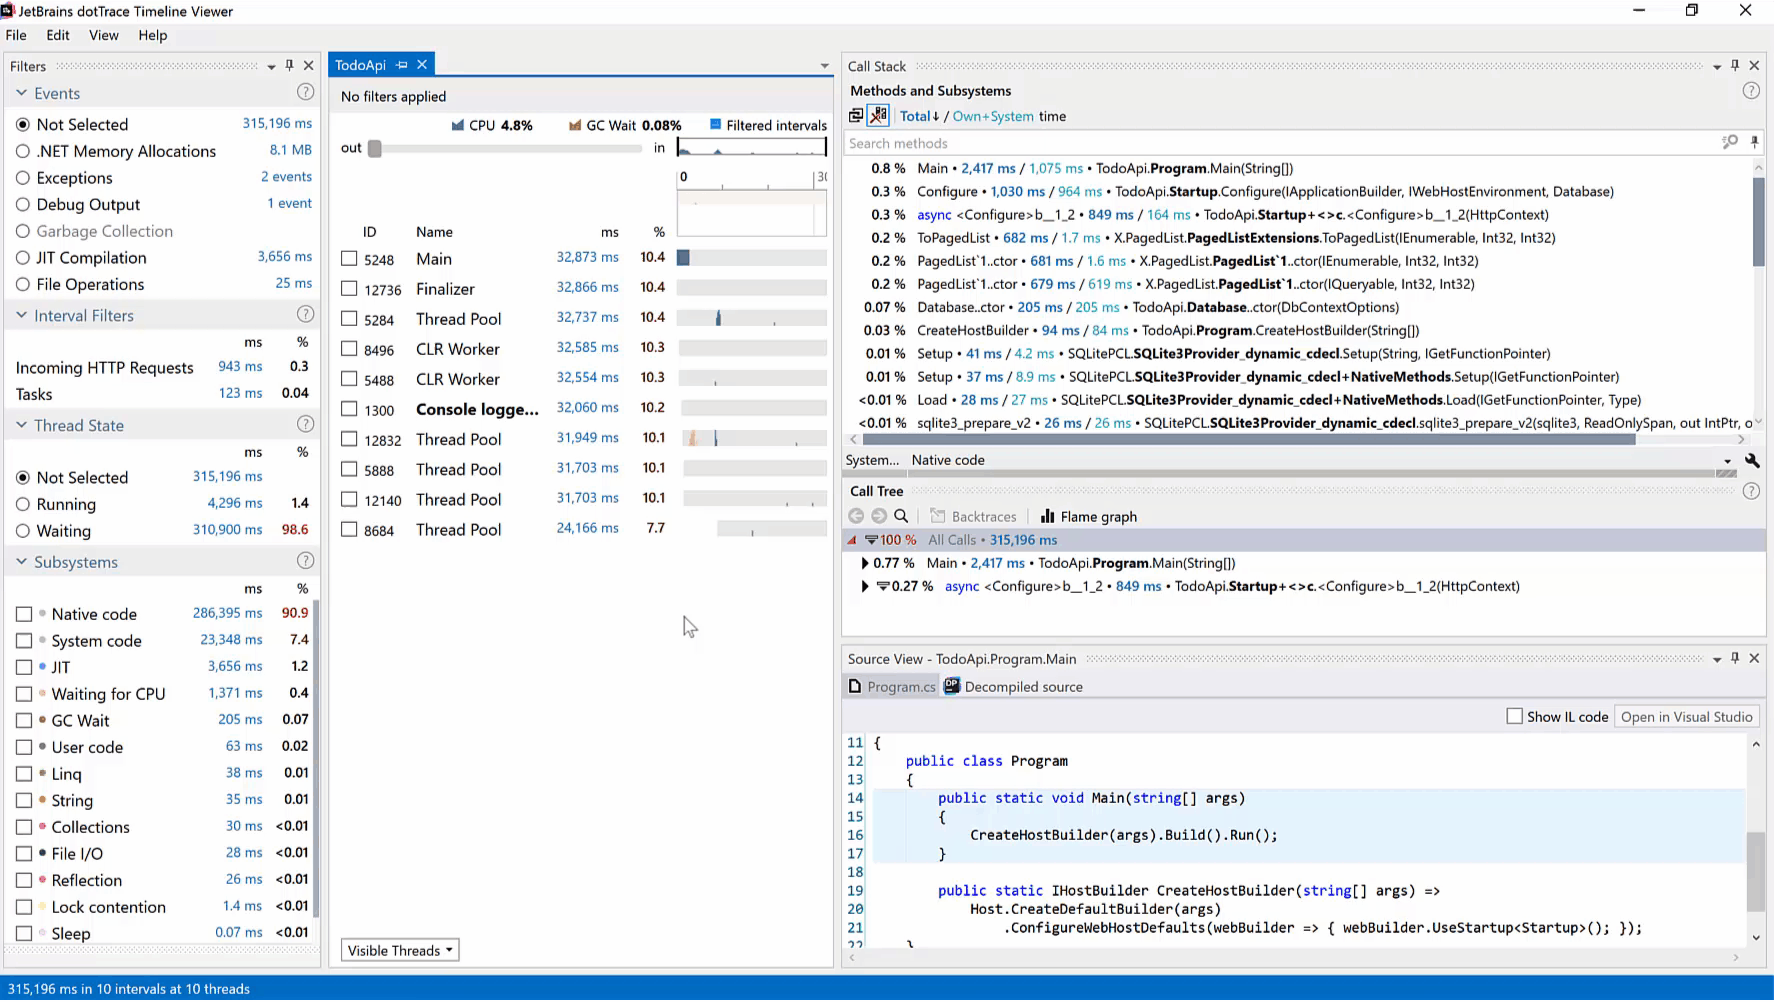
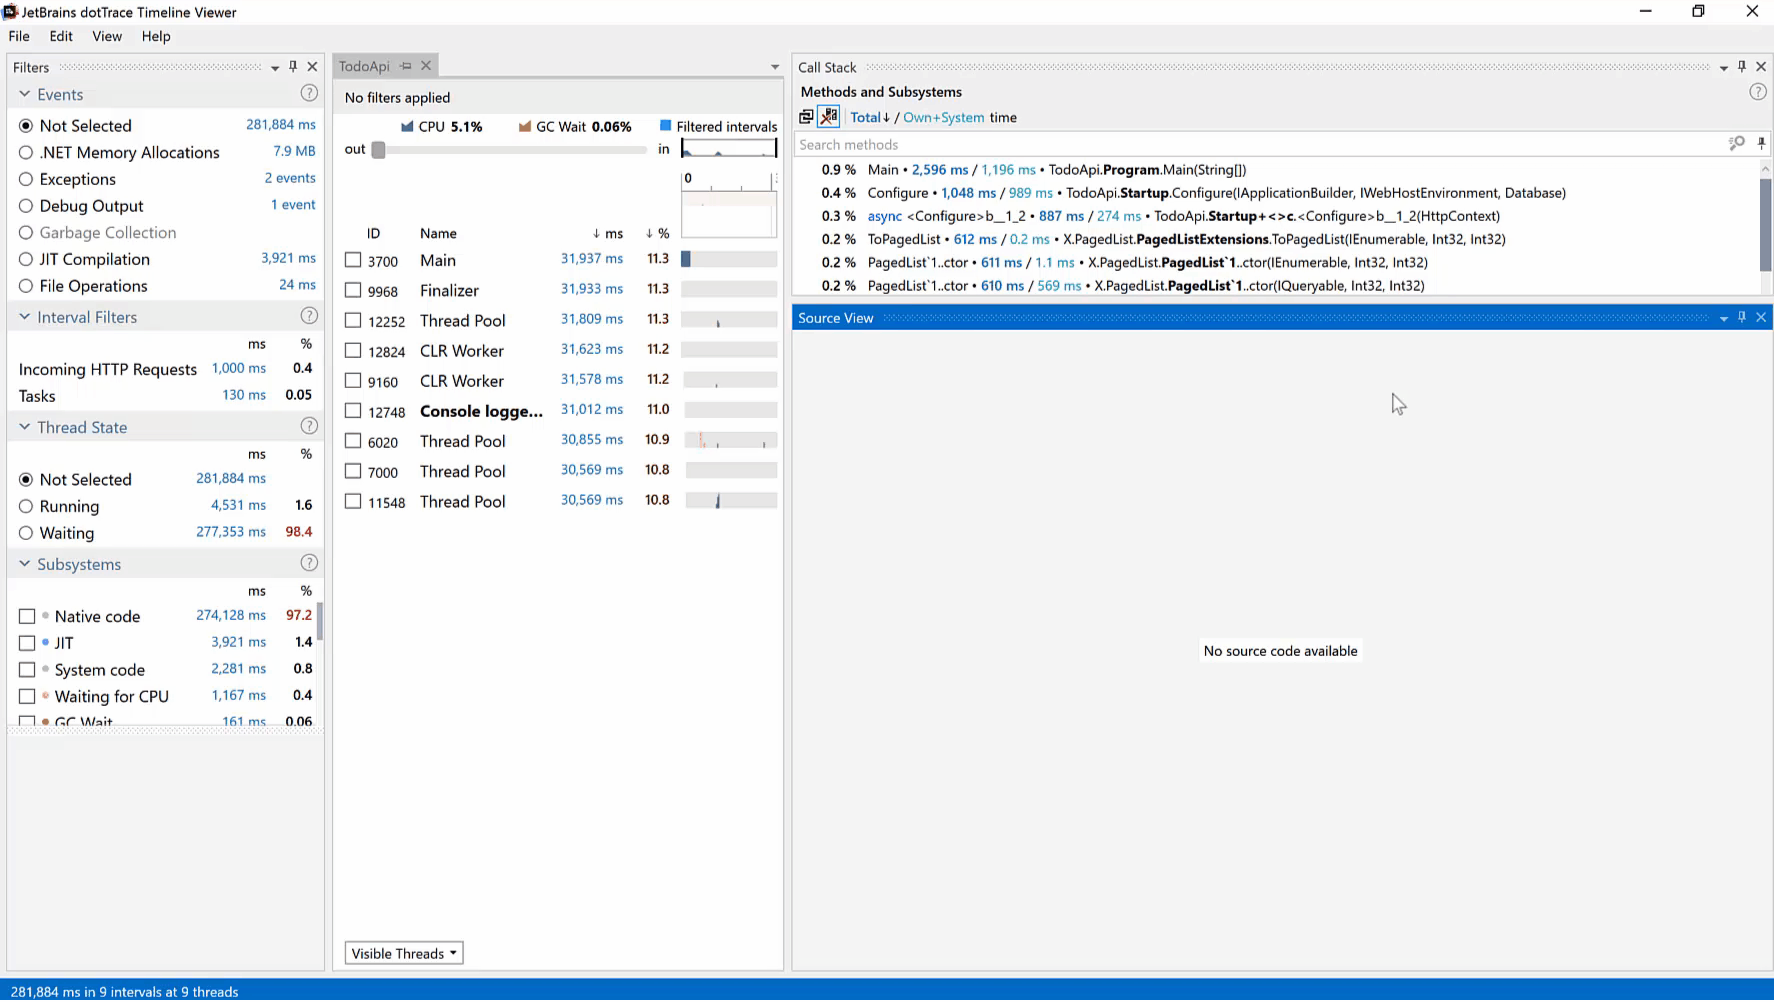
dotTrace

dotTrace

.NET Performance Profiler.

dotTrace helps you detect performance bottlenecks in a variety of .NET and .NET Core applications: WPF and Universal Windows Platform, ASP.NET, Windows services, WCF services, and unit tests. Mono and Unity applications are supported as well.

See Also

YouTube

F# for Performance Critical Code
Matthew Crews

tip

Profile an HTTP request
What happens when an HTTP request is made?

tip

Preview Source Code
Introduce variables the way you like!

Part of tutorial

Writing and Running Unit Tests with ReSharper
Run, debug and profile tests, do continuous testing, and inspect code coverage.

tutorial

Profiling in Rider
Explore performance and memory profiling options in Rider, and optimize an existing application.

Part of tutorial

Conclusion - Profiling in Rider
What have we learned? Profiling, profiler modes, optimizing code, DPA, and more. Let's summarize!

Part of tutorial

Optimize Performance with Rider
Let's try to optimize the Sudoku solver by profiling, and then optimizing code based on the performance snapshot.

Part of tutorial

Introduction to Profiling in Rider
Let's run a first profiling session on a Sudoku solver sample application.

Part of tutorial

Profiling Modes
What are the differences between Sampling, Tracing, Line-by-Line, and Timeline profiling?