
42 Tips and Tricks
Become an IDE champ with these bite-sized tips and tricks.
Development is about focus and flow. Learning your tool helps you get into the flow and stay there.
This playlist shows a variety of IDE tips and tricks from across the major usages of PyCharm.
Find Actions in Any JetBrains IDE
Find various actions inside your JetBrains IDE quickly and efficiently.
The Problem
You want to move a line up. You could use the mouse to select the line, cut it, go to the next line up, and paste it. You know the IDE has an action that can do it, but…what is it?
Let’s use the mouse and look in the Edit menu. Hmm, not there. How about Code? Ahh, yes, it’s there, with the keyboard shortcut. Maybe you speed that up by learning the shortcuts. There’s the Keyboard Shortcuts PDF. You could try memorizing all of that... possibly but nor probable.
The IDE has a lot of power, which means a lot of actions, with new ones coming in each release, not to mention plugins. You’re not going to memorize all them. Does the IDE have a better way?
The Solution
What you need is Find Action, a single keyboard shortcut to memorize. The one ring to rule them all. ⌘⇧A (macOS) / Ctrl+Shift+A (Windows/Linux):
Type “move line up” and you’ll see the Move Line Up Action. Bonus: the keyboard shortcut is shown when an action has one.
That’s a lot to type. Instead, use speed typing to type just fragments such as "m | u". Maybe you don’t know the full action name. Just type one word to get in the ballpark such as "type".
One last point: Find Action also matches preferences, and some are inline toggleable. Want to disable tabs without opening settings/preferences? Start Find Action and type ta pl no for the Window | Editor Tabs | Tabs Placement: None preference. Press Enter to toggle it.
Remember…you don’t have to remember! Keyboard shortcuts, that is. Let Find Action be your one-stop-shopping for actions.
Lean UI
Get tips for modifying your JetBrains IDE UI.
The Problem
Our IDEs have a lot of features. By default, those features are visible:
- Tool windows
- Tool window bars
- The navigation bar
- The status bar
Do you really want that always-visible? You could switch to distraction-free mode. But that goes a little too far.
The Solution
Let’s turn things off – but a little more selectively. Our IDEs are really configurable and stuff can be turned off. The tool window bars are a good choice. Followed by the navigation bar, maybe the status bar too. Now the big one the project tool window. It can give a lot of space. But wait, the files!
Yes, the files. It’s easy to toggle on/off with the keyboard. As we’ll see in later tips, there are keyboard ways to get at files.
Want to reduce clutter without using the mouse? Use what we learned in the Find Action tip, and toggle the setting in the results, by pressing enter, then enter again to toggle.
Now we have a nice, lean IDE workspace, keyboard-focused, ready to work. Your IDE has lots of power, on-the-screen, ready to use. If you are keyboard-focused and want more editor room, clean your workspace!
Use Recent Files
Jump to any of the files you've been using recently in your JetBrains IDE.
The Problem
Have you ever been deep into a project, only to realize that you forgot to include something crucial in a file? We've all been there, so let's learn how to prevent this from happening to us again. While the tabs at the top of your screen are helpful, they can be a little bit overwhelming.
The Solution
Instead of searching for a certain tab, let’s use our IDE. One convenient way to find certain files is using the Recent File Window. Use ⌘E (macOS) / Ctrl+E (Windows/Linux) to get a nice list of all the files you have visited recently. It is automatically sorted in the order you have visited them, which makes going back so much easier
Well, that is already a great improvement, but we can do even better! What if the file you are looking for is at the very bottom. Well sure we could press arrow down like a hundred times, or worse use the mouse, or we just type directly into the window, which lets you search for a particular file.
Wouldn’t it be nice if you could narrow it to only the files you edited, not all you visited? In the upper right corner, you see the “Show edited only” files. This will help you remove some clutter and hides the files you just visited without doing any changes, and you can even open a certain file in a split window to have a look at multiple files at the same by clicking on the icon on the right side or pressing Shift or Enter.
I got one more for you, let’s check it out! If we look to the left side of our Recent Files Window we see all the amazing tools we recently used. You want to jump to the Terminal? Just type in “T-E-R” and it will take you right there.
Development is hard! and having a good overview of edited files is difficult. Luckily our IDEs make navigation really convenient!!
Navigate to Symbol
Navigate your project by code, not files.
Decades of old habits make us think of files, with their deeply-nested locations and obscure, inconsistent file names and extensions. Our brains are already full. Who has time to memorize all the files in the project?
Don't. Instead, think of the code in your project, not the files. Want to jump to a class, function, or variable? You have a smart IDE that's indexed the universe. Put it to work and use the Navigate by Symbol action ⌥⌘O (macOS) / Ctrl+Shift+Alt+N (Windows/Linux) quickly, without disruption, get to where you want to go.
When the popup appears, start speed typing to get to the symbol, using the "camel hump" syntax universal to speed searching.
Once you select your choice, PyCharm not only opens the file but puts the cursor on the spot of the declaration of the symbol.
Remember, this isn't just for Python symbols. This matches in JS, CSS, SQL, etc.
Interested in navigating by file?
 Navigating by file is a helpful way to browse your code base. Check it out!
Navigate to File
Jump to a file without using the Project Tool and your mouse.
Navigating your project files is a chore. Expanding folders and subfolders, scrolling, double-clicking. It breaks your flow and makes you think about administrivia.
Wouldn't it be great if your tool knew everything about every file, and let you just jump to things by typing?
The Navigate to File action ⌘⇧O (macOS) / Ctrl+Shift+N (Windows/Linux) makes this actually...fun. The non-disruptive popup appears and you just start typing parts of the filename until you see the file you're looking for. No trees, no mouse.
Use the same hump-case "speed search" syntax to filter the listing with parts of filename fragments. Use slashes to indicate that a file should be in part of the directory structure. Click the checkbox to look outside of your project files, into your dependencies.
If you want to jump to a file, Navigate to File is a speedy, non-disruptive option.
Interested in navigating by symbol?
Navigating by symbol is a fast and effective way to browse your code base. Check it out!
Navigate Cursor Position Back and Forth
Easily navigate back to where you were, or where you went.
Decades of old habits make us think of files, with their deeply-nested locations and obscure, inconsistent file names and extensions. Our brains are already full. Who has time to memorize all the files in the project?
Don't. Instead, think of the code in your project, not the files. Want to jump to a class, function, or variable? You have a smart IDE that's indexed the universe. Put it to work and use the Navigate by Symbol action ⌥⌘O (macOS) / Ctrl+Shift+Alt+N (Windows/Linux) quickly, without disruption, get to where you want to go.
When the popup appears, start speed typing to get to the symbol, using the "camel hump" syntax universal to speed searching.
Once you select your choice, PyCharm not only opens the file but puts the cursor on the spot of the declaration of the symbol.
Remember, this isn't just for Python symbols. This matches in JS, CSS, SQL, etc.
Interested in navigating by symbol?
Navigating by symbol is a fast and effective way to browse your code base. Check it out!
Activate the Navigation Bar
Turn the navigation bar on when you need it and dismiss it when you're done.
The Problem
Getting into the flow means stripping down your UI distraction (turn off the Project tool window and Navigation Bar) then going keyboard-centric to avoid the mouse. But you still need to get to your files, and sometimes you'd prefer to browse instead of invoking "Recent Files" ⌘E (macOS) / Ctrl+E (Windows/Linux) or "Find File" ⌘⇧O (macOS) / Ctrl+Shift+N (Windows/Linux) action.
The Solution
In the latest version of JetBrains IDE's, the Navigation Bar is in the Status bar by default, but you don't want to use your mouse to get there, or perhaps you've already hidden it altogether as part of a lean UI.
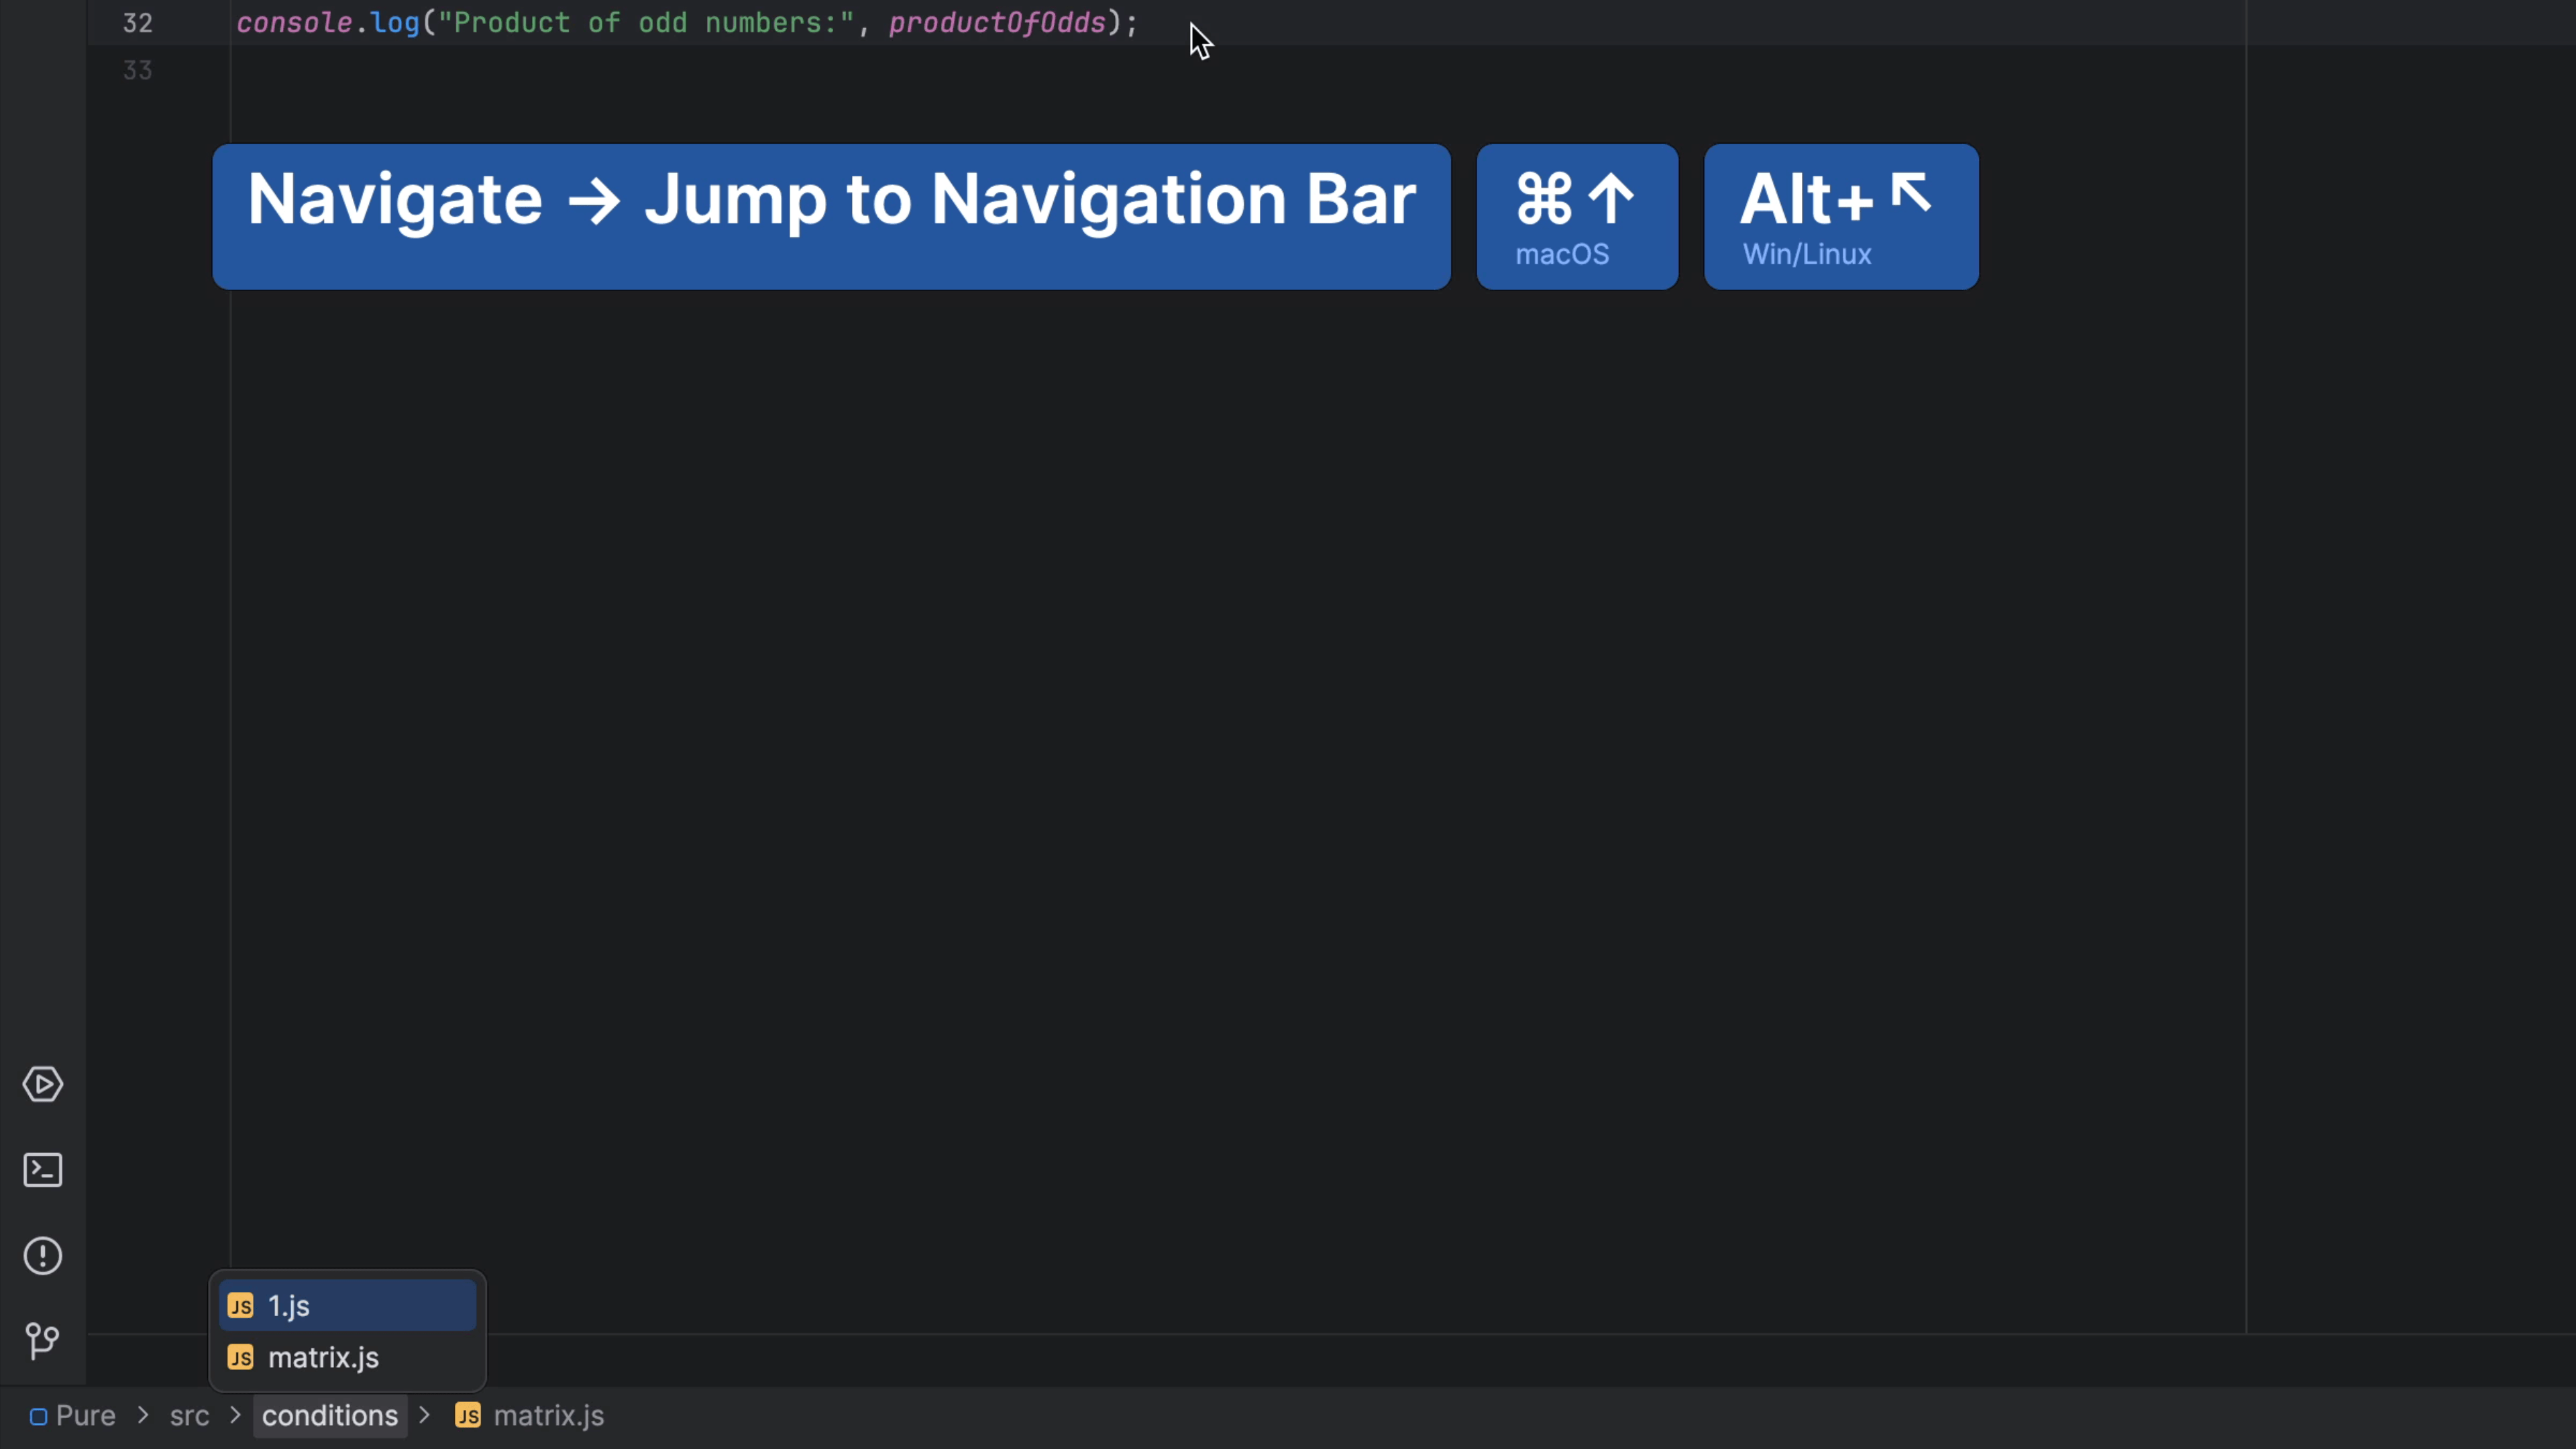
You can invoke Navigate | Jump to Navigation Bar ⌘↑ (macOS) / Alt+Home (Windows/Linux) to temporarily re-activate the Navigation Bar. Once you use it, the window disappears.

But then, how do you make it disappear? Press ␛ (macOS) / Escape (Windows/Linux) to go back to where you were working.
How did we hide it in the Navigation Bar first place, or bring it back if wanted? From the menu, you can select View > Appearance > Navigation Bar which allows you to toggle between Top, In Status Bar and Don't Show.

Want a faster, keyboard-centric way to toggle? ⌘⇧A (macOS) / Ctrl+Shift+A (Windows/Linux) lets you search for such settings and even toggle inline. Type vi nav to speed search, make sure the selection is on View: Show Navigation Bar, then press ⏎ (macOS) / Enter (Windows/Linux). The setting is toggled...no mouse usage needed.
If you want to know what else the Navigation Bar can do, check out Navigating Like a Pro.
Navigate files with the Navigation Bar
Navigate to project files from the navigation bar. No mouse! 🐁
The Problem
We've discussed "getting into the flow"... strip down the IDE to focus and don't take your hands off the keyboard. But if you've turned off your Project tool window, how can you navigate files and directories?
You could use the Project action ⌘1 (macOS) / Alt+1 (Windows/Linux) to bring back the Project tool, do your work, and then hide it again.
The Solution
Instead, temporarily bring back the Navigation Bar then navigate it with the keyboard.In your JetBrains IDE, invoke the "Navigation Bar" with ⌘↑ (macOS) / Alt+Home (Windows/Linux).
You can use the left arrow to go up a directory and right arrow to go down a directory. To see the contents of a directory, either press the down arrow or press ⏎ (macOS) / Enter (Windows/Linux). With this you can get to any place in the tree, without using the mouse.
![]()
For looking at the directory the currently-edited file is in, this is even easier. Activating the Navigation Bar makes the current file selected. You don't have to press ← (macOS) / Up Arrow (Windows/Linux) to select the parent directory. Just press ↓ (macOS) / Down Arrow (Windows/Linux).
If you want to know what else the Navigation Bar can do, check out Navigating Like a Pro.
Open any file from the Navigation Bar
Using just the keyboard, browse and open files in your project.
The Problem
If you've closed the Project tool window and hidden the Navigation Bar, you need a way to open file that's keyboard centric and doesn't disrupt your flow. Usually, the fastest way to open a file is the various search options (Recent Files, Navigate to File, etc.) But other times, you want to browse instead of search.
The Solution
In your JetBrains IDE, invoke the "Navigation Bar" with ⌘↑ (macOS) / Alt+Home (Windows/Linux).
You can now:
- Use the cursor keys to get to the target directory
- Speed search to select the file
Once you have selected the file you want to open in the Navigation Bar, press ⏎ (macOS) / Enter (Windows/Linux) and the IDE will open your file. Clicking with the mouse also works.
As a note, this is a very common pattern for jumping to a file in the current directory. In this case, you don't have to press ← (macOS) / Up Arrow (Windows/Linux) to go up to the directory. Even though the current file selected, you can still press ↓ (macOS) / Down Arrow (Windows/Linux) or better still, just start speed searching.
Opening the file isn't the only operation you can do on a selected Navigation Bar item. You can also invoke "Refactor This" ^T (macOS) / Ctrl+Alt+Shift+T (Windows/Linux), or "Delete" ␡ (macOS) / Delete (Windows/Linux) , basically, anything you could do when you click on the file in the Project tool window.
If you want to know what else the Navigation Bar can do, check out Navigating Like a Pro.
If you want to know what else the Navigation Bar can do, check out Navigating Like a Pro.
Speed search with the Navigation Bar
Use the keyboard abbreviations to quickly find what you're looking for in the Navigation bar.
The Problem
We've discussed getting into the flow by reducing UI clutter and being keyboard-focused. We're using the Navigation Bar on-demand to get to targets in our project tree.
When we get a drop-down for contents of a directory, but sometimes the listing is long. We don't want to press down arrow a bunch of times. Instead, we can use the IDEs "speed search" facility to quickly dive through a long listing.
The Solution
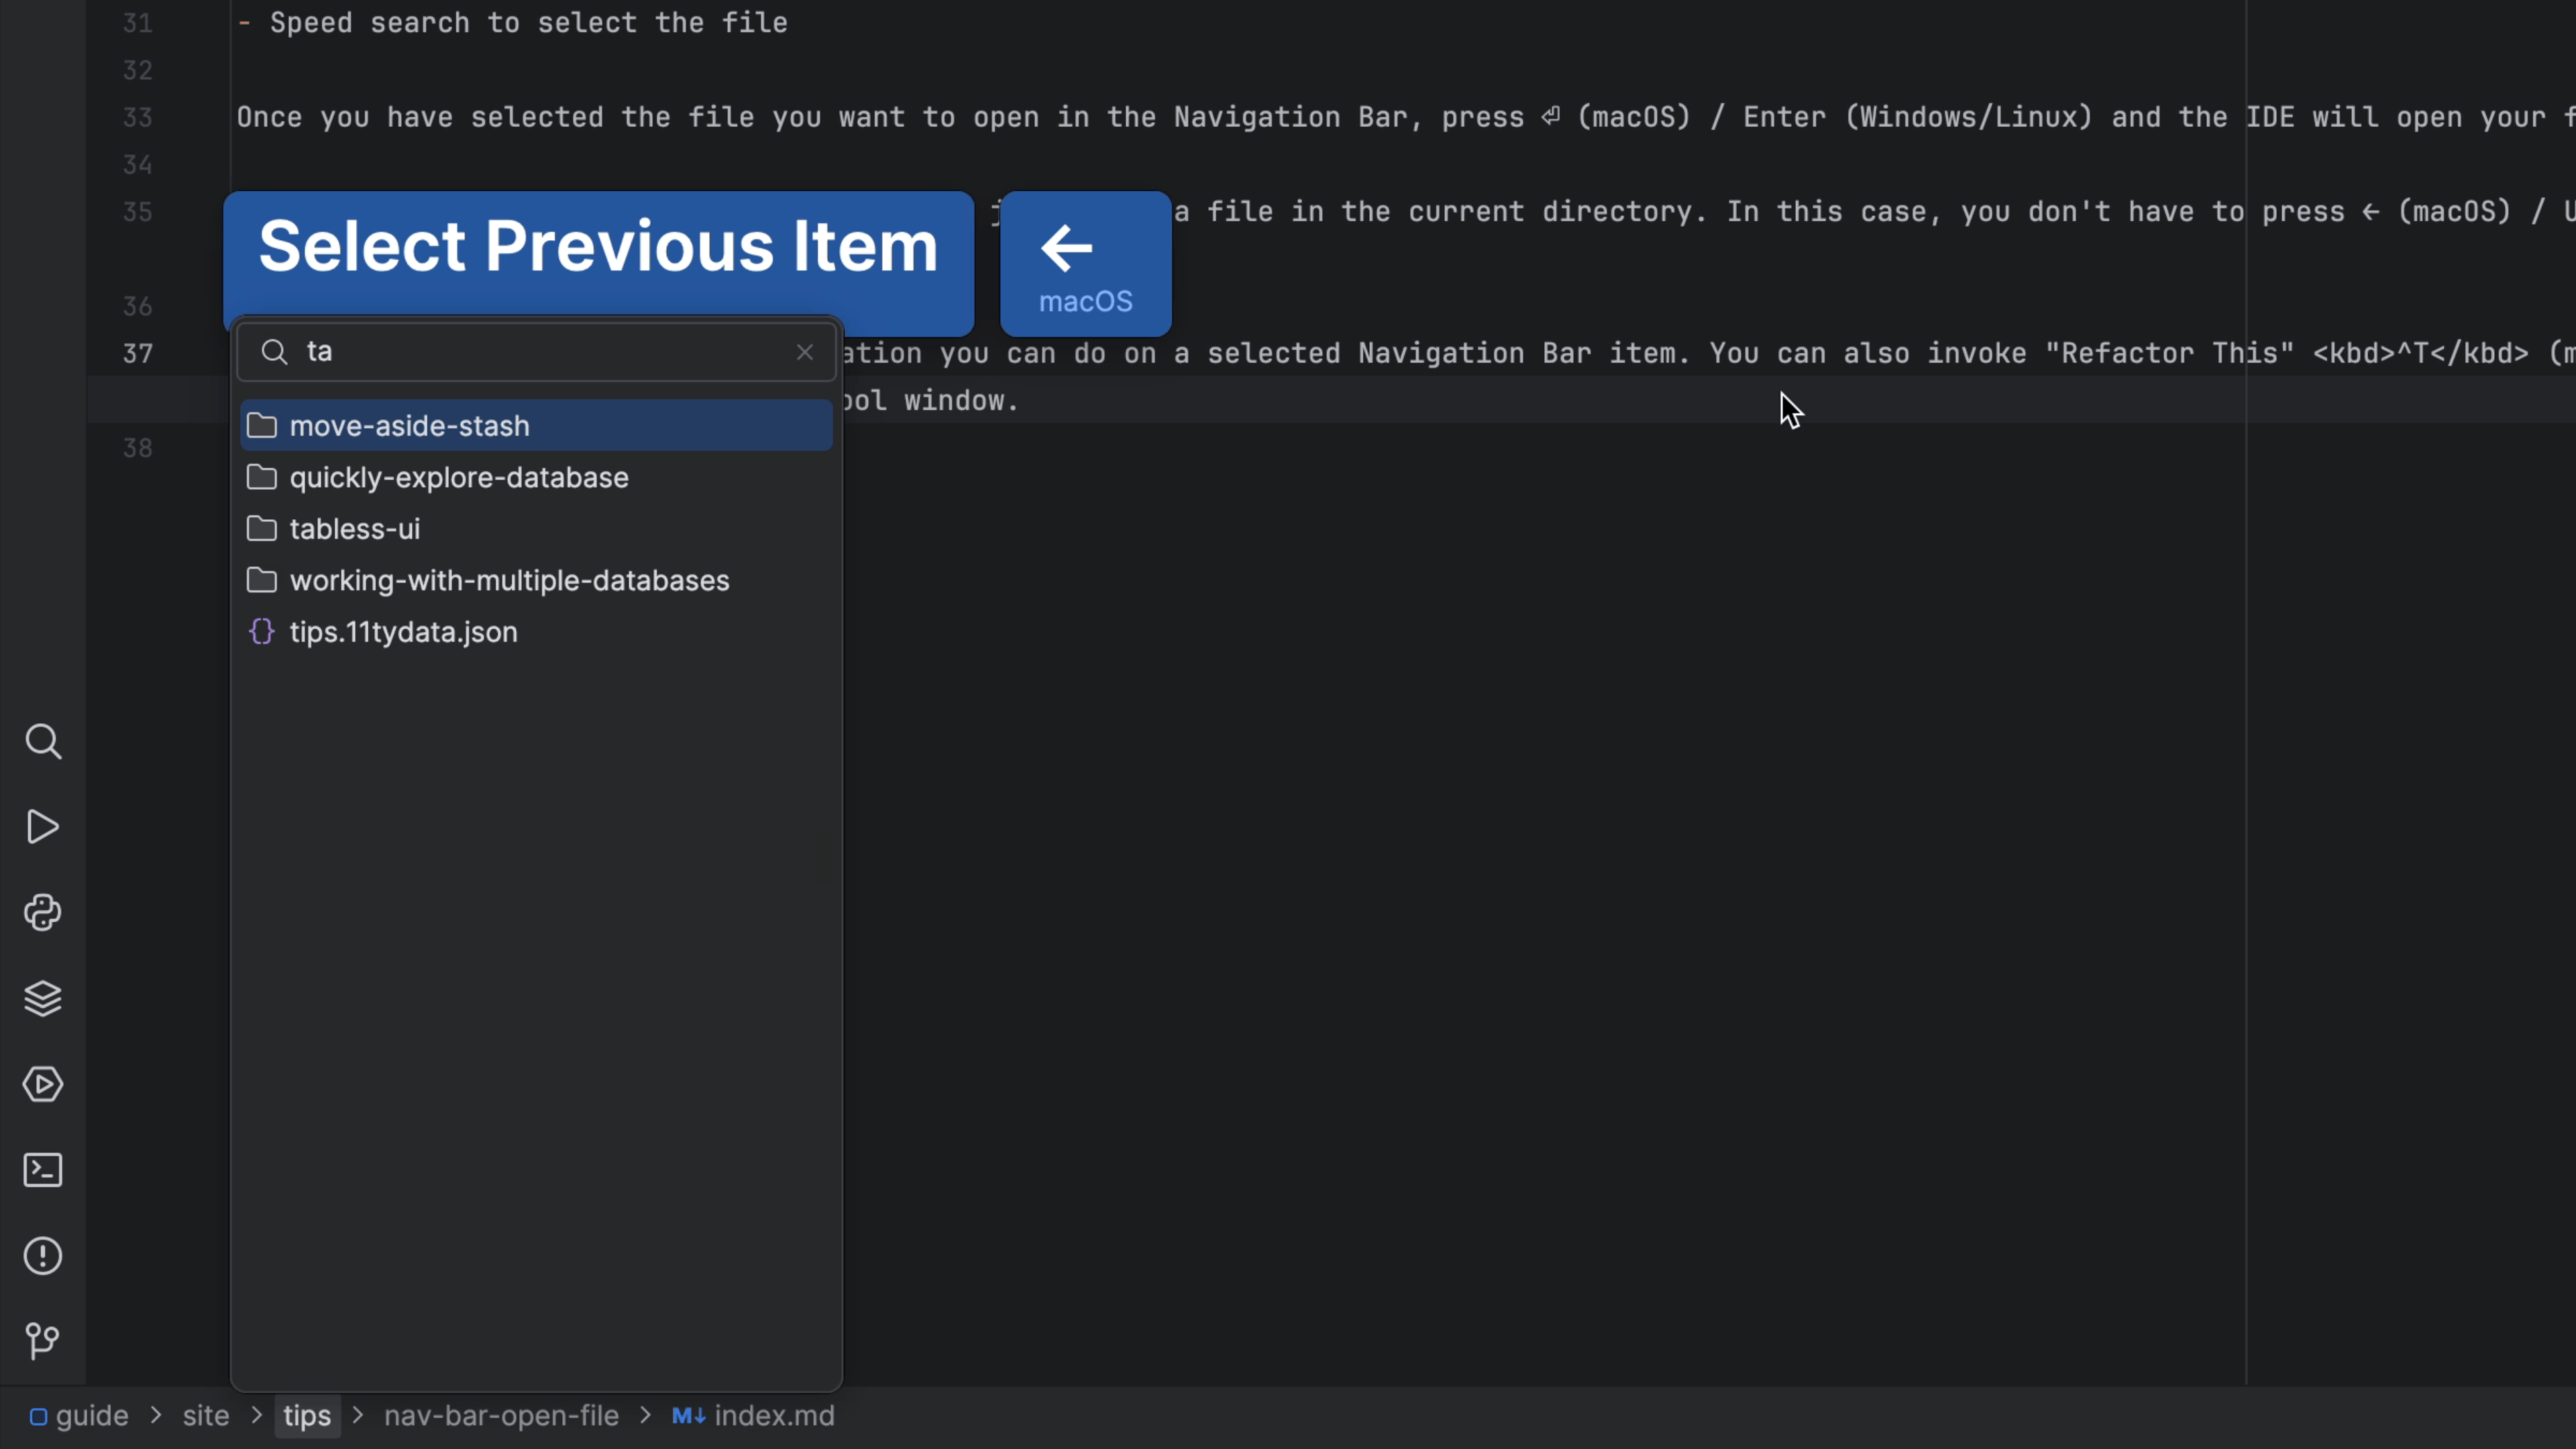
You can invoke Navigate | Jump to Navigation Bar ⌘↑ (macOS) / Alt+Home (Windows/Linux) to temporarily re-activate the Navigation Bar. Once you use it, the window disappears.
Use speed search to select one item in the list by:
- Simplest case: Type one letter
- Type a second letter...if your choice is selected, then you're done, and you can press ⏎ (macOS) / Enter (Windows/Linux) to open it. Alternatively, you can perform over actions too. Perhaps you want to invoke "Refactoring" ⌃T (macOS) / Shift+Ctrl+Alt+T (Windows/Linux).

Go ahead and experiment with speed searching and see what you can discover. For example, you can also type a period and a letter to search in the file extension.
This becomes a very fast workflow for speeding through the navigation bar, all without using the mouse. Moreover, speed search is a pervasive pattern in all JetBrains IDEs.
Create a new File from the Navigation Bar
A fast way to add a new file to your project, without touching the mouse.
The Problem
How can I create a file if I've turned off the Project tool window? Let the Navigation Bar be your one-stop replacement for the Project Tool window!
The Solution
In your JetBrains IDE, invoke the "Navigation Bar" with ⌘↑ (macOS) / Alt+Home (Windows/Linux)
You can now:
- Use the cursor keys to get to the target directory
- Speed search to select any subdirectories
![]()
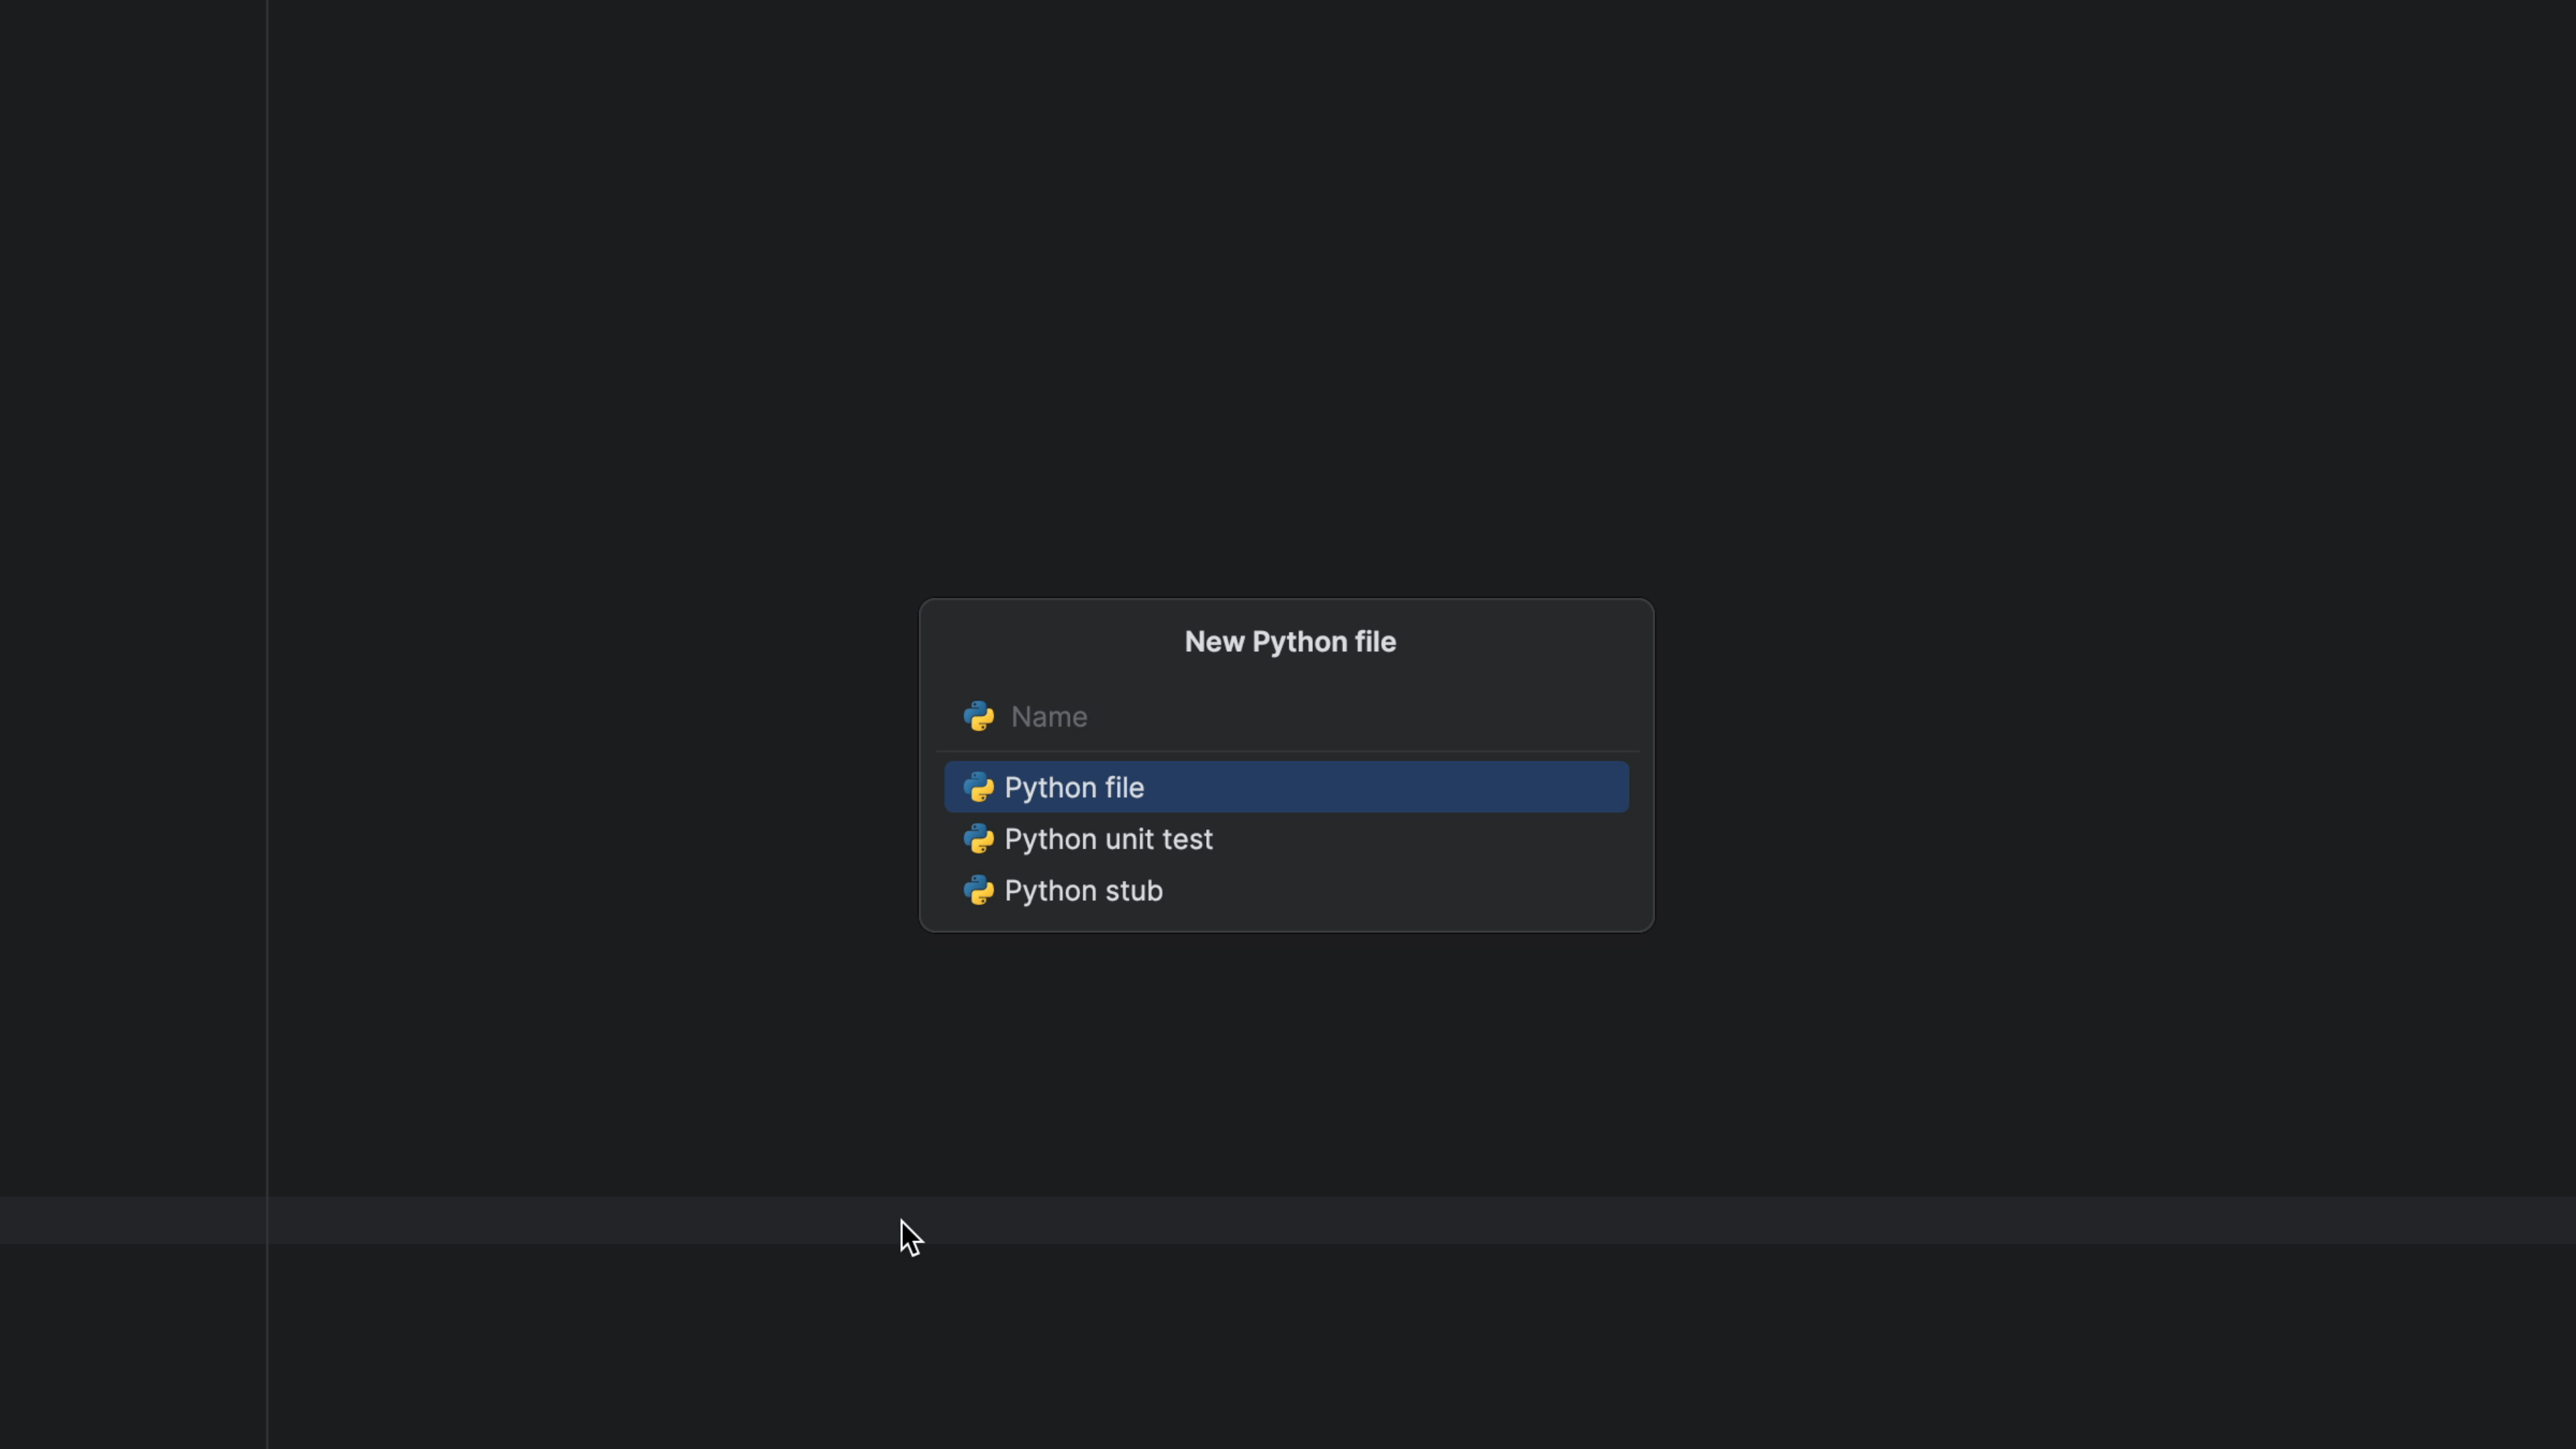
Once you have selected your target, use ⌘N (macOS) / Alt+Insert (Windows/Linux) to bring up the new file dialog. Just like in the Project tool window, the new file is opened after creation.
Also like the Project tool window, your selection doesn't have to be on a directory. If you're on a file, the new file will be created as a sibling. This is particularly useful in the common case of creating a new file in the current directory:
- Activating the navigation bar highlights the current file.
- Immediately press New ⌘N (macOS) / Alt+Insert (Windows/Linux)
In summary, after two key combos, you have a new sibling file, with no permanent file tree visible and no popups to close afterward. That's what getting in the flow is about.
If you want to know what else the Navigation Bar can do, check out Navigating Like a Pro.
Find in Path with the Navigation Bar
Use the Navigation bar and Find in File together and be faster than all of your team members.
The Problem
Do you need a fast way to find files in a path, without disrupting your flow? Perhaps you've closed the Project tool window and need to find a file somewhere in the project tree?
The Solution
You can invoke Navigate | Jump to Navigation Bar ⌘↑ (macOS) / Alt+Home (Windows/Linux) to temporarily re-activate the Navigation Bar. Once you use it, the window disappears.
Navigate to the target, and invoke "Find in Path", ⌘⇧F (macOS) / Ctrl+Shift+F (Windows/Linux), from the keyboard.

If you want to know what else the Navigation Bar can do, check out Navigating Like a Pro.
Add Line After/Before
Smart-add a line, from the middle of a line, after or before the current line.
It's easy to overlook, but we frequently add a line of code while in the middle of another line. Perhaps we were fixing something and want to proceed to the next line. Perhaps we were on an import and want another import on the line above.
It's tempting, for adding a line after, to treat this as a two-step process:
- Go to the end of the line (ugh, sometimes with the mouse)
- Press ⏎ (macOS) / Enter (Windows/Linux)
Adding a line above is worse:
-
Go to the beginning of the line
-
Press ⏎ (macOS) / Enter (Windows/Linux) to make space above
-
Press ↑ (macOS) / Up Arrow (Windows/Linux) to go to that new, empty line
-
Perhaps press tab a few times to get the indentation right
Instead, use Start New Line ⇧⏎ (macOS) / Shift+Enter (Windows/Linux). With your cursor anywhere in the current line -- where you are just finishing an edit -- you can then get an empty next line, with correct indentation.
For a line above, use Start New Line Before Current ⌘⌥⏎ (macOS) / Ctrl+Alt+Enter (Windows/Linux) You get a new line, indented appropriately for the language and context.
Make and Extend Selection Using Keyboard
Use the keyboard to select blocks of code then extend/shrink the selection.
In coding, we select code and operate on it. For example, move it to another line, change its indentation, etc.
You can use your mouse to make your selection. Or, use the keyboard.
For example, use
Move Caret to Previous Word with Selection ⌥⇧← (macOS) / Ctrl+Shift+Left Arrow (Windows/Linux) to (a) move the cursor forward or backward a word, while (b) expanding the selection along the way. Want to select three words? Do it three times.
In Python code you frequently want to gradually expand a selection from where the cursor is at: the symbol, then the substatement, then the full statement, then the line, then the block, etc. ⌥↑ (macOS) / Ctrl+W (Windows/Linux) is ideal. It works semantically. Keep pressing it until you get the selection you want. Go too far? Do the inverse to shrink the selection.
Without using the mouse.
Finally, PyCharm also supports multiselection aka multiple carets.
Interested in another cool selection tip?
You can wrap a selection with a tag to save your fingers. Check it out!
Move Block Up/Down Using Keyboard
Use the keyboard to move a line or selection up or down in your file.
We want to operate on code in the editor fast. Using Cut-and-Paste is kinda fast, but there's a better way that doesn't temporarily remove the code from your file.
Make a selection (without using the mouse) and use ⌥⇧↑ (macOS) / Shift+Alt+Up Arrow (Windows/Linux) or ⌥⇧↓ (macOS) / Shift+Alt+Down Arrow (Windows/Linux) to move that selection to the target line. The selection gets dragged along, in view.
With cut-and-paste, you have semi-dangerously remove your code, then make a new line to put place the selection, then paste.
Reformat Your Code
Reformat a specific piece of code or the whole file according to your preferences.
The Problem
You're busy hammering out line after line of amazing code but when you're done, and you look up to marvel at your masterpiece, you see that the indentation is all wrong.
The Solution
You can quickly reformat the whole file by invoking "Reformat Code" ⌘⌥L (macOS) / Ctrl+Alt+L (Windows/Linux).
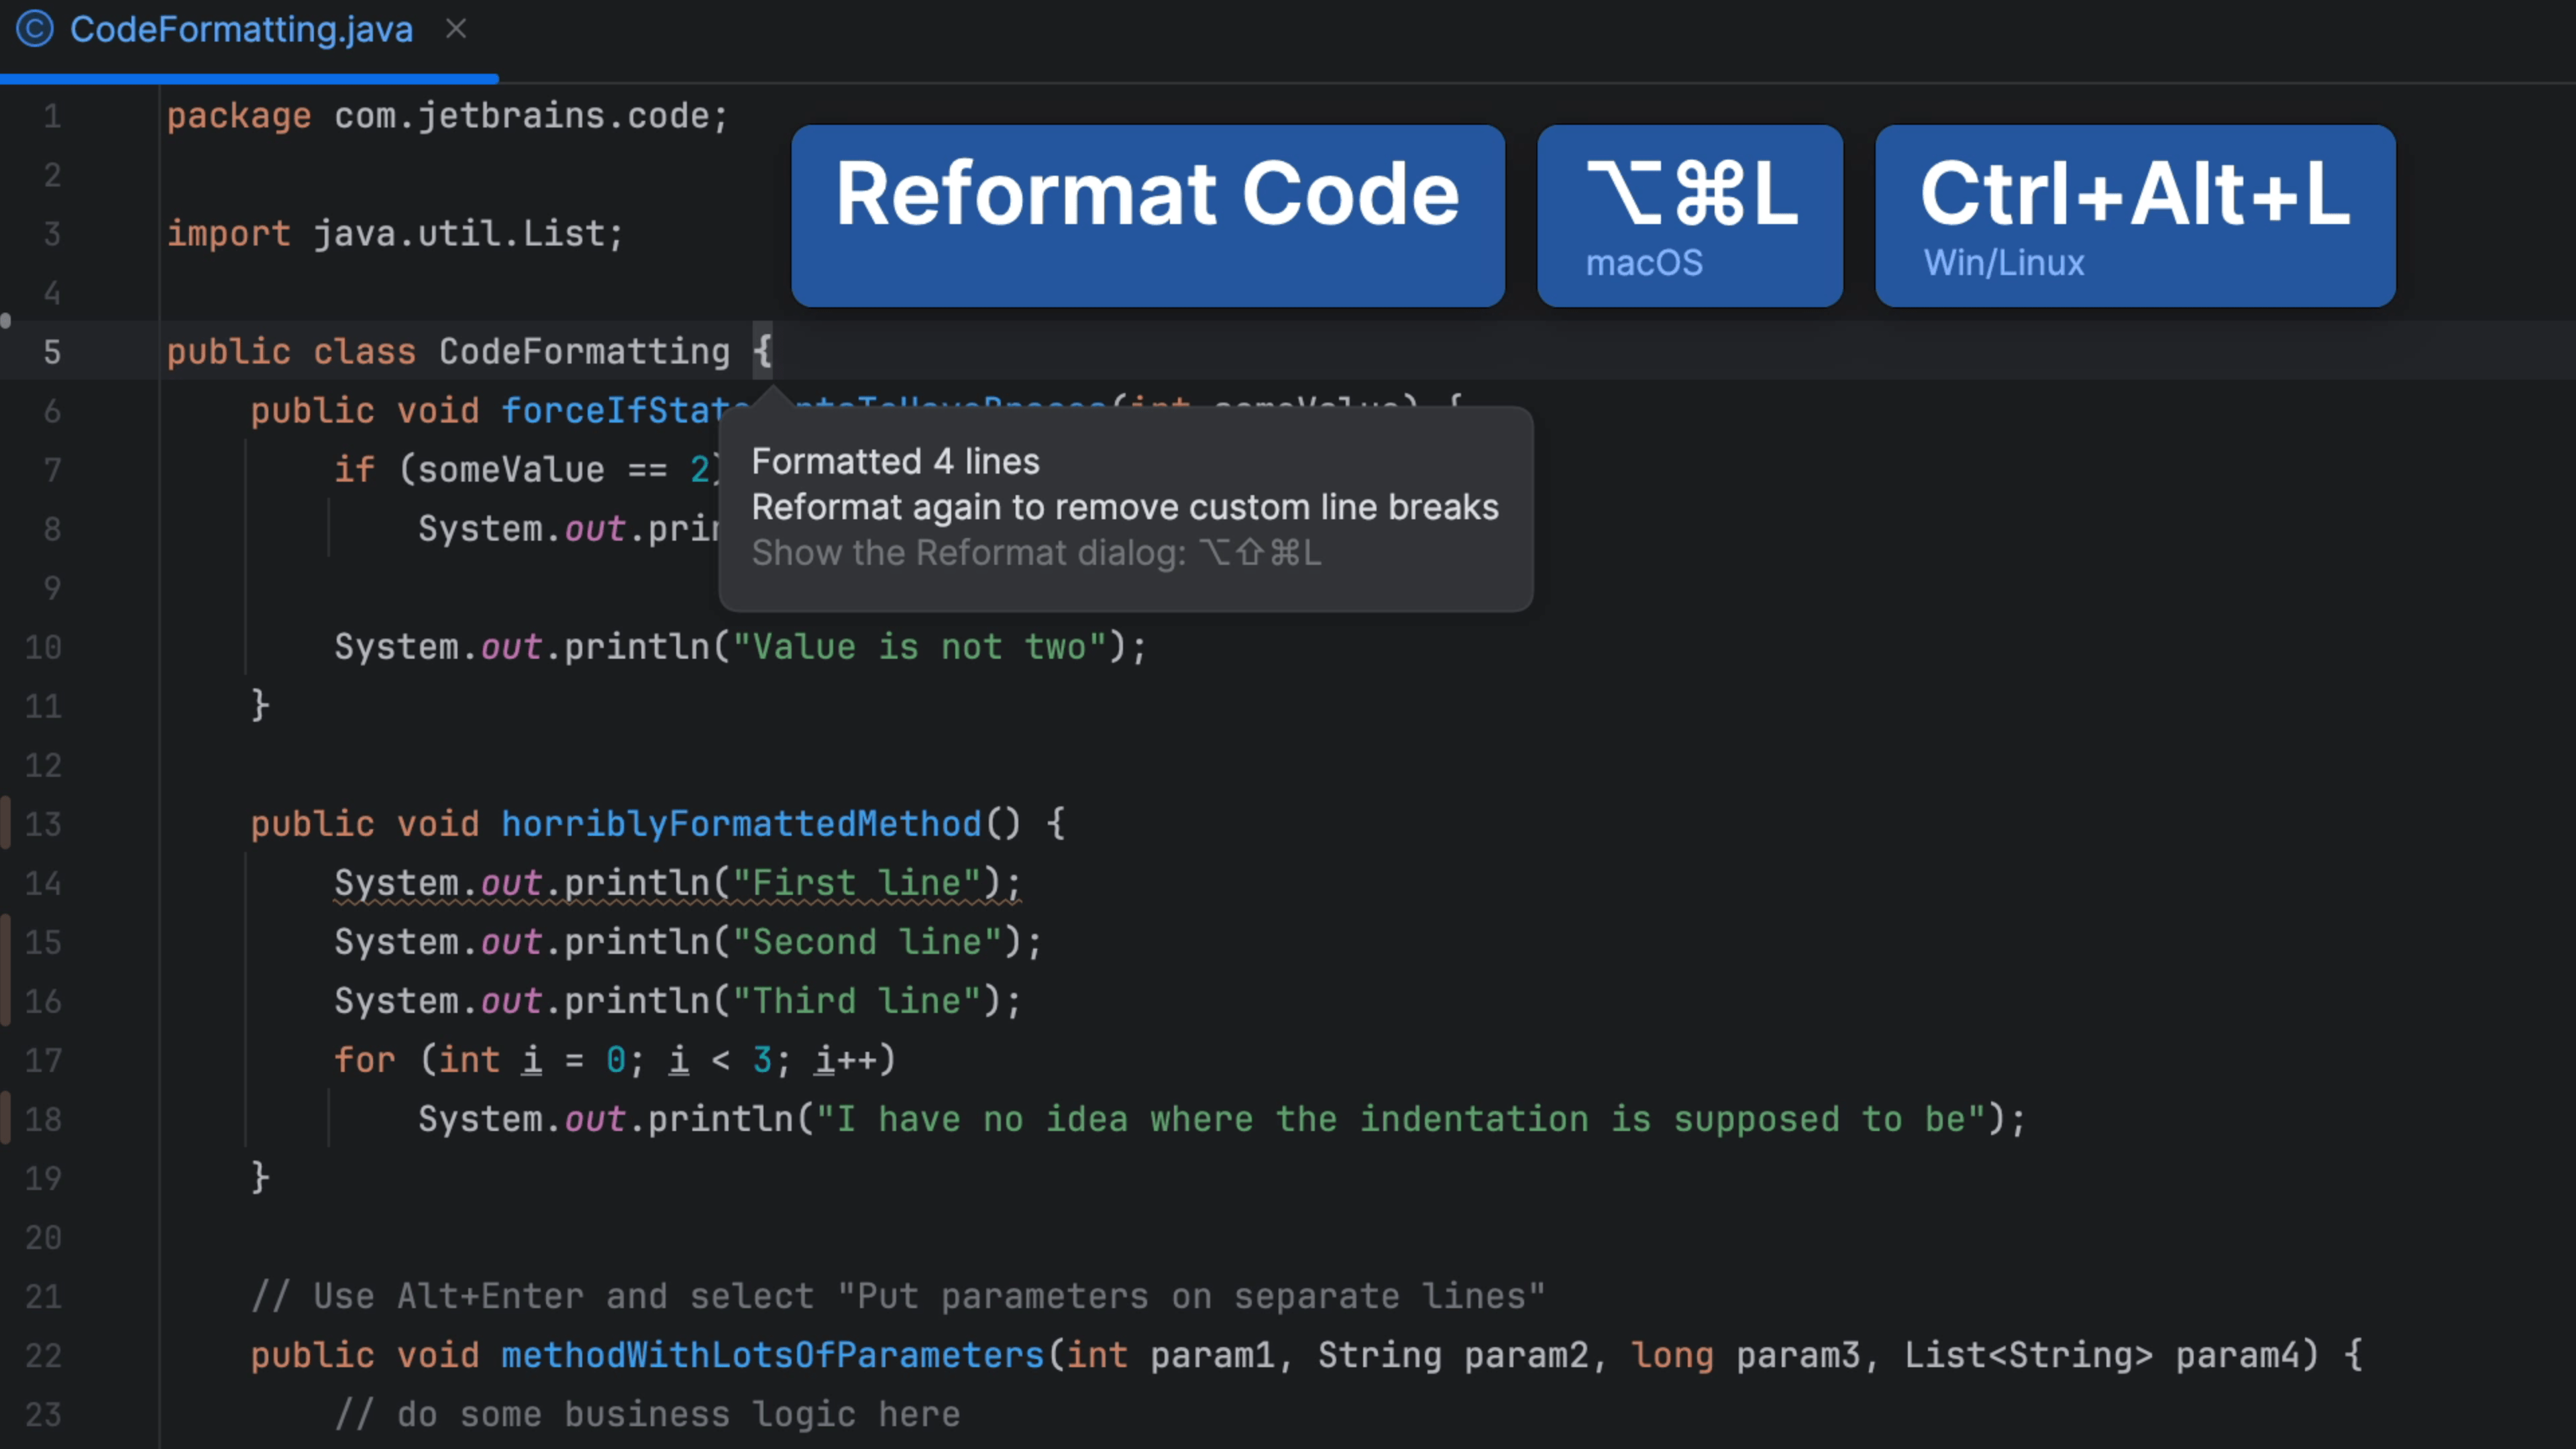
As you'd expect, this works in any JetBrains IDE.
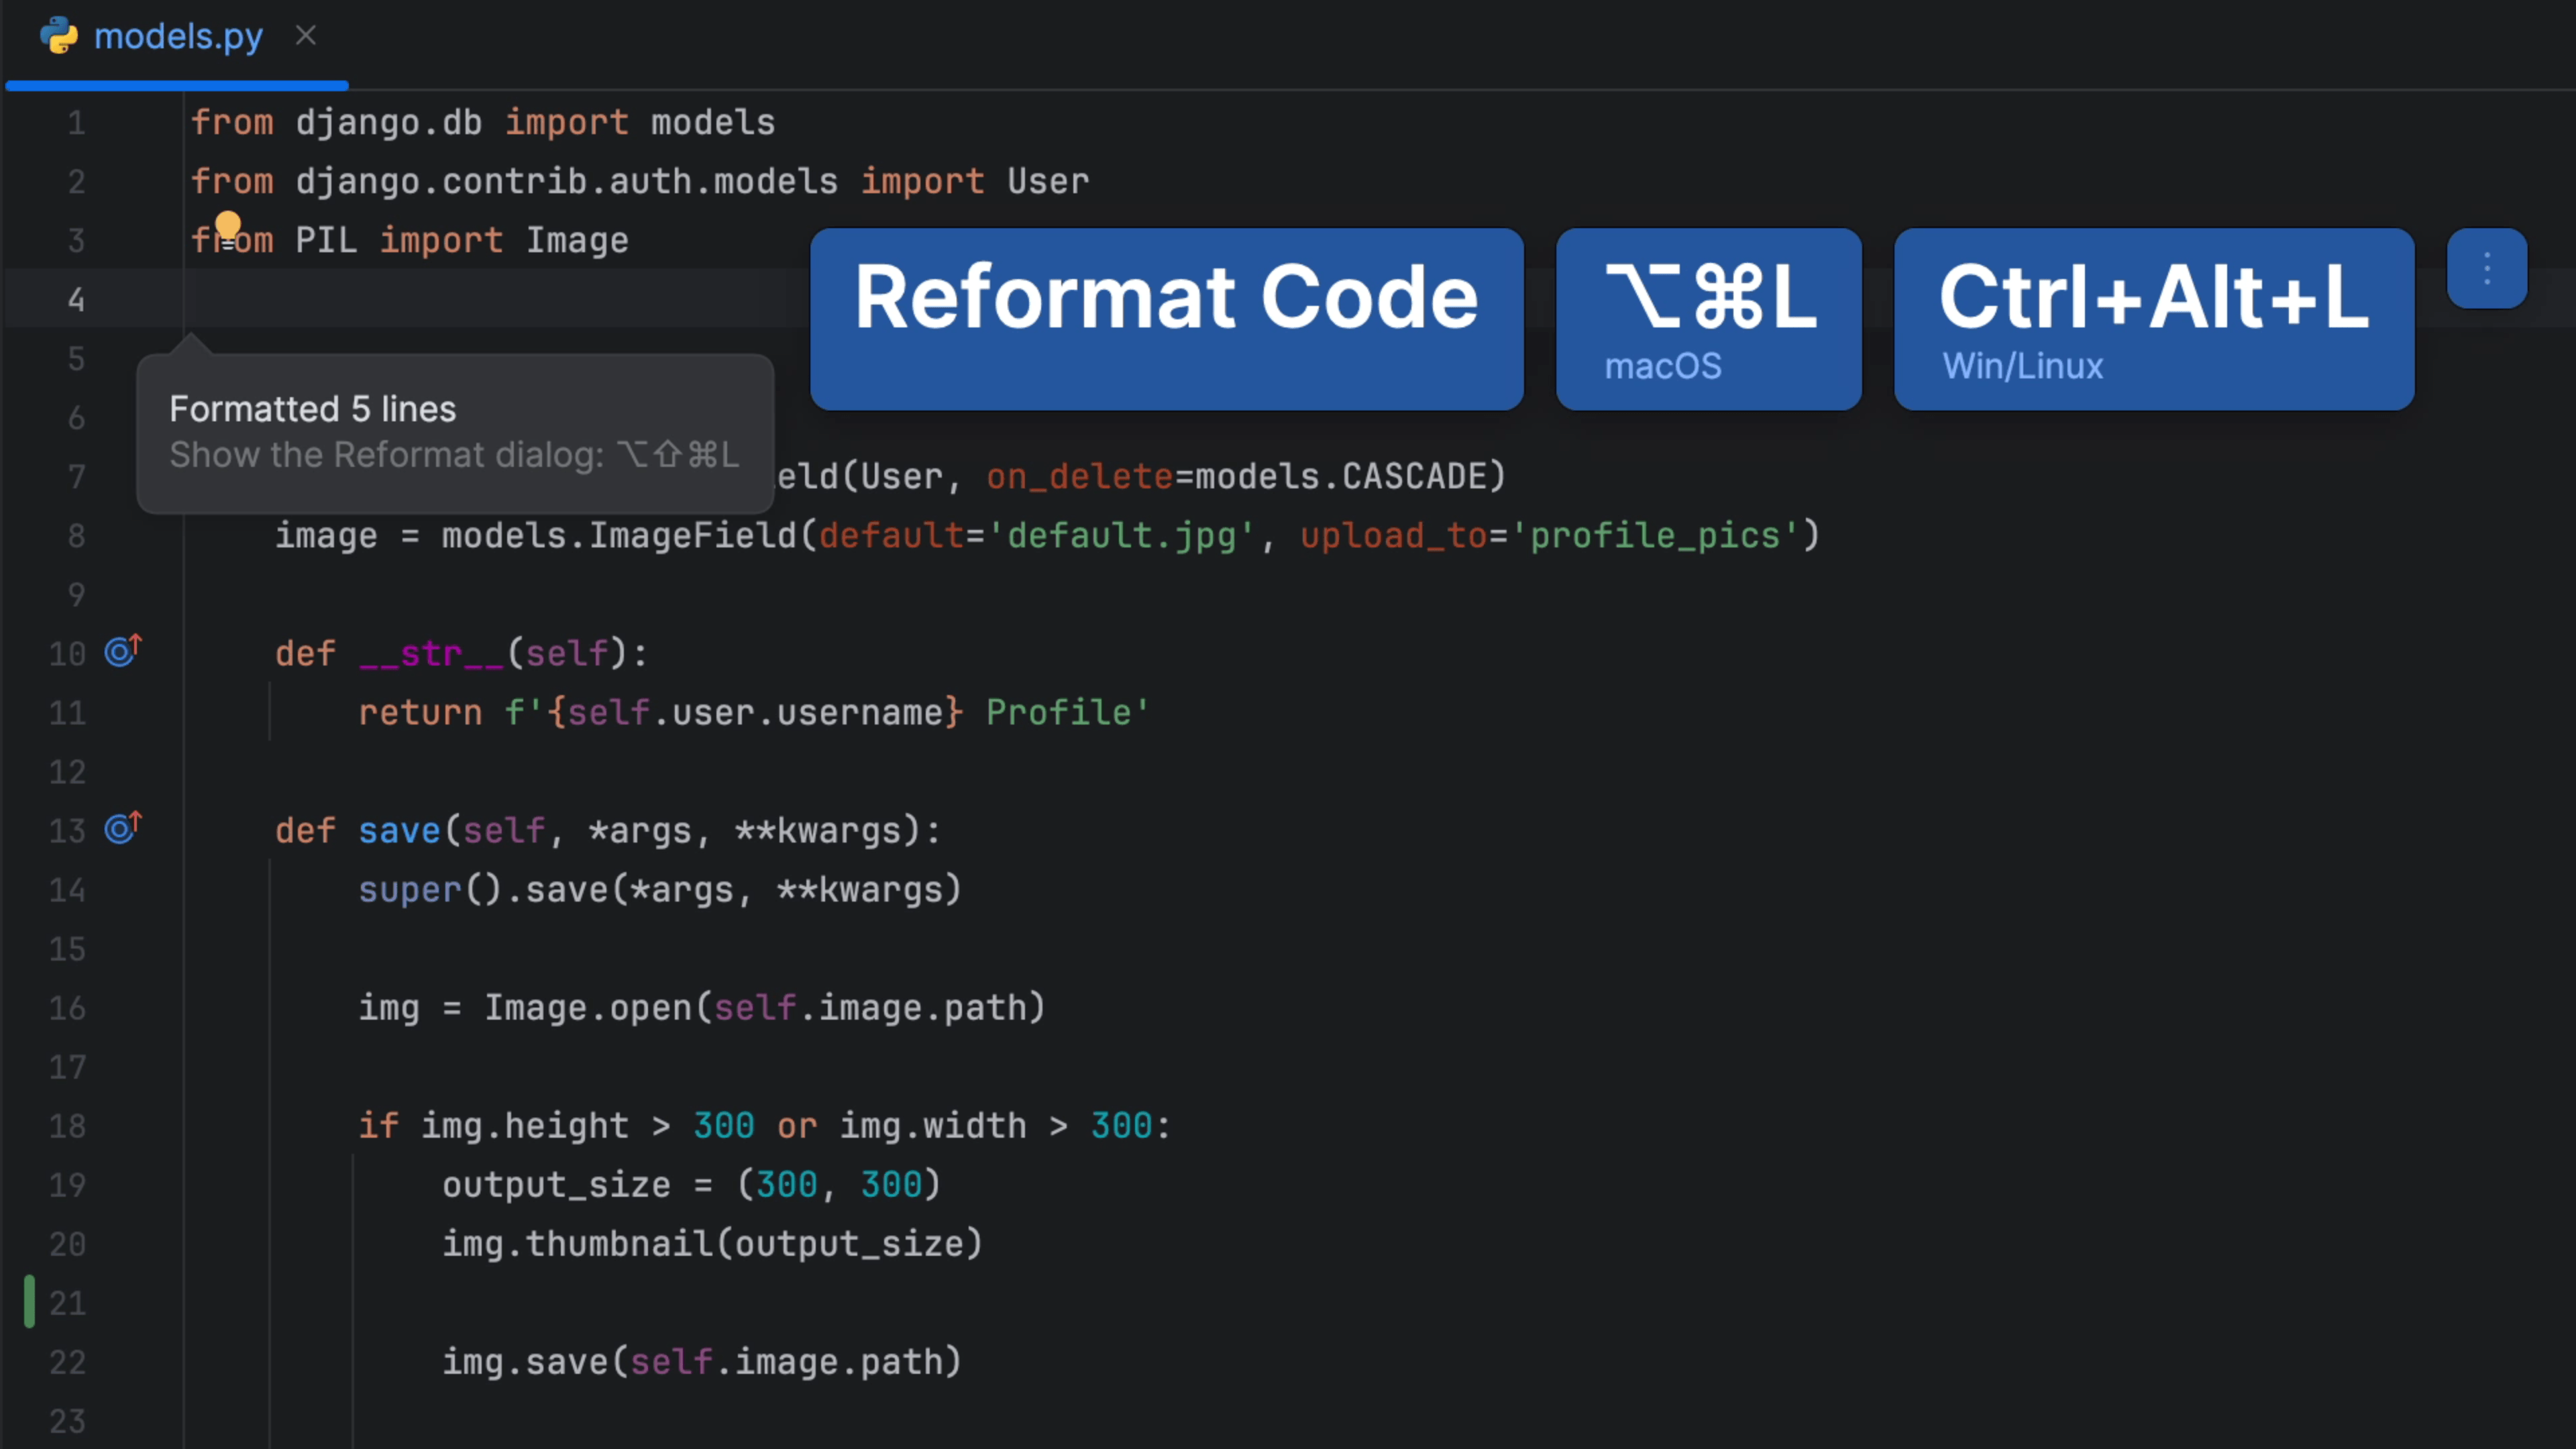
However, what if you just want to reformat just one block of code? For example, maybe the whole team changed their code style, and you don't want a large full file reformat to be part of this specific commit. In that case, select the code you want to reformat and again invoke "Reformat Code" ⌘⌥L (macOS) / Ctrl+Alt+L (Windows/Linux).
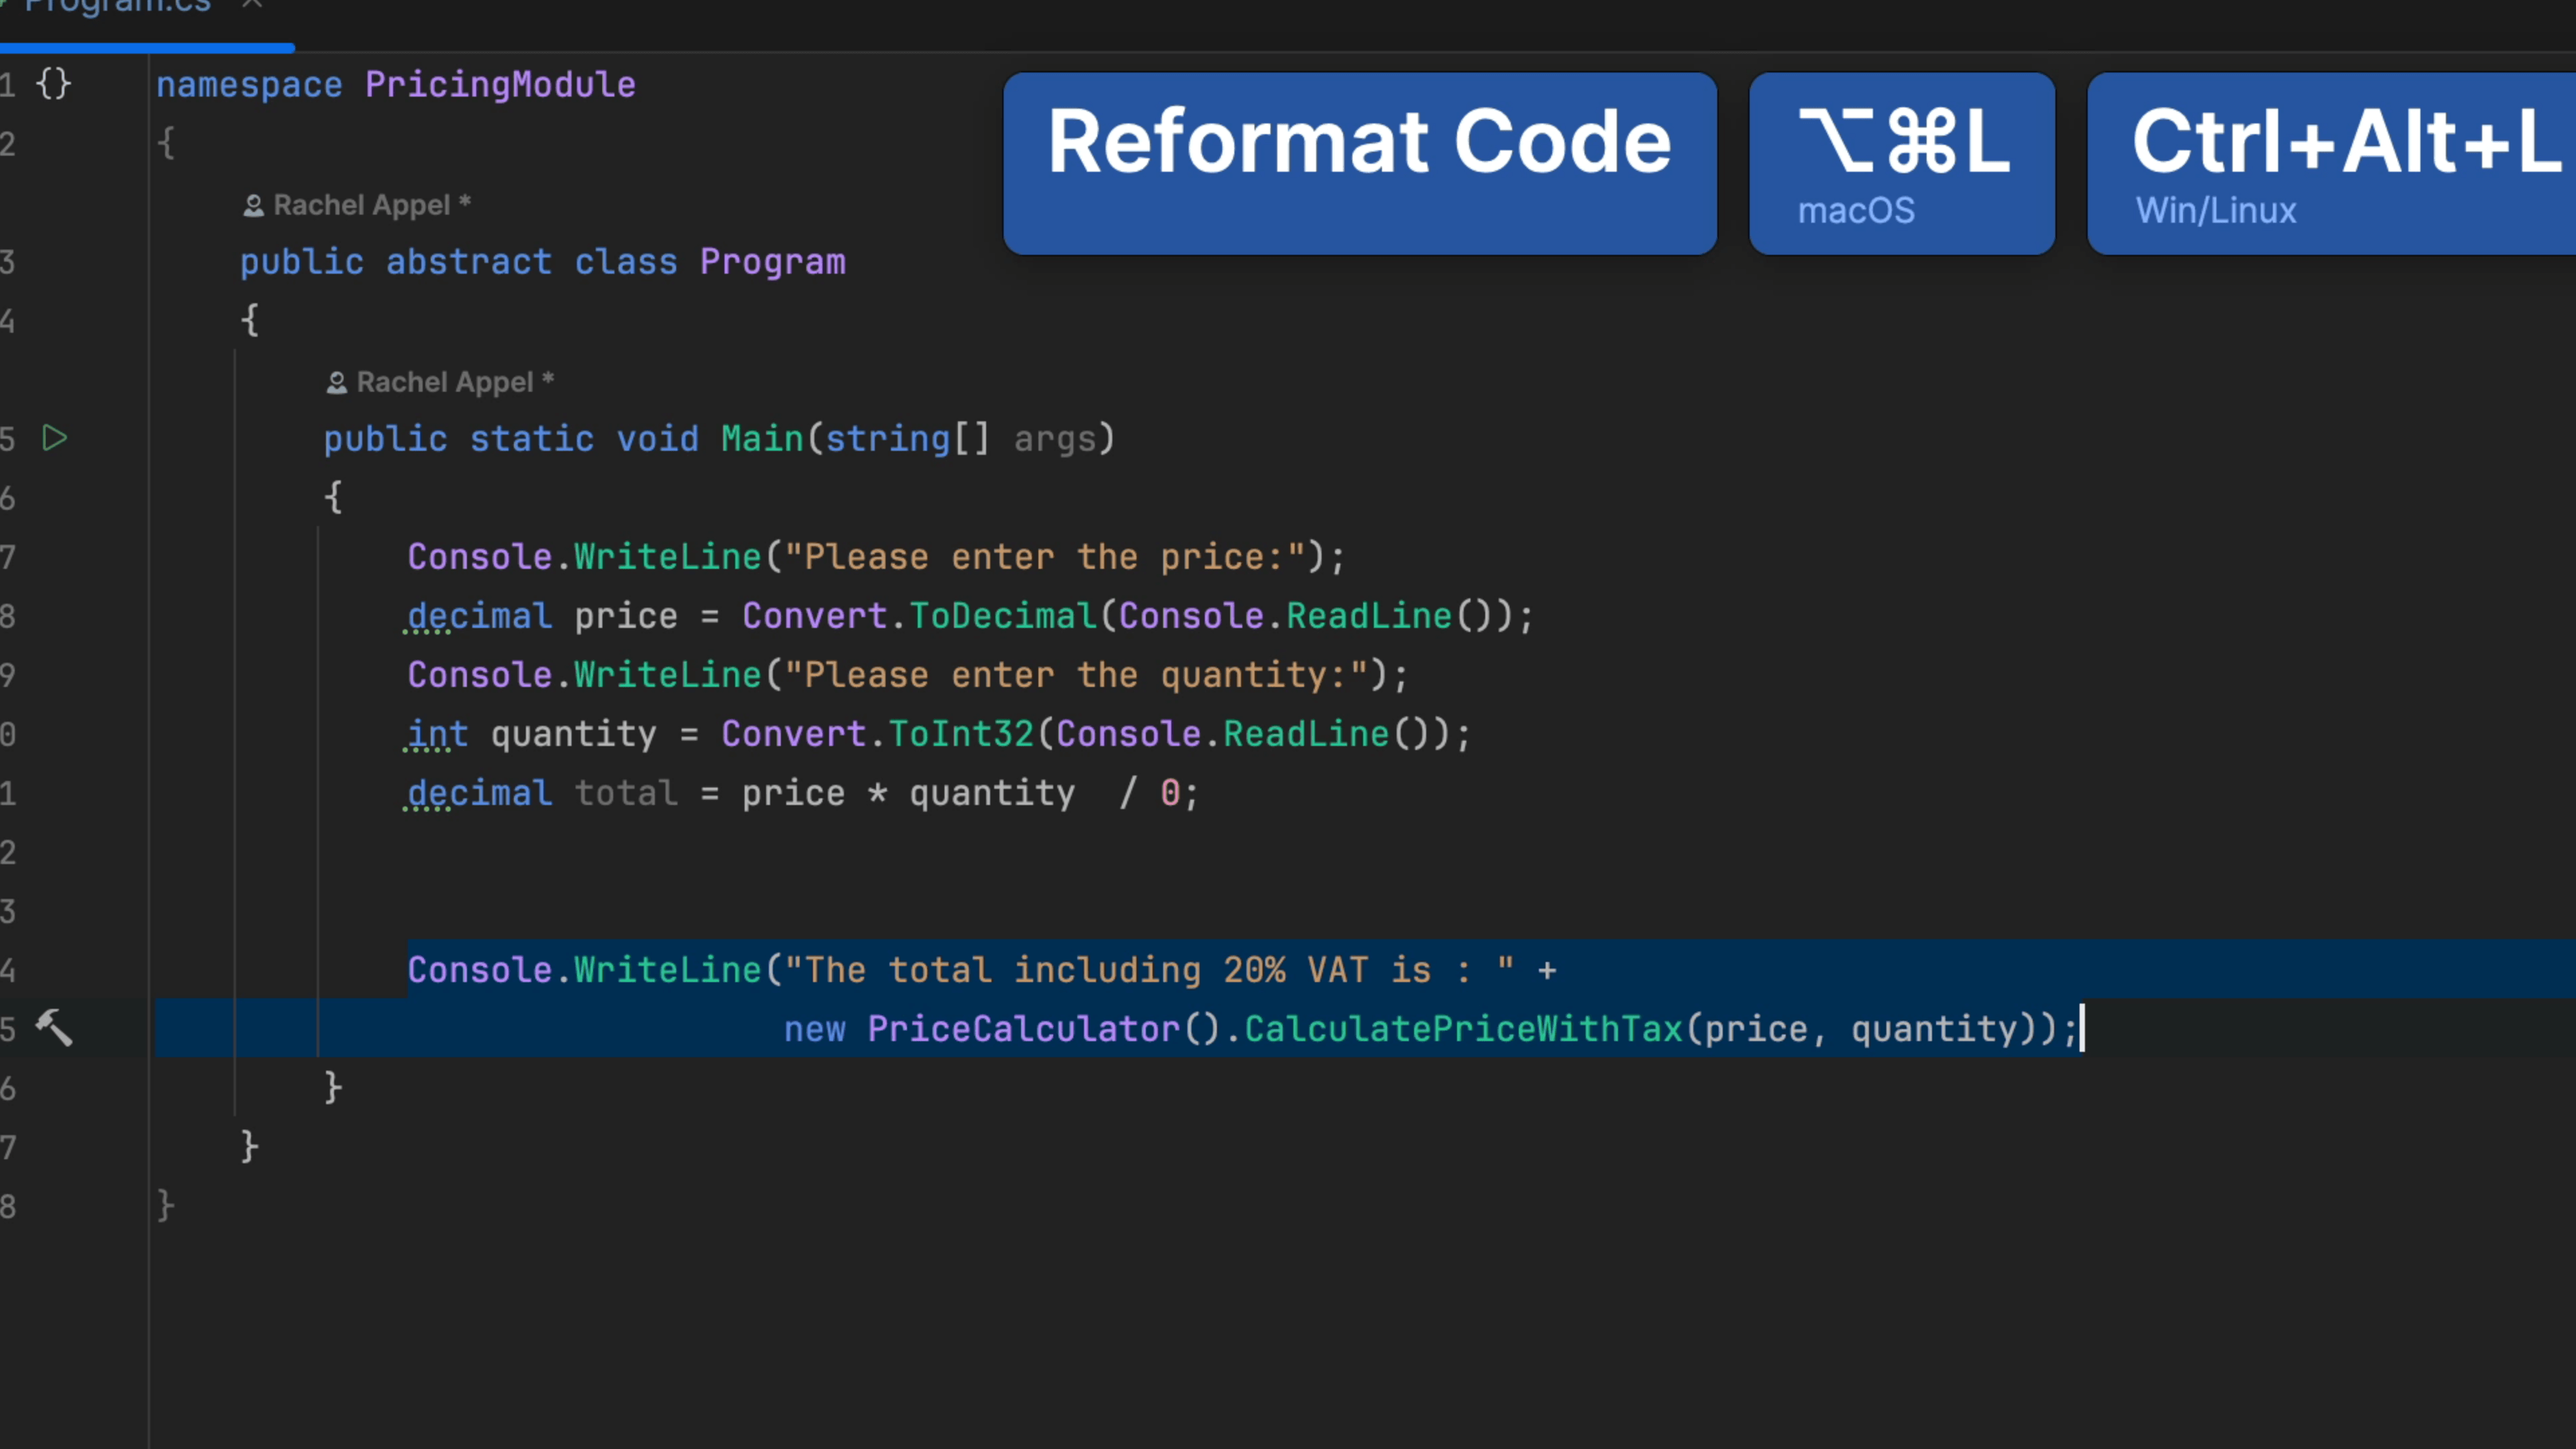
You can reformat code at the directory level too! Invoke your Project tool window ⌘1 (macOS) / Alt+1 (Windows/Linux), select the directory you want to reformat and invoke "Reformat Code" ⌘⌥L (macOS) / Ctrl+Alt+L (Windows/Linux) again. A word of warning here, you probably don't want to mix large commits that include reformatting and code changes - it can make deciphering the commit harder for the next person.
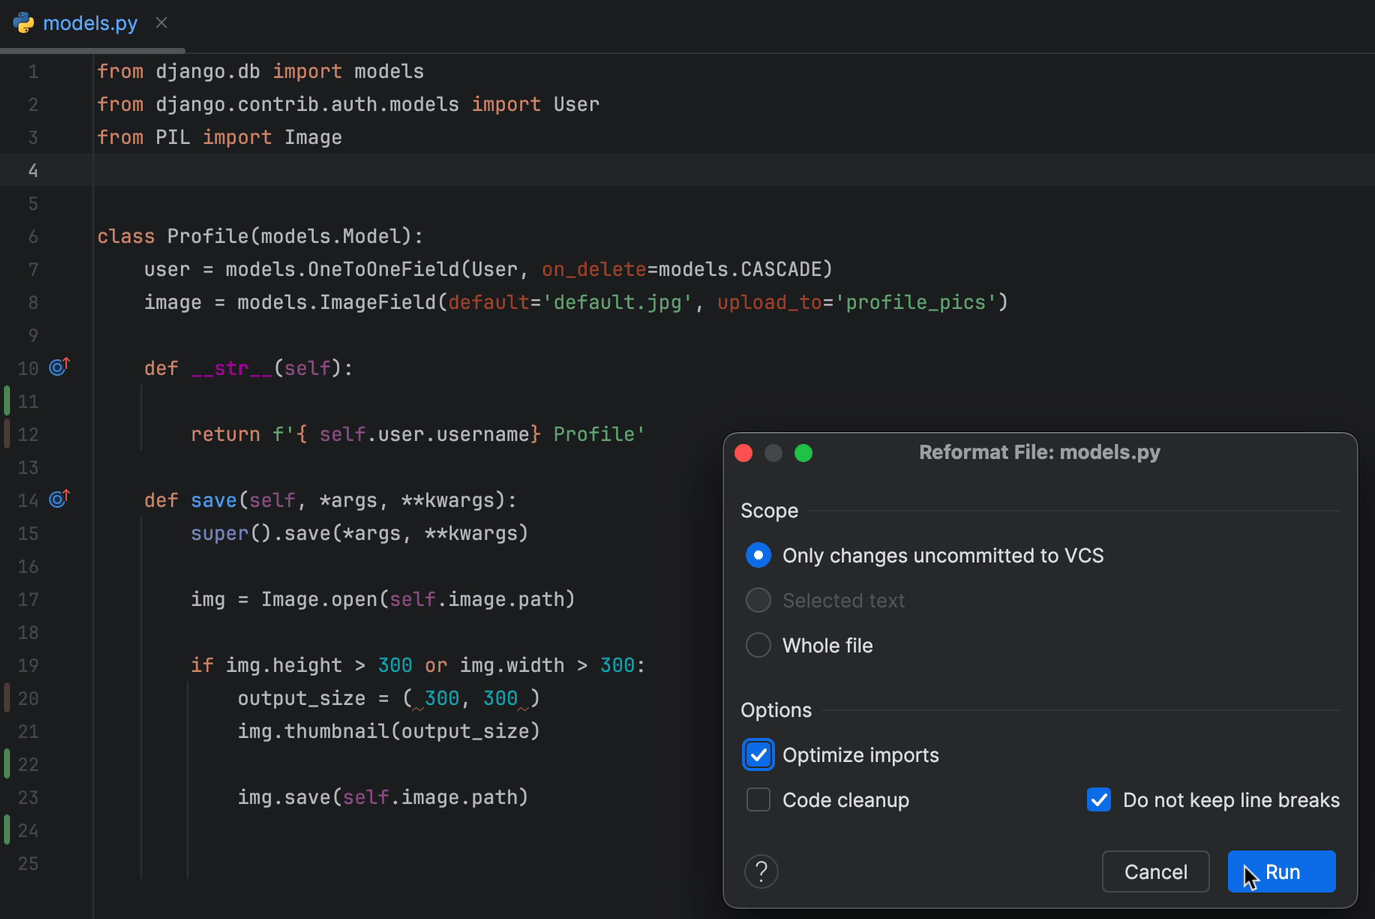
Lastly, there are additional settings you can use for reformatting your code which you can access by invoking the "Reformat Code Dialog" ⌘⌥⇧L (macOS) / Ctrl+Alt+Shift+L (Windows/Linux). The options here will vary depending on which type of code you're working with so try it out and see what you can learn!
Want to learn more?
 Check out the in depth reformatting tutorial for IntelliJ IDEA
Clean Up Messy Imports With Optimize Imports
Quickly remove any unused imports and more.
With the Optimize Imports action ⌃⌥O (macOS) / Ctrl+Alt+O (Windows/Linux), you can quickly remove any unused imports, merge imports from the same module, and optionally sort the import statements.
Generate Imports While Typing
Avoid interruption by letting PyCharm generate your imports as you type.
This is the right way to do imports.
As you are typing a symbol, you have to both finish typing the symbol -- and without a typo -- and you have to import it. For the import, you have to stop what you're doing, scroll up, enter the import in the correctly-sorted PEP8 way, etc.
Let PyCharm do all of that. While typing, press ⌃␣ (macOS) / Ctrl+Space (Windows/Linux) to tell PyCharm to autocomplete on symbols from modules. When you select the completion target, PyCharm will also generate the import -- in the right place, merging it with an existing import if needed.
Auto Install and Import Packages on the Fly
Start typing a name in the editor. If the name references a class that has not been imported you can import it and add the import in one step.
The Problem
Let's say you want to install and create the import statement for a new package you've just typed.
The Solution
Easy, invoke Context Actions ⌥⏎ (macOS) / Alt+Enter (Windows/Linux), then choose Install and Import package.
PyCharm will install the package and create the import according to your project styles.
Adding Fields In a Constructor
Let your IDE add constructor arguments to your instance.
The Problem
It's one of those chores...your class has an __init__ with some arguments, and you need to assign them to self. What a lot of typing.
The Solution
Let the IDE do it for you. As you type the argument name, press ⌥⏎ (macOS) / Alt+Enter (Windows/Linux) and choose Add 'field' to constructor.

PyCharm will create the assignment for you.
Rename a File and its References
Change your mind on a file name and the IDE makes all the changes for you.
You made a file. You tried to choose the right filename. You then used it all over your project.
Now you've changed your mind.
It's sitting there, annoying you, but you can't be bothered to find all the places that use it. Search and replace might find a bunch of false positives. You'd really like something that understood symbols, and just in imports.
Select the file and use Refactor | Rename ⌃T (macOS) / Shift+Ctrl+Alt+T (Windows/Linux) and then '1' to change the name of the file and occurrences. This will also adjust VCS. Best of all, if you change your mind, *Undo puts it all back as one editor transaction.
Interested in renaming symbols?
You can rename any symbol in your codebase. Check it out!
Rename Symbol
Change a variable name, class name, or other symbol, across the project.
You wrote a function which you use all over the place in a project. Or a class. The name no longer matches its purpose. But the change is too much of a hassle.
The IDE knows where it is used. Even better, it knows the difference between usage in your project vs. finding it in a dependency, and best of all, usage as a symbol vs. just some letters in a string.
What if the same symbol name is used in two Python modules? Yep, PyCharm can tell the difference and only rename to the appropriate the symbol from that module.
Same for method names. Have the same method in two classes? Refactor Rename ⇧F6 (macOS) / Shift+F6 (Windows/Linux) will look in your project for the correct usage and rename it.
Simply put your cursor on a symbol and use Refactor | Rename ⌃T (macOS) / Shift+Ctrl+Alt+T (Windows/Linux) and then '1' Provide the new name, preview the places it found, and select Do Refactor.
Change your mind? Refactoring is done as a single editor transaction, meaning Undo reverts all the places that were renamed.
Quick Documentation
View arguments and documentation without interrupting your flow.
We frequently encounter code that we're not sure about. Other people's code. Heck, even our code. Sometimes we just want the arguments for a function. Other times we want to know positional versus keyword args. Or the types of the arguments. Or their default values. Or a nice rendered docstring.
PyCharm has several facilities for showing you documentation about a symbol.
First, Quick Documentation F1 (macOS) / Ctrl+Q (Windows/Linux) brings non-obtrusive inline popup showing all that information, with a hyperlink where you can navigate to the definition. Press it again and the popup turns into a tool window which updates for each symbol that you land on. Always there, always helping...until you want to hide it, like any other IDE tool window.
Want the full docs in a browser, but don't want to hunt around to find it? For many popular packages, External Documentation ⇧F1 (macOS) / Shift+F1 (Windows/Linux) brings up a browser on the documentation page for that symbol.
View Parameter Info
Quickly see function arguments and argument types.
Some functions or classes -- well, let's admit it, they are kind of chatty. They require lots of arguments, have lots of optional keyword arguments, some with default values.
So you stop, go look at the function, and come back to what you were doing.
There's a better way. With your cursor in the parentheses, invoke Parameter Info ⌘P (macOS) / Ctrl+P (Windows/Linux). You get a tiny popup with the positional and keyword arguments, along with any default values. Bold is used to mark the current spot in the parameter list that your cursor is at.
You can invoke this before you type any parameters, after you've typed a few, or later if you come back to make a change.
Run From Keyboard
Use the keyboard to select and run a run configuration.
These tips have a recurring theme: use your keyboard, not your mouse. Running your code should be the same way.
Use the Run action ⌃⌥R (macOS) / Shift+Alt+F10 (Windows/Linux) to get a popup listing your defined run configurations, both permanent and temporary. You can then use the arrow keys or speed-type to highlight the one you want to run, pressing ⏎ (macOS) / Enter (Windows/Linux) to select and execute it.
"Select" is used intentionally: one you select this run configuration, it is the active one, and the simpler Run "your configuration" action ⌃⌥R (macOS) / Shift+Alt+F10 (Windows/Linux) will immediately run it.
You can do more from the keyboard than just run it. Each entry in the popup has a submenu which you can access by pressing the right arrow. This lets you choose how you want to run it (Run, Debug, Coverage, Profile, Run under the concurrency diagram, etc.) as well as edit that configuration or delete it.
Debugging is popular option, so it gets its own popup sequence. Use the Debug action ⌥⌘R (macOS) / F9 (Windows/Linux) to give the popup, but leading directly to debugging (to skip the submenu step.) Once selected, you can re-run that debug configuration with the Debug <your configuration> action ⌃D (macOS) / Shift+F9 (Windows/Linux).
Again, for both the run popup and debug popup, don't forget to speed type to select, instead of the arrow keys.
There are, obviously, many other ways to run your code (menus, right click, gutter icons, tool window buttons.) For keyboard-centric folks, give this a try.
Working with Conditional Breakpoints
Learn how to stop your JetBrains IDE debugger when a certain condition is true.
The Problem
You have a bug in your code, but it's only happening when you've run through a certain number of iterations, or a certain condition is true. You don't want to sit there and click Step Over twenty thousand times, so what can you do?
The Solution
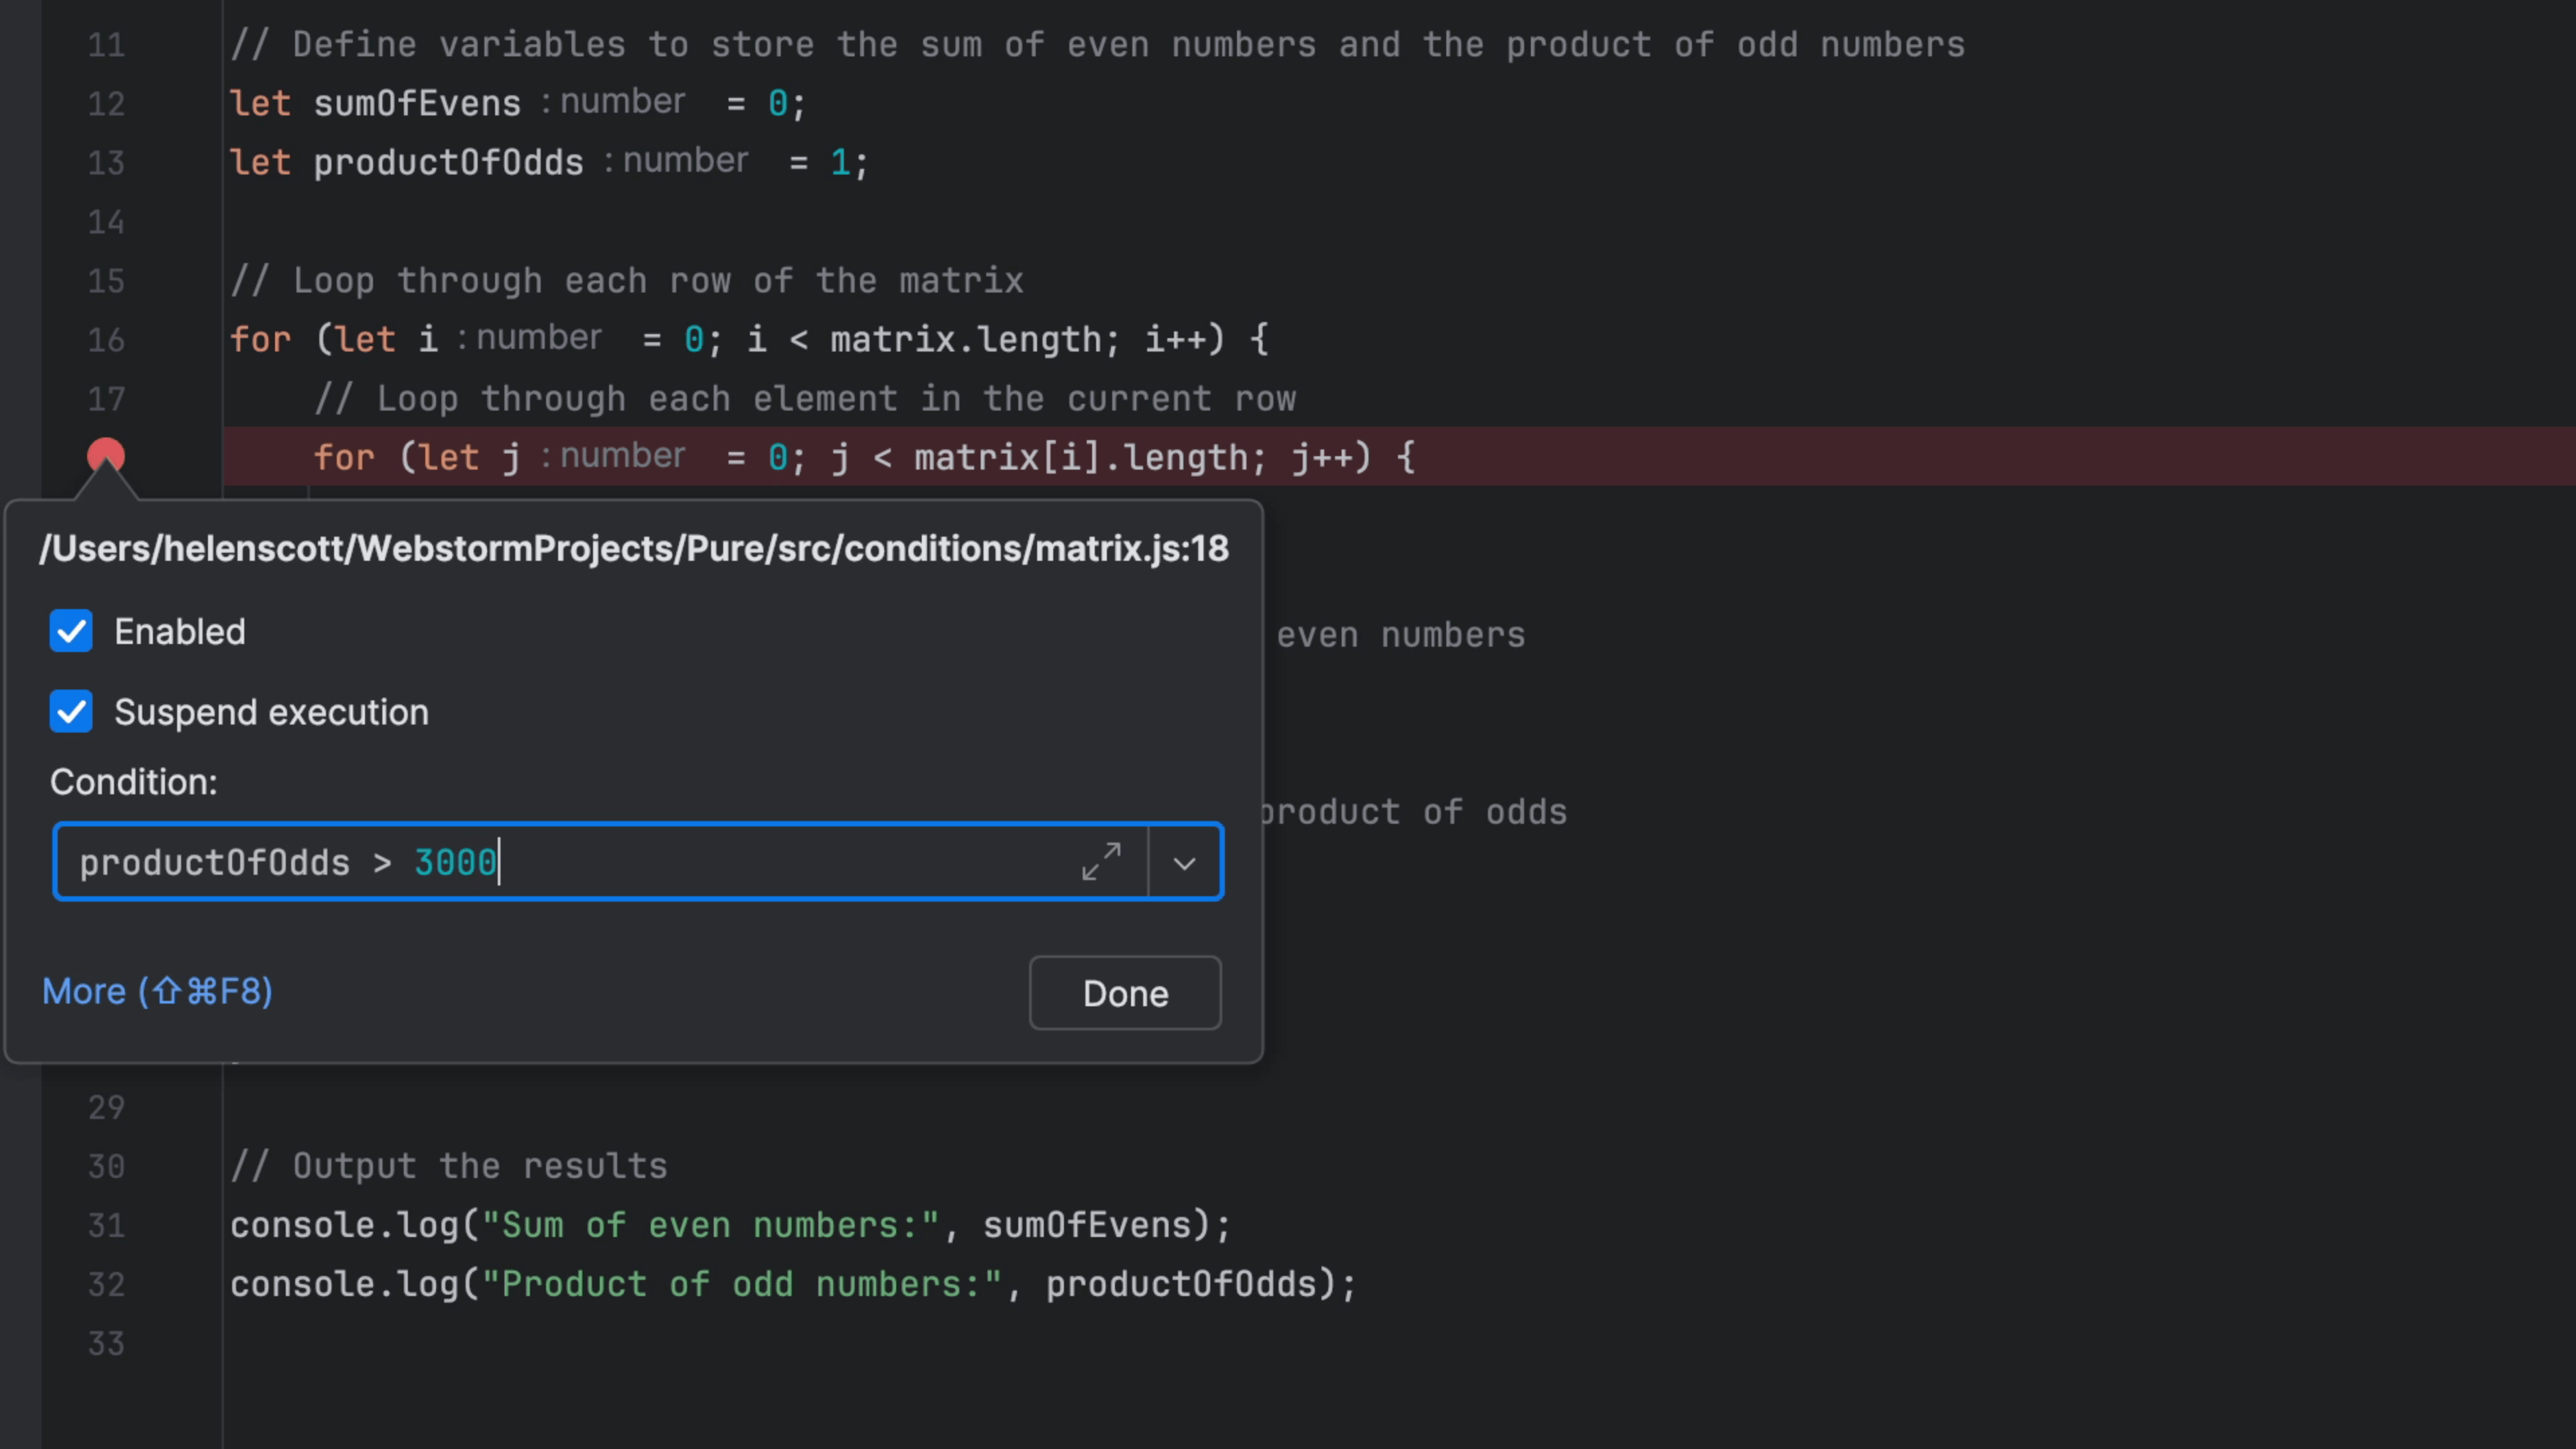
You can use the Condition property on the breakpoint to enter a boolean value and tell the debugger to stop when that condition becomes true.
Place your caret on the line you want to investigate and then invoke "Toggle Breakpoint" ⌘F8 (macOS) / Ctrl+F8 (Windows/Linux). Right-click on the breakpoint and enter a value that evaluates to a boolean and click Done:
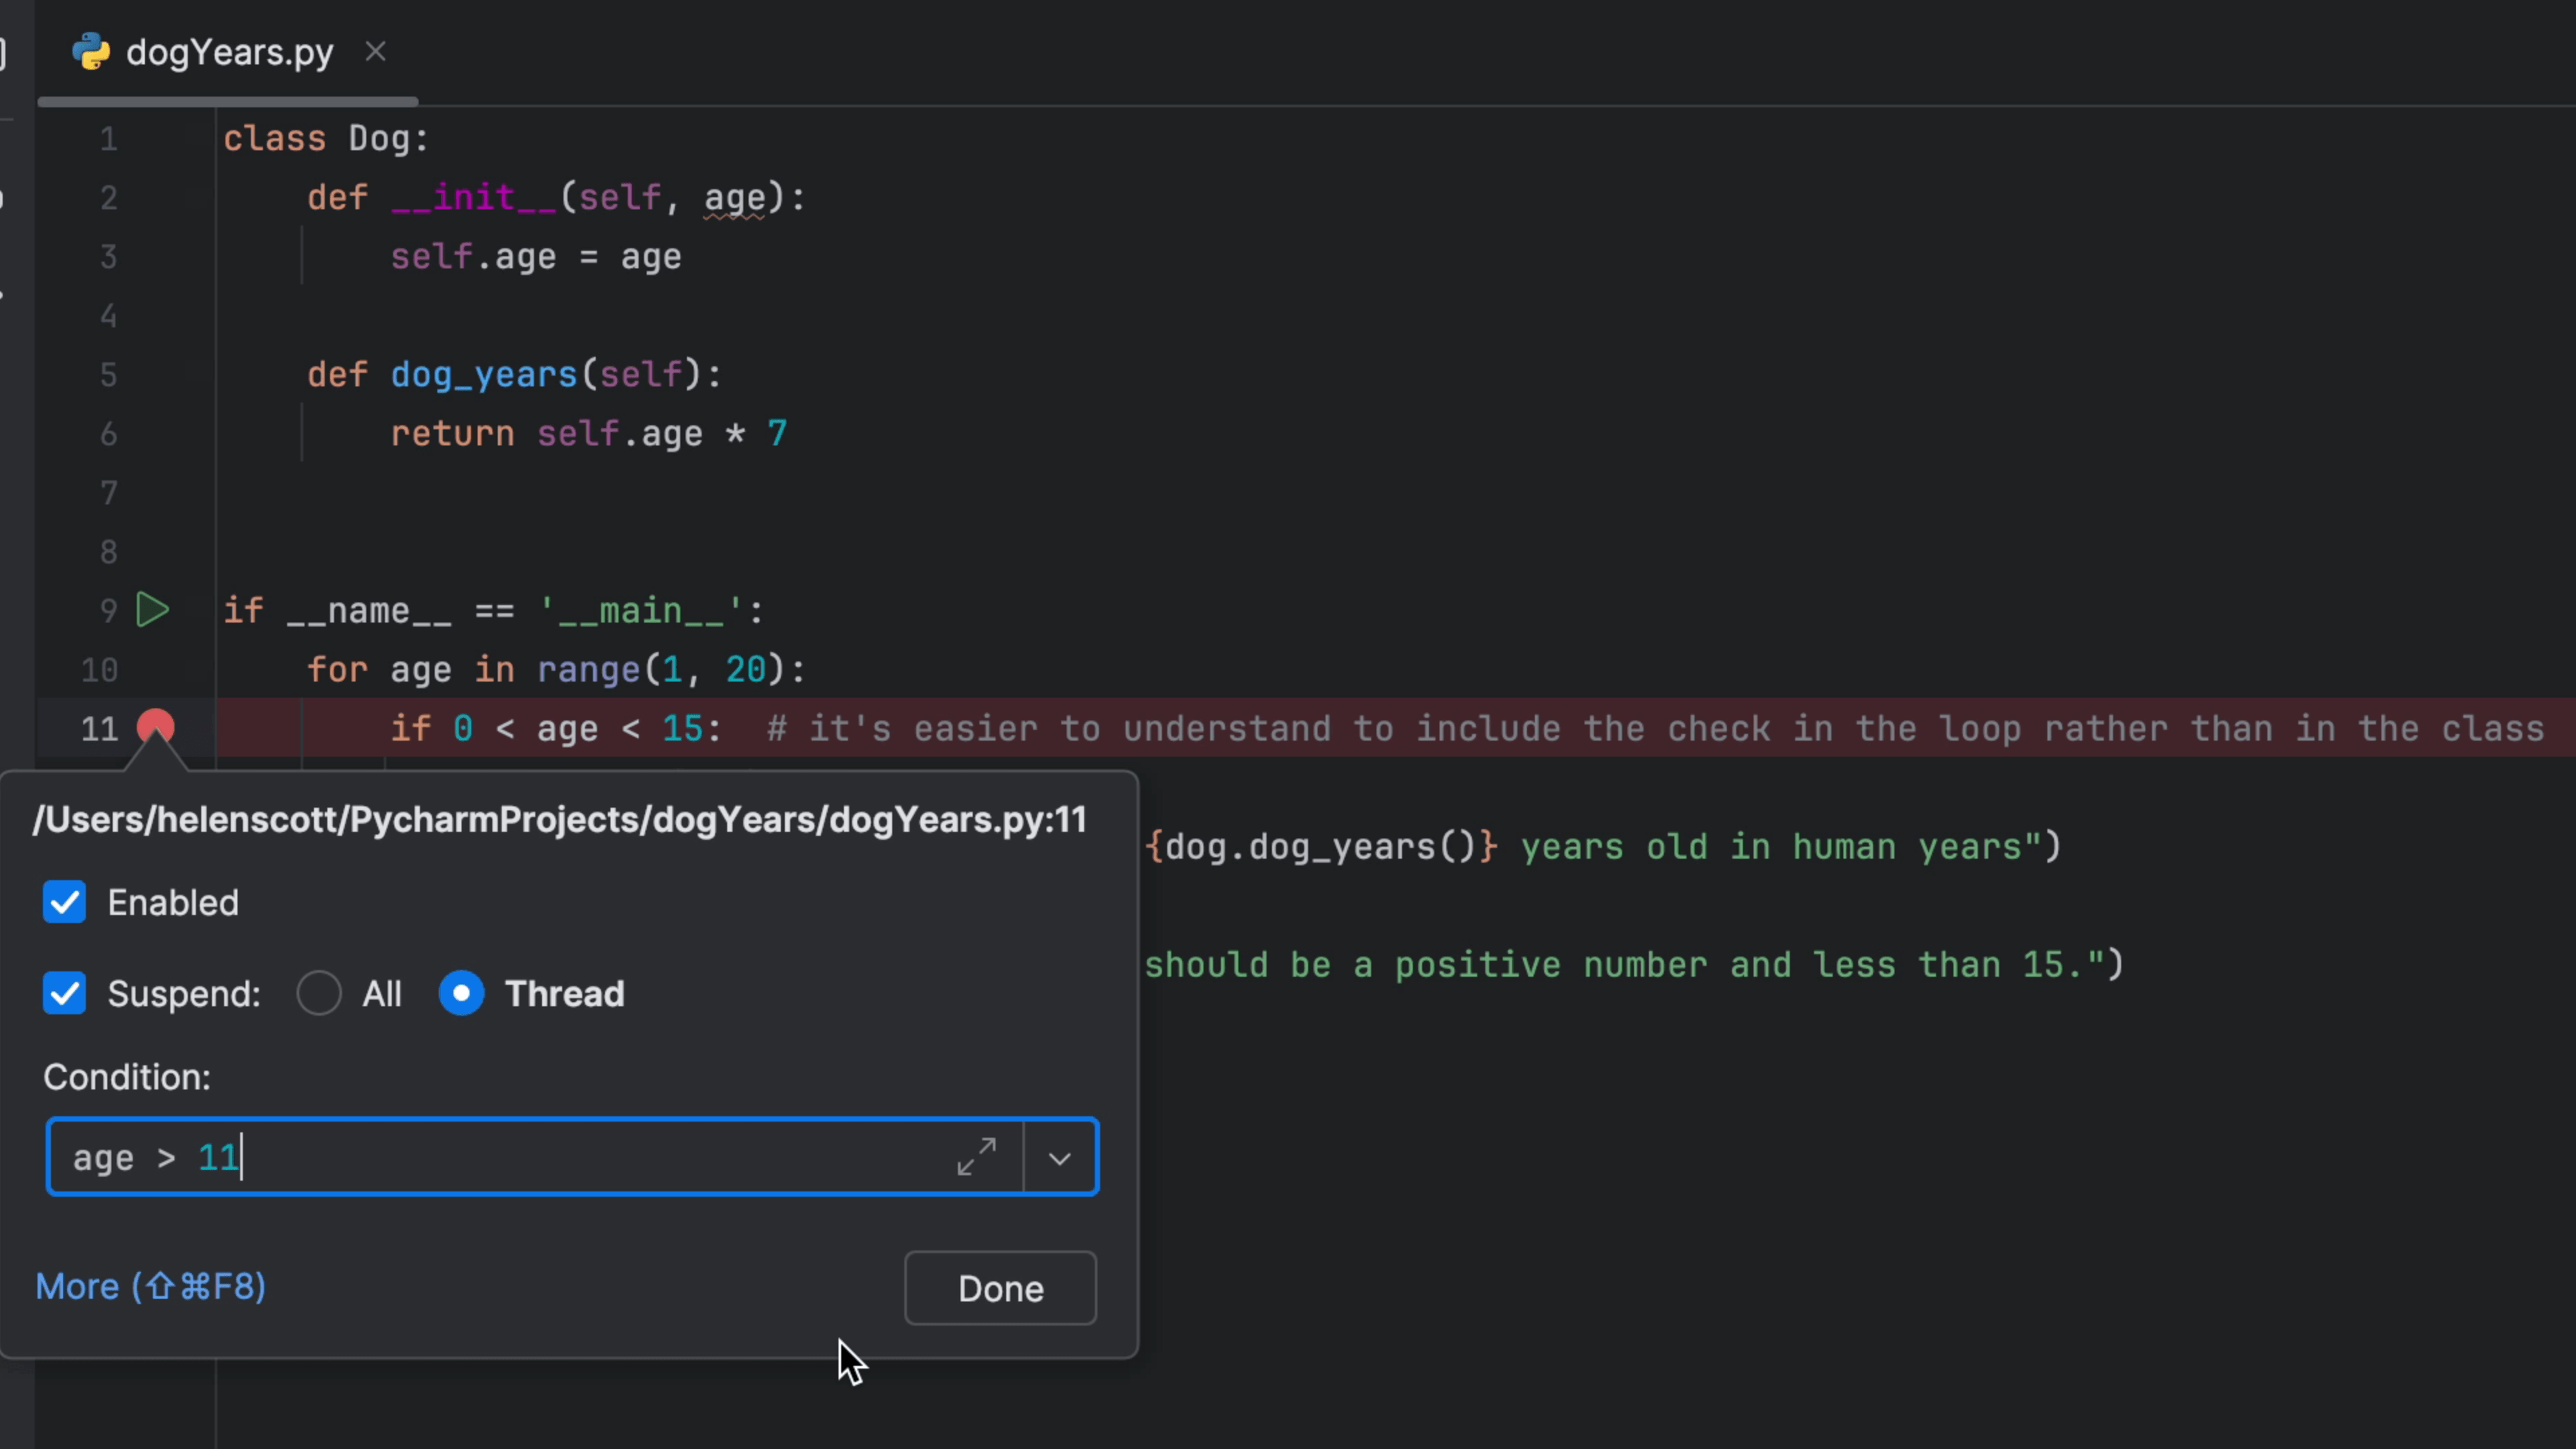
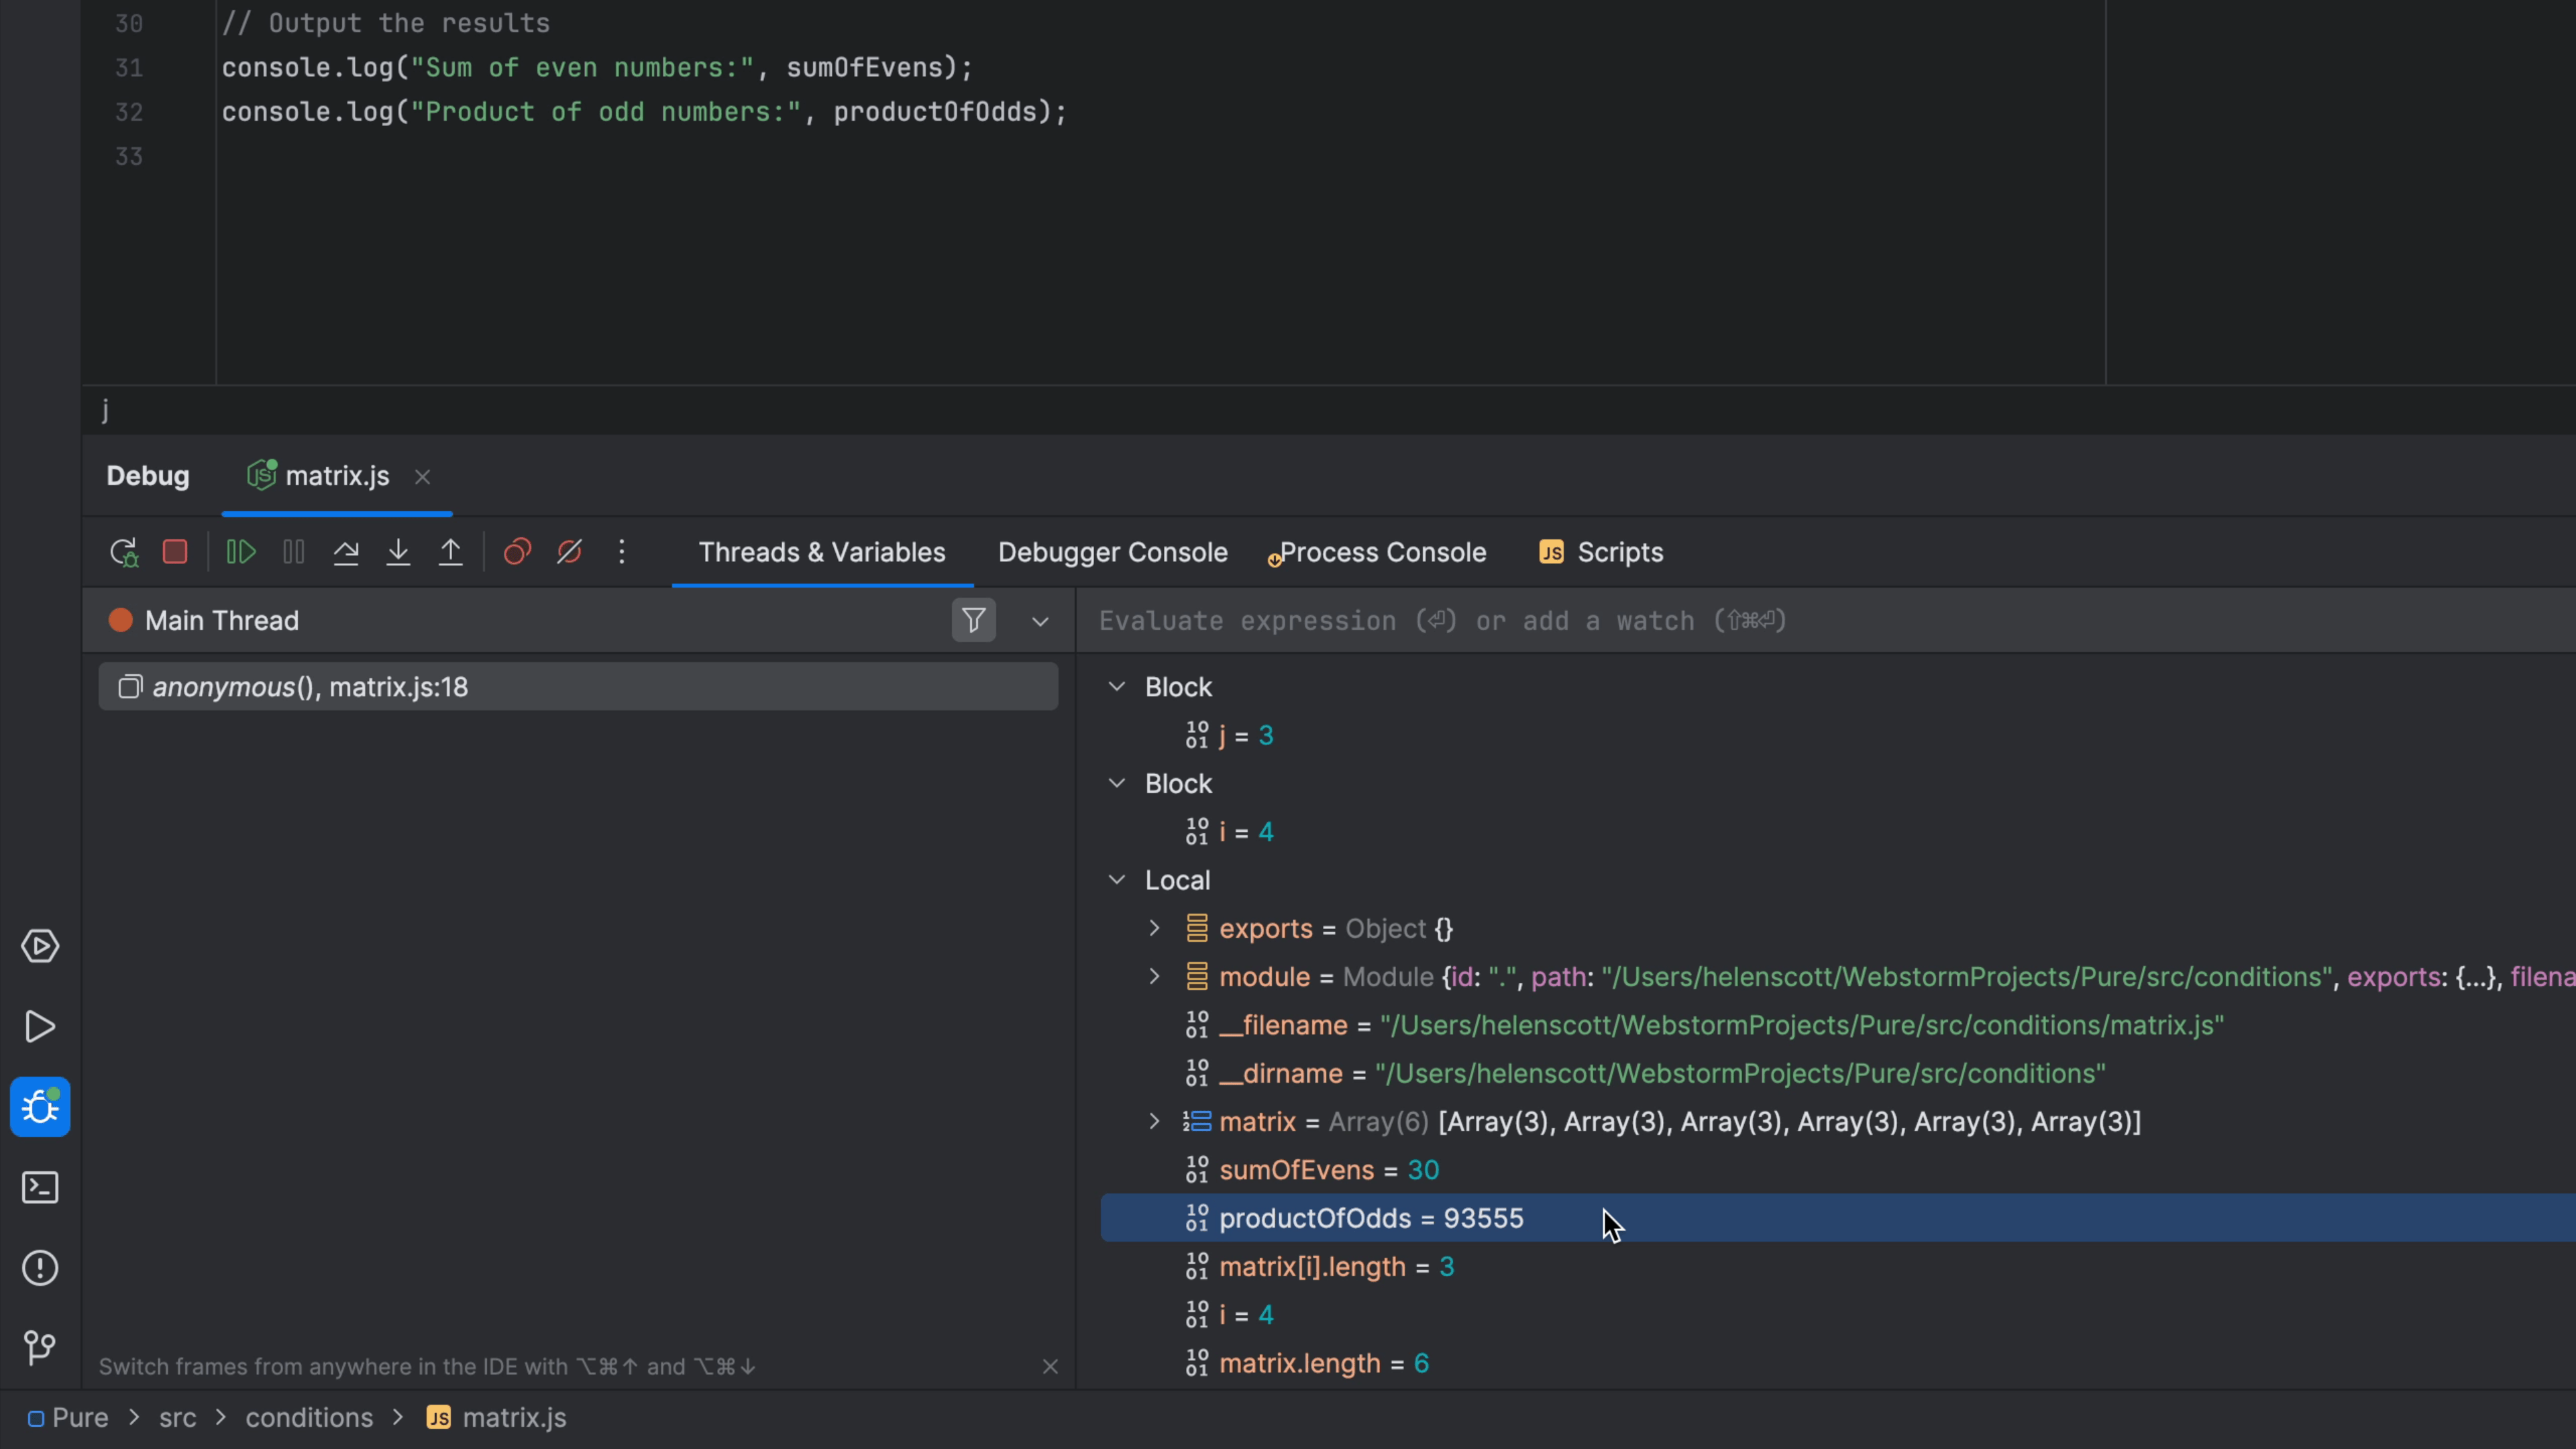
Invoke "Debug" with ⌃D (macOS) / Shift+F9 (Windows/Linux) and note that the debugger now stops when the condition is true:
This works in any JetBrains IDE. You can also hover your mouse over the line numbers in the gutter, right-click and select Add Conditional Breakpoint, once again entering a boolean expression in the Condition property and clicking Done:
Once again, the debugger will stop when your condition evaluates to true:
Side note here, if you prefer the debug icon to be adjacent to your line number rather than on top of it, you can right-click in the gutter and select Appearance and then clear Breakpoints Over Line Numbers to configure it.
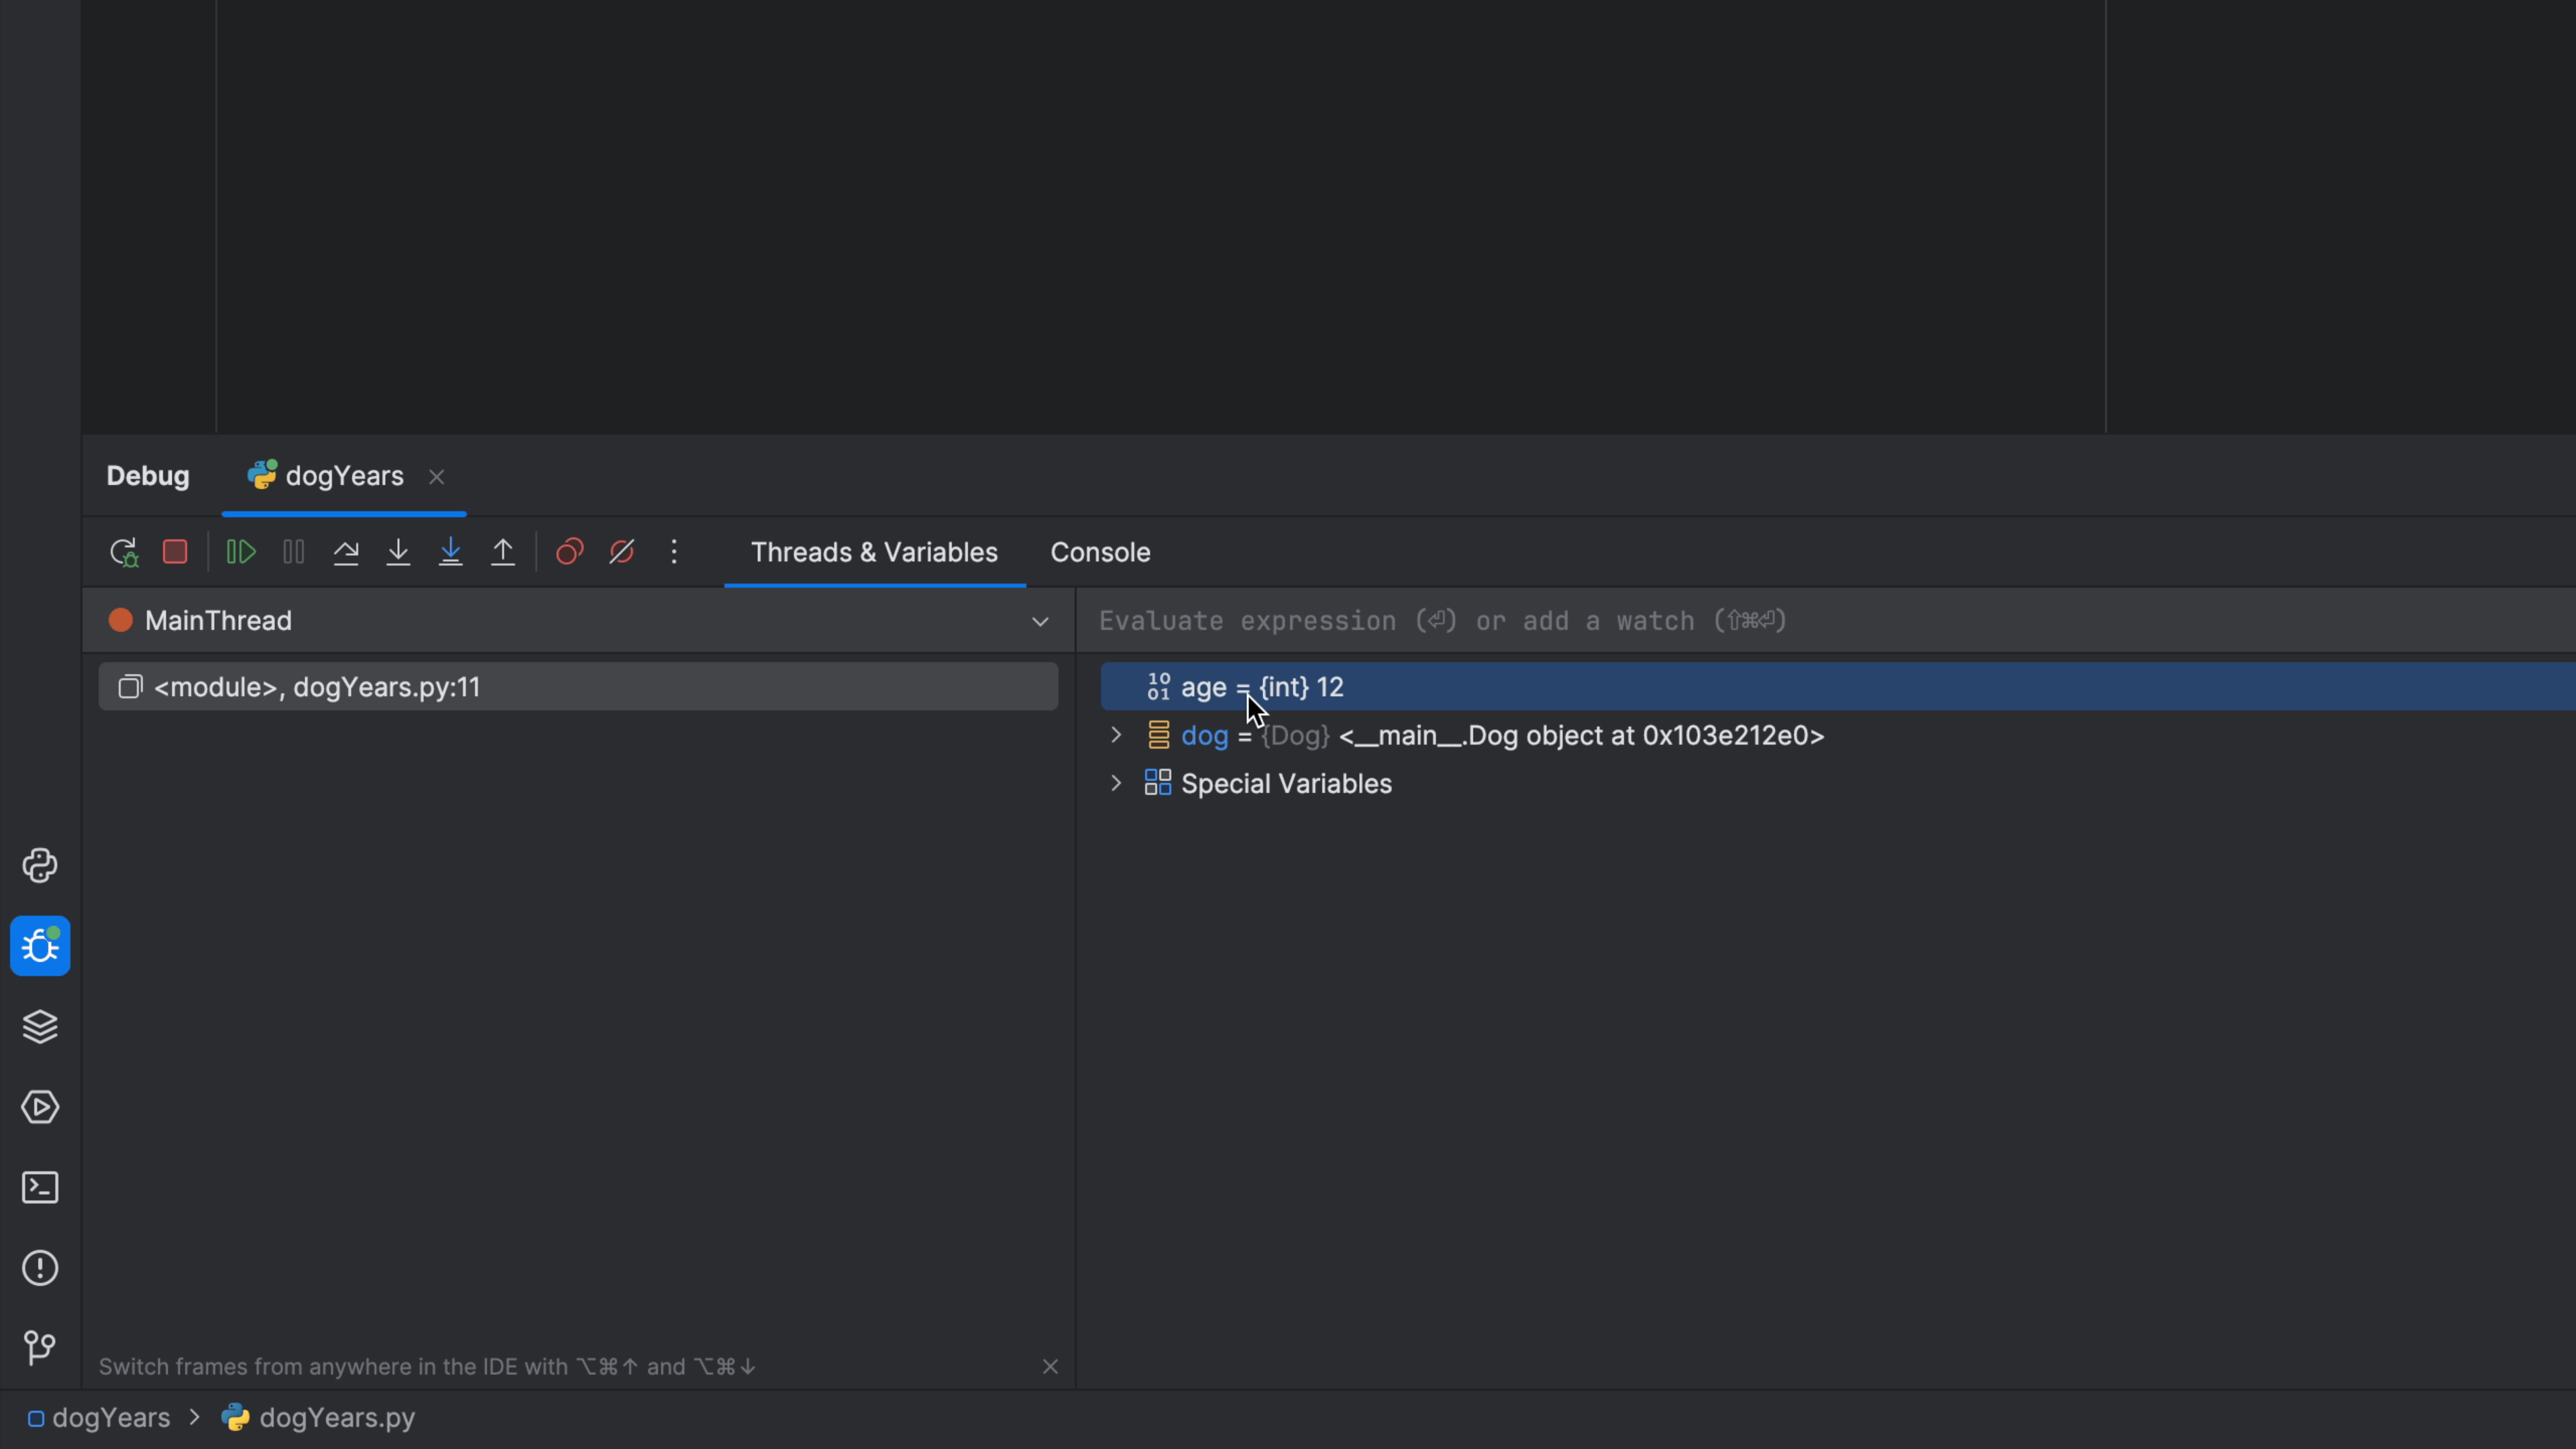
Evaluate Expression During Debugging
Select your code and execute it, in the right context.
Debugging means poking around, usually at a point in the execution. You set a breakpoint, fire up the debugger, and start pokin'.
Sometimes "poking" means "typing in expressions and seeing the result values." This is where Evaluate Expression helps. It is a popup window where you can type in values and see the results, in the scope of the stopped line: all the values in that block, passed in, etc.
There are several ways to get to the popup:
-
Click the debug toolbar button to launch it
-
Invoke the Evaluate Expression action ⌥⌘F8 (macOS) / Ctrl+Alt+F8 (Windows/Linux).
-
Right-click in the editor and choose Evalute Expression
Note that, if you have a selection in the editor, that selection is filled into the Evaluate Expression input box. This is a very handy way to stop on a line, then execute part of that line, without retyping or even cut-and-paste. This also means Evaluate Expression can be driven with the keyboard instead of the mouse.
As you are typing in the Evaluate Expression input box, autocomplete and other features are available. Also, previous expressions you've typed are available as autocomplete and in the dropdown.
If you type something in that causes a new variable to be defined in that scope, or changes an existing variable, the Variables pane will reflect it. Meaning, you are indeed changing the scope.
One last point: if you move around in the stack frames (left panel), Evaluate Expression will be driven by different scope. Thus if you want to "poke around" inside some code that called the line at the breakpoint, it's easy.
Split Screen Without Tabs
Get your code and tests side-by-side without resorting to tabs.
As discussed previously, disabling tabs and focusing on the keyboard helps productivity. But without tabs, how can I see two files at once? For example, the code I'm testing and the tests I'm writing?
You can still split screens without tabs. Simply use the Split Vertically action (no default keybinding so use Find Action) and you'll get two frames. Then open your to-be-tested code on the left and test code on the right.
By default, PyCharm visual test runner tool window is at the bottom. This gives a familiar "TDD" (test-driven development) visual orientation: left for code, right for test, bottom for results. (Although on wide monitors, docking the test tool window on the right might make more sense.)
How to move between the left and right "Split Vertically" frames? The Go To Next Splitter action ⌃⌥⇥ (macOS) / Alt+Tab (Windows/Linux) is a convenient keybinding. Since these are the two files you are switching between editing, our old friend the Recent Files action ⌘E (macOS) / Ctrl+E (Windows/Linux) is a nice, already-memorized key sequence.
Run Single Test
Speed up testing by focusing on one test.
You're doing test-driven development (TDD) and you're in "the flow". Everything is clicking. Perhaps you want to focus on just one test:
-
Your tests take a while to run, and you don't want the slowdown of running them all
-
Some of your other tests are broken, or your current code breaks them
PyCharm makes it easy to select just one test to run. In fact, there are several ways to do it:
-
With the cursor anywhere in the test you want to focus on, right-click and choose to run that in the test runner
-
Right-click on the test in the test tool listing and choose to run it
The definition of "one test" is also flexible: one test function/method, an entire test class, an entire test file, or a directory. All can be right-clicked to focus on those tests.
What happens when you run one test? PyCharm creates a temporary run configuration, focused on just that test. This run configuration is based off the template run configurations, so if you want to put an environment variable on all your pytest single-tests configs, edit the pytest run configuration template.
Auto-Run Tests
Get into testing mode by telling PyCharm to automatically re-run tests as you type.
TDD, or test-driven development, means "always be testing." In fact, the best way to do this is to put your tests on autopilot.
Some test frameworks have a mode to "watch" your tests and code, detect changes, and re-run tests. But PyCharm makes this even easier, with a button and action.
Simply click the Toggle auto-run in the test tool window, then run your tests once. From that point, any time "things change", PyCharm will re-run whatever tests are currently in that test tool window tab.
It's a very convenient workflow. In fact, since the IDE automatically saves files, you don't even have to perform a save to trigger your test re-runs.
Sometimes you find yourself racing against the IDE: "Keep typing fast before the IDE re-runs the tests!" The test tool window has options where you can adjust the delay, which defaults to 2 seconds. If your tests run fast and you want more immediate feedback, decrease the delay.
This auto-run tests feature combines nicely with other "visual testing" features to help you focus and work productively. Run just one test, or just one file of tests, and turn on the auto-run. Hide passing tests or re-run failing tests, etc.
One last point: this button toggle affects the current test tool window tab only. You might have pinned a run configuration tool window to be "sticky". When you run some other subset of tests, you'll get a tab, but the first is still there and still in auto-run. If tests fail, you will get a notification.
Interested in pytest Development?
 Python developers love pytest and we think you will too. Check it out!
Spot Coverage Gaps Using the Gutter
Let the IDE help you spot coverage gaps in your testing.
Note: Code coverage is available for PyCharm with Pro subscription.
Writing tests for your code is good, but how do you know when you've done enough testing? "Code coverage", via the coverage package, combines your tests and the execution of your code to see and report what spots get hit.
PyCharm makes this easy to set up. You just run the Run with Coverage action, for example by clicking the button in the toolbar, and PyCharm runs your tests
with the bundled coverage.py (or you can use a coverage that is installed in your project interpreter.)
Once coverage runs, you'll get a tool window showing a filesystem-like view of your project with statistics at each level.
But better yet, and the subject of this tip, your editor's gutter will be color-coded with coverage information: green for covered and red for not covered. If you checked the preference for "branch coverage", the gutter decorations will include branches in your code.
Those gutter decorations are not just visual: click a line in the gutter to get a popup with some statistics.
Use Local History to Avoid Disaster
Use the IDE's built-in history facility to recover local changes when you haven't committed to VCS.
You’re in your repo. You add a file. Later, you make some edits, but then -- you change your mind. You want to revert but you never committed.
Use the IDE’s local history on a file… when you aren’t under version control, or you’re in between commits. Browse each IDE change, see diffs, recover from mistakes.
Delete a file by accident? Go to the folder’s local history, and recover that too!
The Problem
This is the "Oh my goodness you saved my sanity" tip.
Sometimes you are in a project that isn't yet under version control. Or, you've done a lot of work since your last commit. For example, a file is under version control, but you've been very busy.
You pause for a bit, have some inspiration, and hack away. You delete a paragraph, then ultimately finish the text. But now you want that paragraph back! Git can’t help, because you didn't commit before hacking away.
You could try “Undo-Undo-Undo-Copy-Redo-Redo-Paste.” But that’s barbaric. There has to be a better way.
The Solution
This is going be one of those things that people love about our IDEs.
Local History to the rescue. Our IDEs have a built-in facility that tracks revisions for all IDE-initiated changes -- whether you are using a VCS or not.
Right-click on a file and choose “Local History” then “Show History”. On the left, you get a list of changes detected by the IDE. When you select one, you get a diff – comparing to the current file contents – on the right.
As you go through the changes, you see each diff. Like our normal diff viewer, you can apply changes to recover portions.
Perhaps you want the entirety of the file at that point in the history. Right-click on that revision and choose revert.
If a certain revision is known to be in a certain state, right-click and apply a friendly label.
That covers changes to a file. But what if you deleted the file, and it wasn't under VCS? Go to that file’s folder and choose Local History. The deletion event is there, and you can restore the file.
As a wrapup, let’s see the same sequence -- without the mouse! First, invoke Search Everywhere and search for the Show Local History action.
In the Local History window, tab into the Old Changes panel. Cursor down to the edit. Tab to go into the changes.
Clone from GitHub
Create a project in your JetBrains IDE by cloning it from GitHub
The Problem
You want to work on a project that's hosted in GitHub, but how do you get it from there on to your machine?
The Solution
The first step is to get the link from GitHub. Navigate to https://github.com/ and navigate to the project that you want to use to create your project locally. You normally want to clone the main branch which will be selected by default. Click the green Code button and leave it on the default of Local. Click the icon to the right of the HTTPS link to copy the link to your clipboard:

Now you have three choices for pasting it into your IDE.
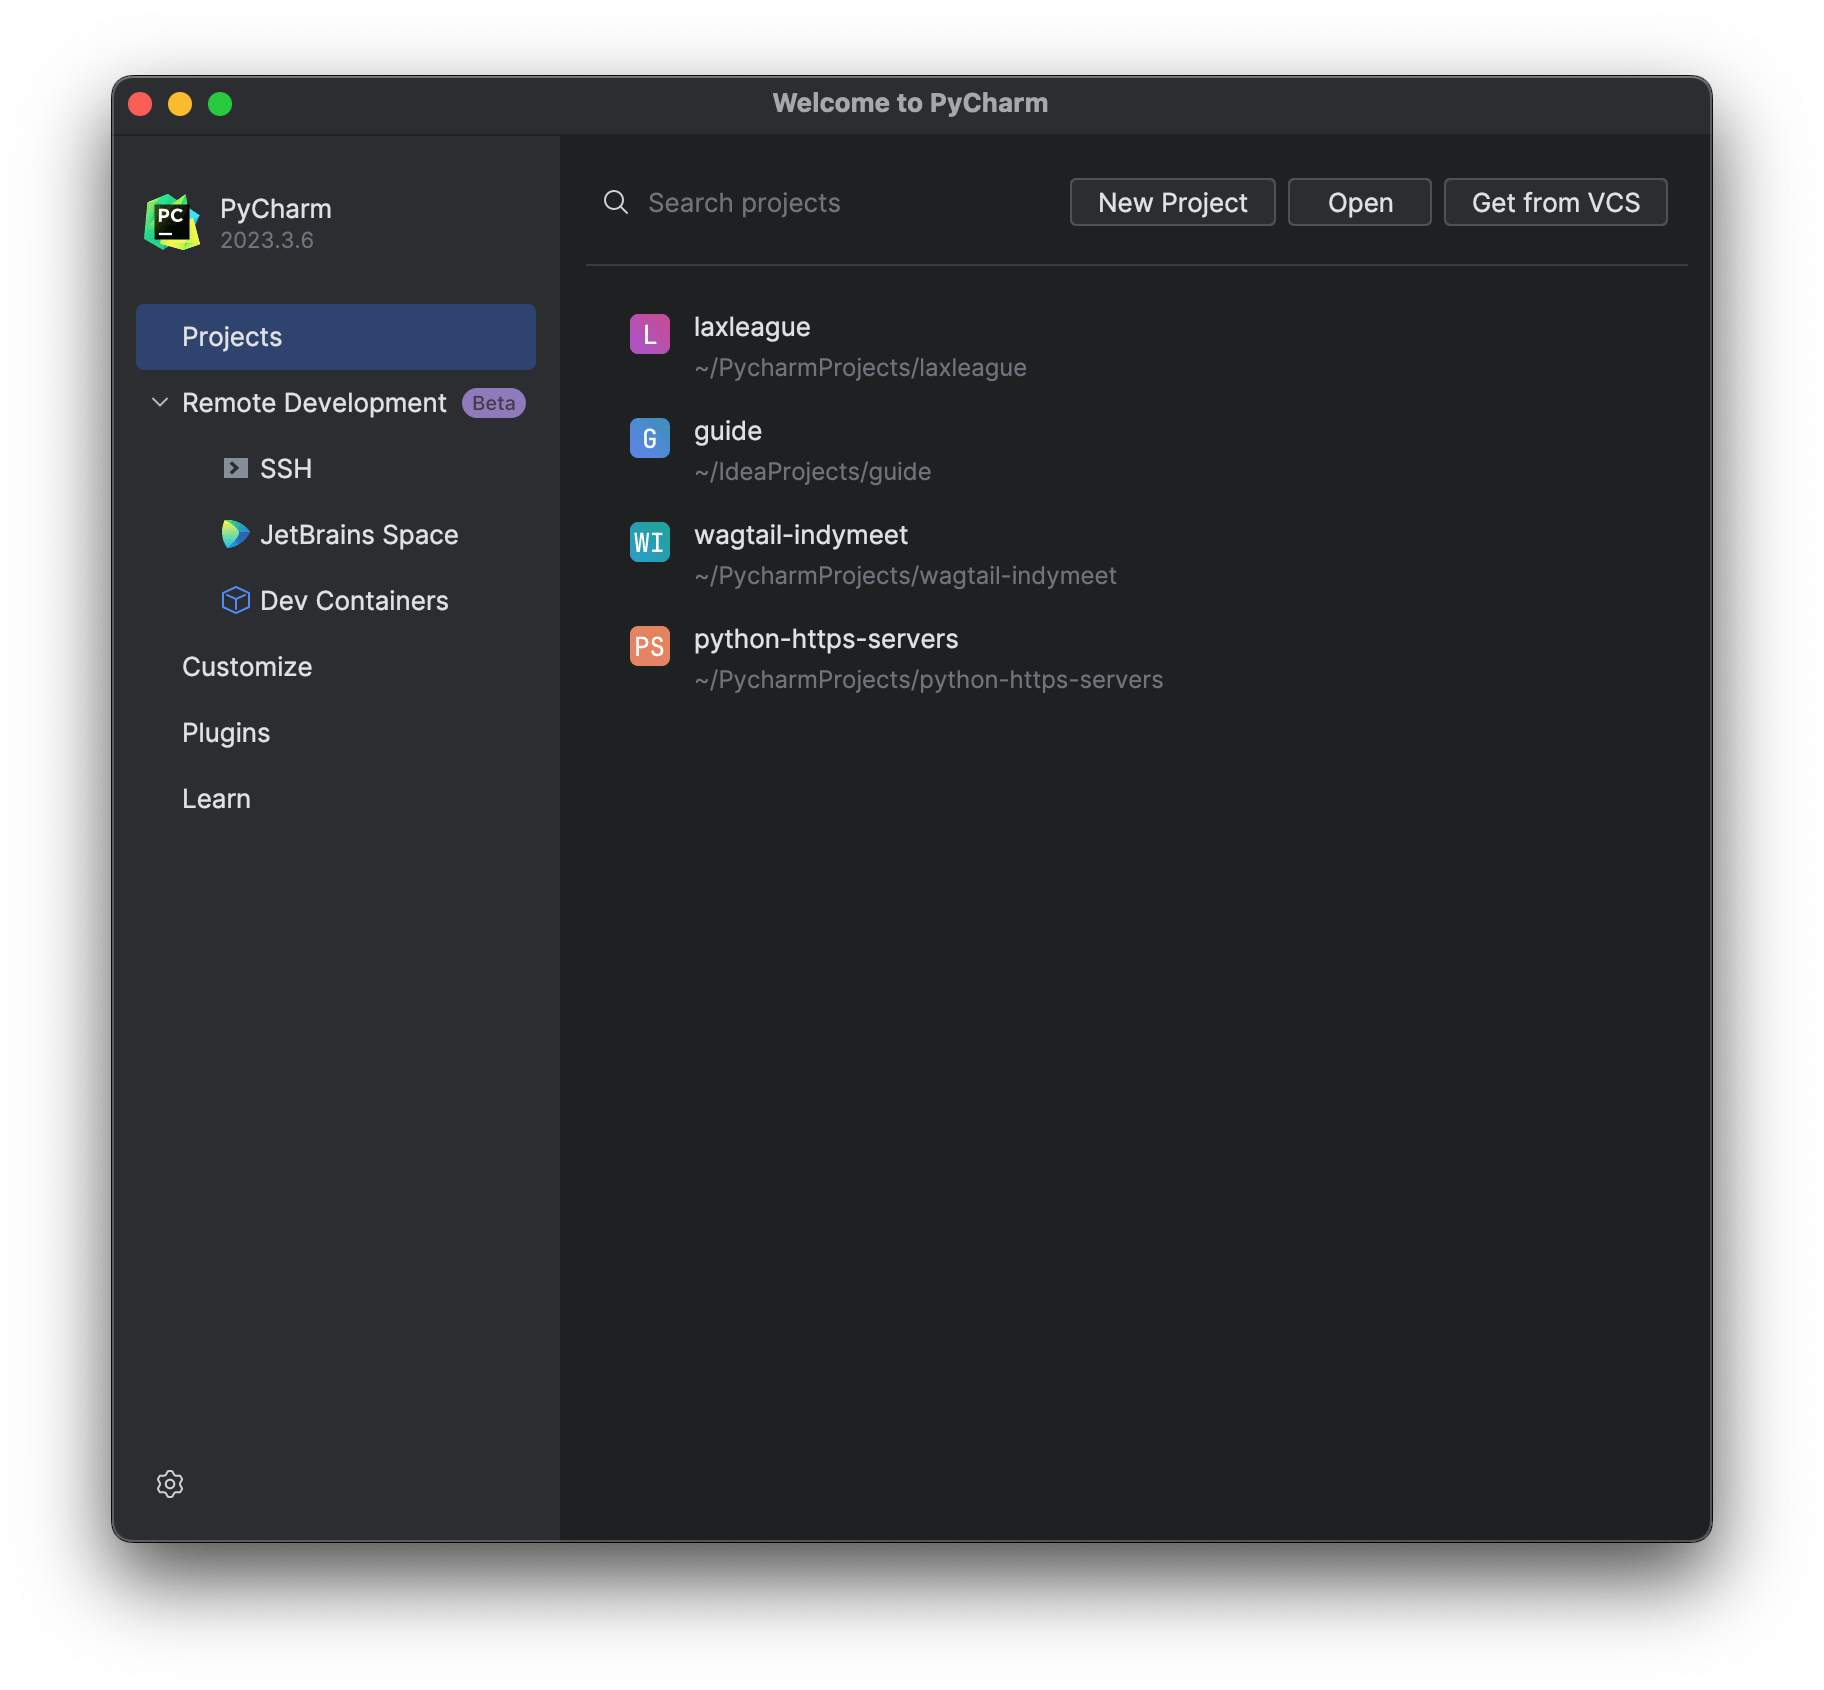
- If this is your first time opening your JetBrains IDE, you'll see this welcome screen. The Get from VCS option is the button on the right:
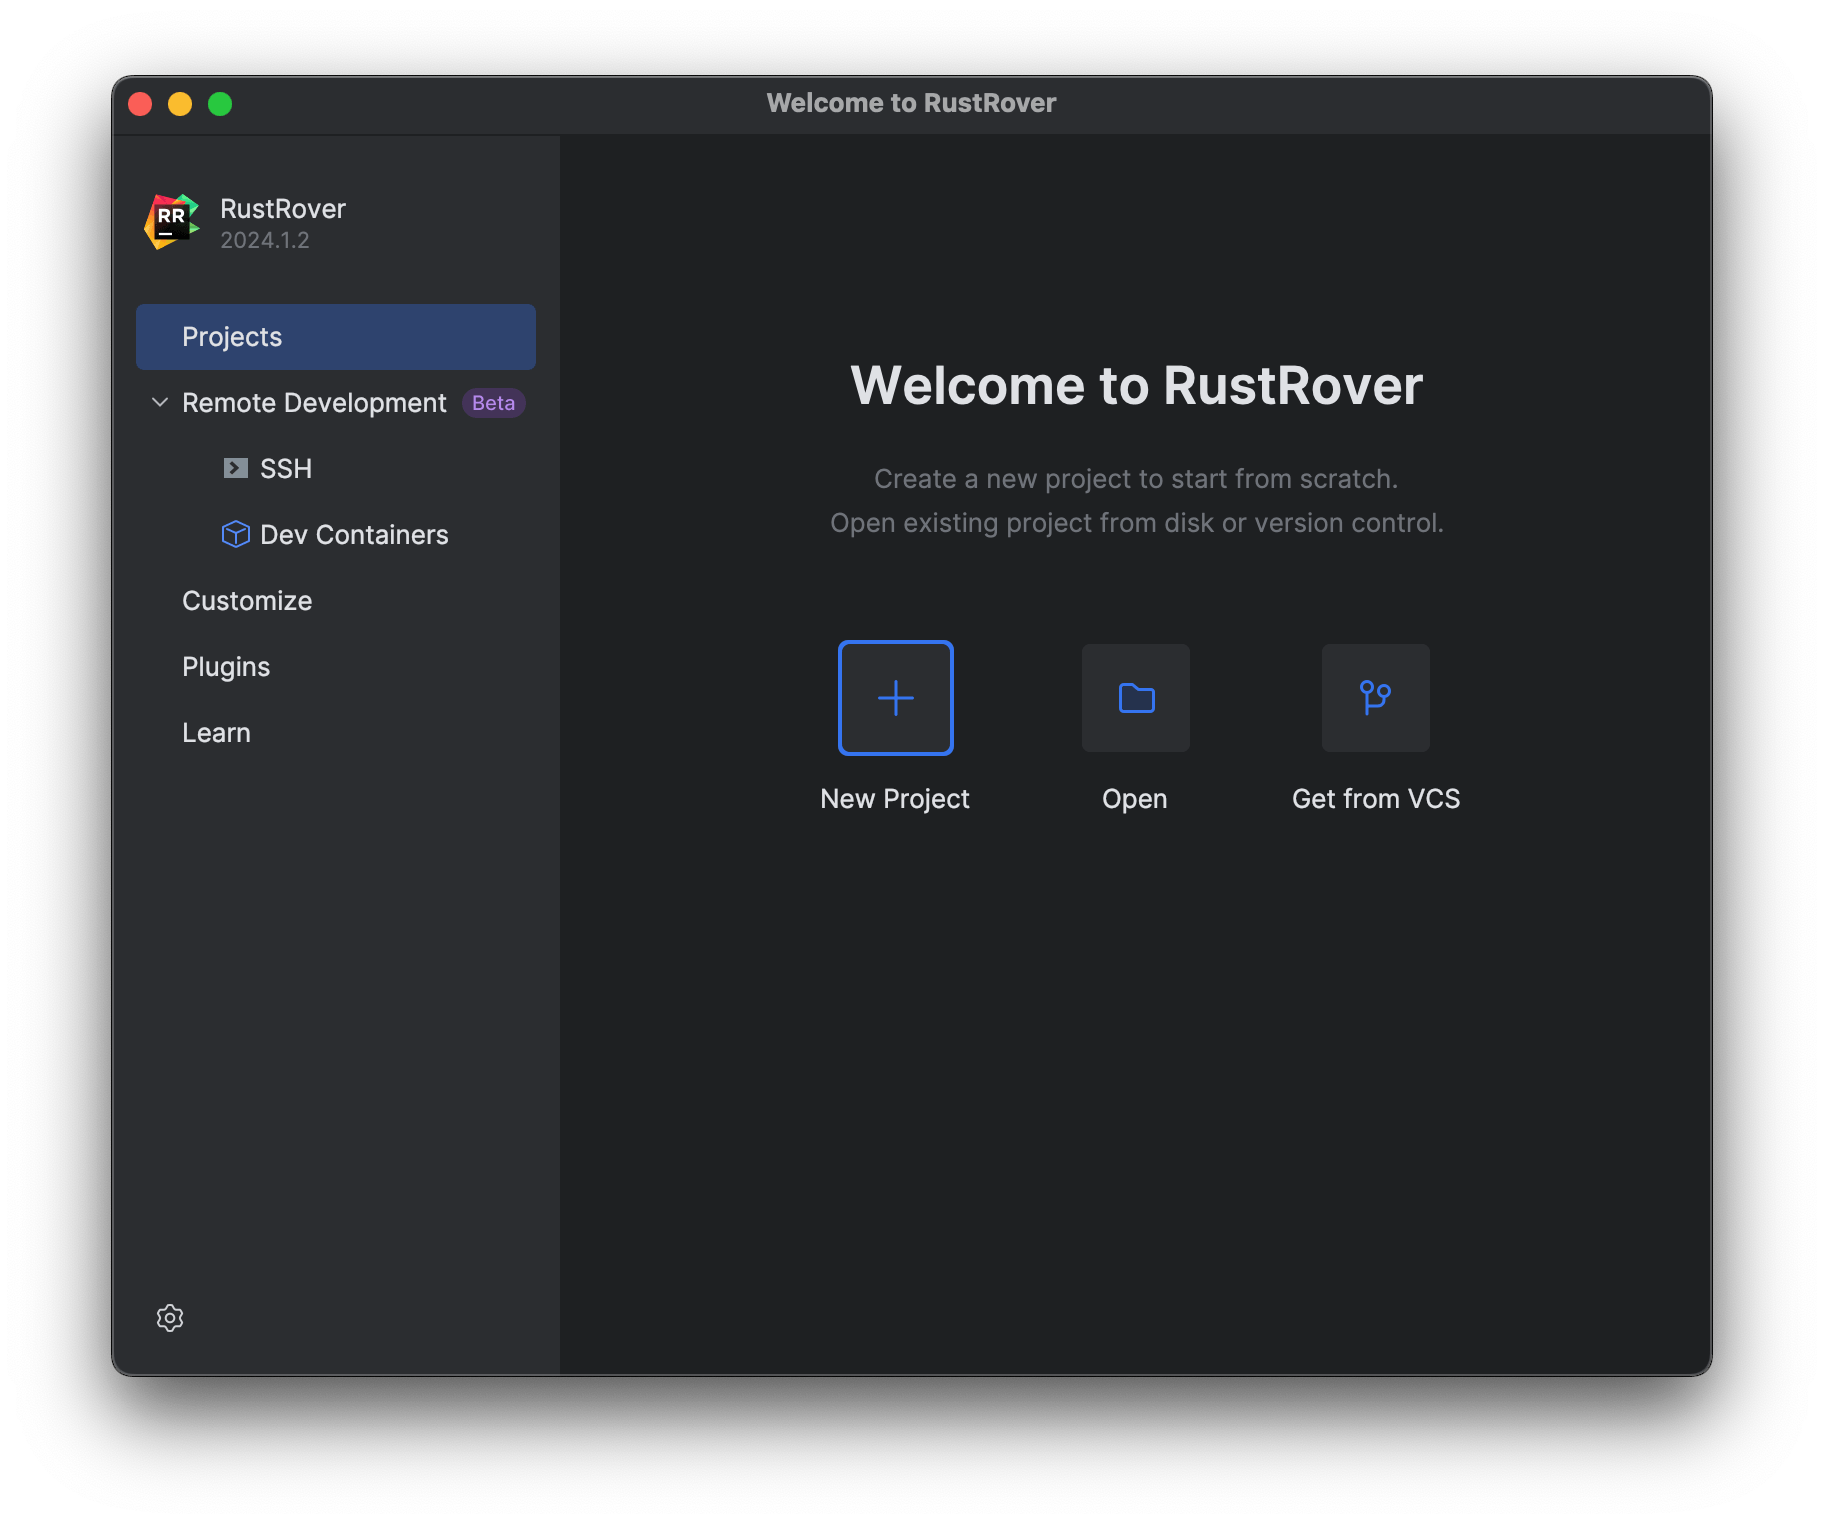
- If you have already opened some projects, perhaps locally, you'll see this screen instead. The Get from VCS option is a button on the top right.
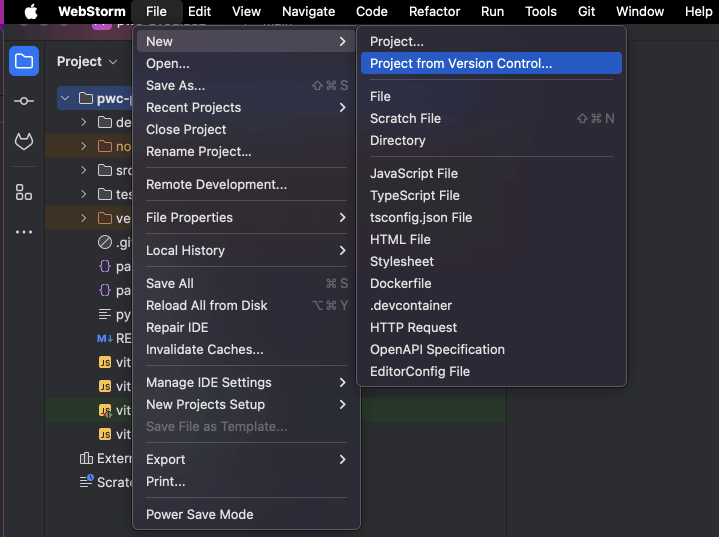
- Alternatively, if you are already in a project, you can access the Project from Version Control option either from the File menu or from the File > New menu depending on the IDE.
Paste the link that you copied from GitHub into the dialog box that opens when you choose one of these options:
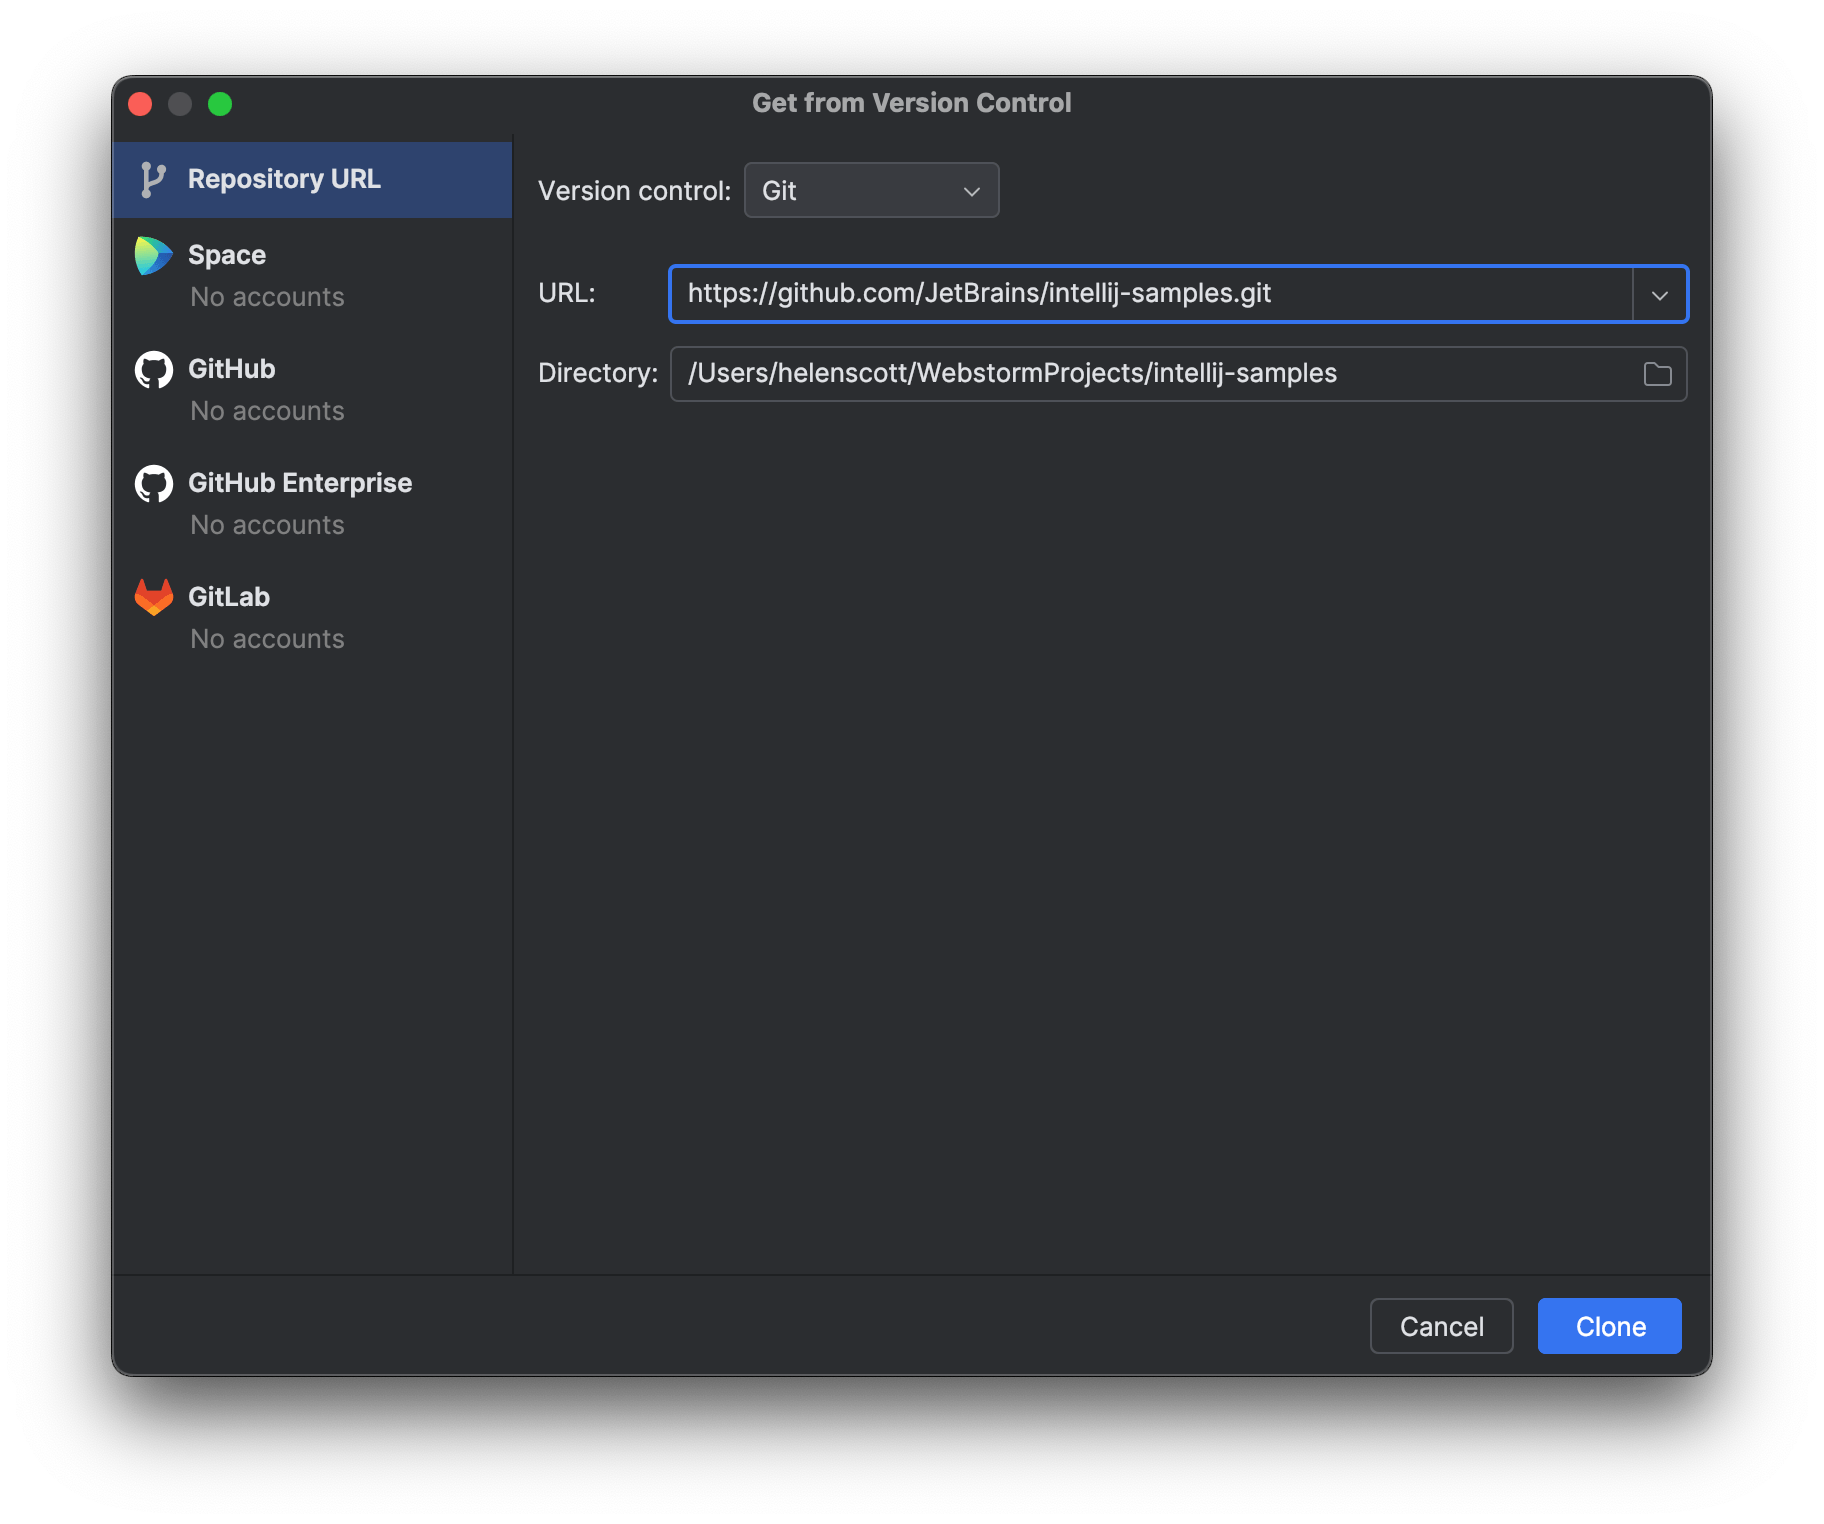
And then click Clone. The clone action copies the entire repository to your local machine including all the files, branches and commits.
And that's it, you can now work on the project locally, perhaps your first step is to make a branch!
Put New Project Under Version Control
The fastest way to register a new project directory under local version control.
You have a new project, or opened a project not under version control. First thing is to fix that by making a local repository.
You can use your mouse to go to the VCS | Enable Version Control Integration menu item. But you can also do this from the keyboard, to get to the same dialog, without leaving the keyboard.
Use Find Action ⌘⇧A (macOS) / Ctrl+Shift+A (Windows/Linux) and speed search for en ve co (meaning, Enable Version Control). It should be the first matching item. Press ⏎ (macOS) / Enter (Windows/Linux) to invoke it.
The dialog that pops up wants a selection of which VCS system to use. If it is Git, type g and the dropdown will select Git. Select OK to perform the operation.
This action adds a VCS root in your Settings/Preferences | Version Control preference. Later, when you want a remote, you can use, for example, Share Project on GitHub.
Edit Commit Message
Edit the wording in your last commit message, after you committed.
That last commit message…(sigh)...had a typo. You haven’t pushed yet. Just right-click on the commit, choose “Edit Commit Message”, and fix the mistake.
Now your commit history…passes the spell-checker.
The Problem
This is my development life. I finally wrap up a big pile of work, go to do a commit. And, in the rush of victory, make a spelling error, which I spot just as I finish clicking “Commit”. Alas, it’s there, in the history.
We haven’t pushed. So there’s hope.
The Solution
Of course, the best solution is to fix the problem before committing. Our IDEs have a plugin called Grazie which does...let’s just call it “super cool spelling and grammar checking.” It probably warned you about the typo.
It will probably even fix the typo for you.
Back to our messed-up commit message. We could of course, go to the Terminal and type some arcane commit message. And of course, hope we don’t corrupt our repo. This has some downsides: go to the command-line, type something a little obscure, possibly get something wrong, and get no help from the spell checker.
Fortunately, this is the kind of thing our IDEs are great at. Right-click on the commit, and you’ll get a list of actions to take on that commit.
There are LOTS of things we can do to help, as this list shows.
Beside Edit Commit Message, you can see F2 (macOS) / F2 (Windows/Linux).
This shows we could have skipped the context menu by selecting the commit and pressing F2 (macOS) / F2 (Windows/Linux).
We’ll select that option and be prompted with a dialog to edit the commit. The existing commit message is there. We can see, there’s a warning about the typo. We can hover the mouse for more detail. This is the Grazie plugin helping us again.
We can type to fix it, or use ⌥⇧⏎ (macOS) / Shift+Alt+Enter (Windows/Linux) to get a correction.
Once fixed, click Ok to finish the operation. You now see the commit history with the fixed commit message.
One point in closing...we mentioned that you should only use this option if you haven’t pushed. If you go back to older commits and right-click, you’ll see some options are grayed out.
Undo your Last Commit
Undo your last Git commit
First go to the Git tool window and make sure you’re on the log tab.
It shows the list of commits on the current branch. The most recent one is at the top.
Right-click that commit and in the pop-up window, choose Undo Commit.
That commit has some changes. Let’s keep them in the default changelist. Now the commit tool window says I have changes.
And now that commit…never happened. Let’s look a little deeper.
The Problem
You are editing, say a Markdown file. Let’s leave the Commit tool window and Git tool window open, to see the updates as we go.
You change the title, and make a commit. And for the thousandth consecutive time, you spot a typo, just as the onkeyup event fires when clicking commit. Alas, the commit tool window shows that there are no changes. And, in your Git log, there it is, the mistaken commit.
That means it’s too late, right! Nope, if you haven’t pushed to a “protected” branch, you can clean things up locally. And the IDE puts a convenient UI atop the underlying Git command.
The Solution
In the Git tool window, find the most recent commit. It’s the one at the top. When we select it, we get more detail about the commit. We can double-click the file to see a diff of the change.
When you right-click on a commit, you get some actions you can take on it. Some might be grayed-out. For example, if we right-click on an older, pushed commit, we’ll see “Undo Commit” is grayed-out.
Back to the first commit. Right-click on it, and select “Undo Commit”.
Now, the commit had some changes in them, and these changes need to go somewhere.
The IDE’s changelists provide such a place.
We’ll stick with the Default Changelist.
This results in our Commit tool window showing the changes when we click ok.
A look in the Git log also shows a change.
That commit is…gone! We’re back to where we were before the commit.
What would this have been like from the command line? Let’s take a look at the Git tool’s Console tab, to see behind the scenes. There it is, the command that we would have had to type, from the command line.
Want to learn more about Git?
 Learn how to edit a commit message - it's not too late!
Only Commit Some Changes
Select specific files or regions within files during the commit process for a lower level of commit granularity.
You’ve done a lot of work, but not all the changes should go in one commit. Let’s use partial commit.
In the commit window, look at your changes. Skip the first file by clicking the checkbox. In the second file, open the diff and deselect some of its changes.
Now when you commit -- just those parts are included. The unselected parts remain as changes.
The Problem
You sit down to do some work. It’s going well. You’re in the zone. You have an idea for some other work, something for next week. Exciting stuff, you can’t help yourself. You write it down.
You get a phone call: you forgot a change in something that you did last week. Need to make a small fix.
Back to what you were doing at first. You wrap it up.
Time to ship it, with a good commit message. But there are actually 3 units of work slotted for this commit.
Today’s work, next week’s work, and last week’s work.
Each should get separate commits. Of course, you could just do a single commit, with a commit message for each unit. Fast for you, for now. But not fast for others, trying to decipher the commit history later.
You could roll back the second two changes, then manually re-apply them. But that’s -- how shall we say -- inefficient. You could use the under-appreciated changelist (or stash) facilities.
Maybe there’s a quick and easy solution.
The Solution
What’s a partial commit? Here’s a website that explains it.
That paragraph describes exactly what we want to do. The how? Maybe a little cumbersome. Fortunately our IDEs have been putting a pretty face on this operation for a while.
Let’s return to the commit tool window and walk through committing just the work we want. First, leaving out an entire file. Just click the checkbox on any files.
Sometimes you have a big directory hierarchy of files that might have been copied in. Leaving them out is easy. Just deselect the parent.You could even go in and re-select just a couple.
Next, leaving out part of a file. Bring up the diff tool. Find the change you want to omit and click the checkbox.
If you change your mind, re-select it. This is just like the normal diff tool. You could scroll through changes in a file, between files, use the keyboard-only -- all those productivity tips apply.
When you finish, you’ll see the checkbox has a “dash”. That means it is between “checked” and “unchecked”. Think of it as “some.” You do your commit as normal. It leaves the unselected changes out of the commit, meaning they are still there.
You could continue your process to select the changes for next week’s commit, with a good commit message. Then, the changes for last week’s commit, again with a good commit message. There, you’ve processed all the changes and your commit history is easy to digest later.
Want to see what happened behind the scenes? The Git tool’s Log tab shows the commands issued. This is what you would have had to type.
Run npm Scripts from package.json
Browse your package.json scripts and run in a dedicated tool window.
Modern web development means Node.js tools which mean a package.json file. This file sometimes has helper scripts under the scripts key. Running these perform various project operations such as build.
PyCharm with Pro subscription makes it easy to browse and run these. There are several different paths to opening the npm tool window:
-
Right-click on
package.jsonand choose Show npm scripts -
Click the
npmtool window on left -
Invoke Recent Files with ⌘E (macOS) / Ctrl+E (Windows/Linux) and type npm
Note: If you leave the tool window open, resize it to take less vertical space.
Now that you can see the npm scripts, double-click on one to run that npm script in a run window at the bottom. Behind the scenes, this creates a temporary run configuration of type npm.
Sometimes your package.json changes and there's a new/changed/deleted npm script. The npm tool window has a Reload scripts button in its mini-toolbar.
One surprising addition: the names of your npm scripts are available as findable actions. If you have a build script and do Find Action, speed searching for run build will let you immediately invoke it.
Wrap Selection With Tag
Use the keyboard to put a wrapper tag around a selection of code.
You're in an HTML file, working on a nice block of markup, and realize your CSS framework wants a wrapper <div>. Don't they always? What's another <div>, right?
You could use mouse to move to the start, type in <div>, go to the end, type in </div>, and by then you forgot what you were doing.
Instead:
-
Invoke Surround With ⌘⇧A (macOS) / Ctrl+Shift+A (Windows/Linux)
-
Hit T to choose Surround with
in the Live Templates section -
In the prompt, type the name of the tag
If you're a fan of the Emmet system for quickly generating markup, you can also surround with Emmet.
Create SQLite Database Connection
How to drag-and-drop a .sqlite database file onto the Database tool to create a connection.
PyCharm with Pro subscription includes our Database tool, DataGrip, which is wonderful. It gives you a professional-level, visual way to work with SQL development in a project.
The Database tool needs to create database connection for the project, which not only lets you browse tables, edit rows, and perform queries, but it also injects superpowers into your Python code. Strings in Python that look like SQL get autocomplete, not only on SQL, but on the tables and columns in your project. Even refactoring those names.
But creating a database connection means filling in some details. For a SQLite database, it's a lot easier. Just drag and drop your .sqlite db file onto the Database tool window. Note: You might have to download the SQLite drivers.
Once done, your project has a database, you can browse the tables, and use the schema in your Python code's SQL strings.