
Debugging TSX With Chrome
Sometimes you need to debug in the browser. Use the IDE to remote control Chrome during debugging.
As discussed in Debugging During Testing With Node.js, testing and debugging under Node.js is very productive. There are times, though, where you need a browser environment. Fortunately, JetBrains IDEs can remote-control the browser's execution, letting you stay inside the IDE.
Let's see this in a simple case.
We'll set a breakpoint in our label function, and stop there under the debugger, but in this case the Chrome debugger.
JavaScript Debug Run Configuration
First, fire up your npm script for start if it isn't running.
For this we'll need a different kind of run configuration, one tailored for launching the Chrome browser.
It's possible the IDE has already generated a Debug Application run config for you.
If not, add a new run configuration of type JavaScript Debug and supply a Name: such as Debug Application.
As we saw in the first section, the webpack development server runs on port 3000, so provide the run configuration a URL: of http://localhost:3000. Finally, choose Chrome in the Browser: field.
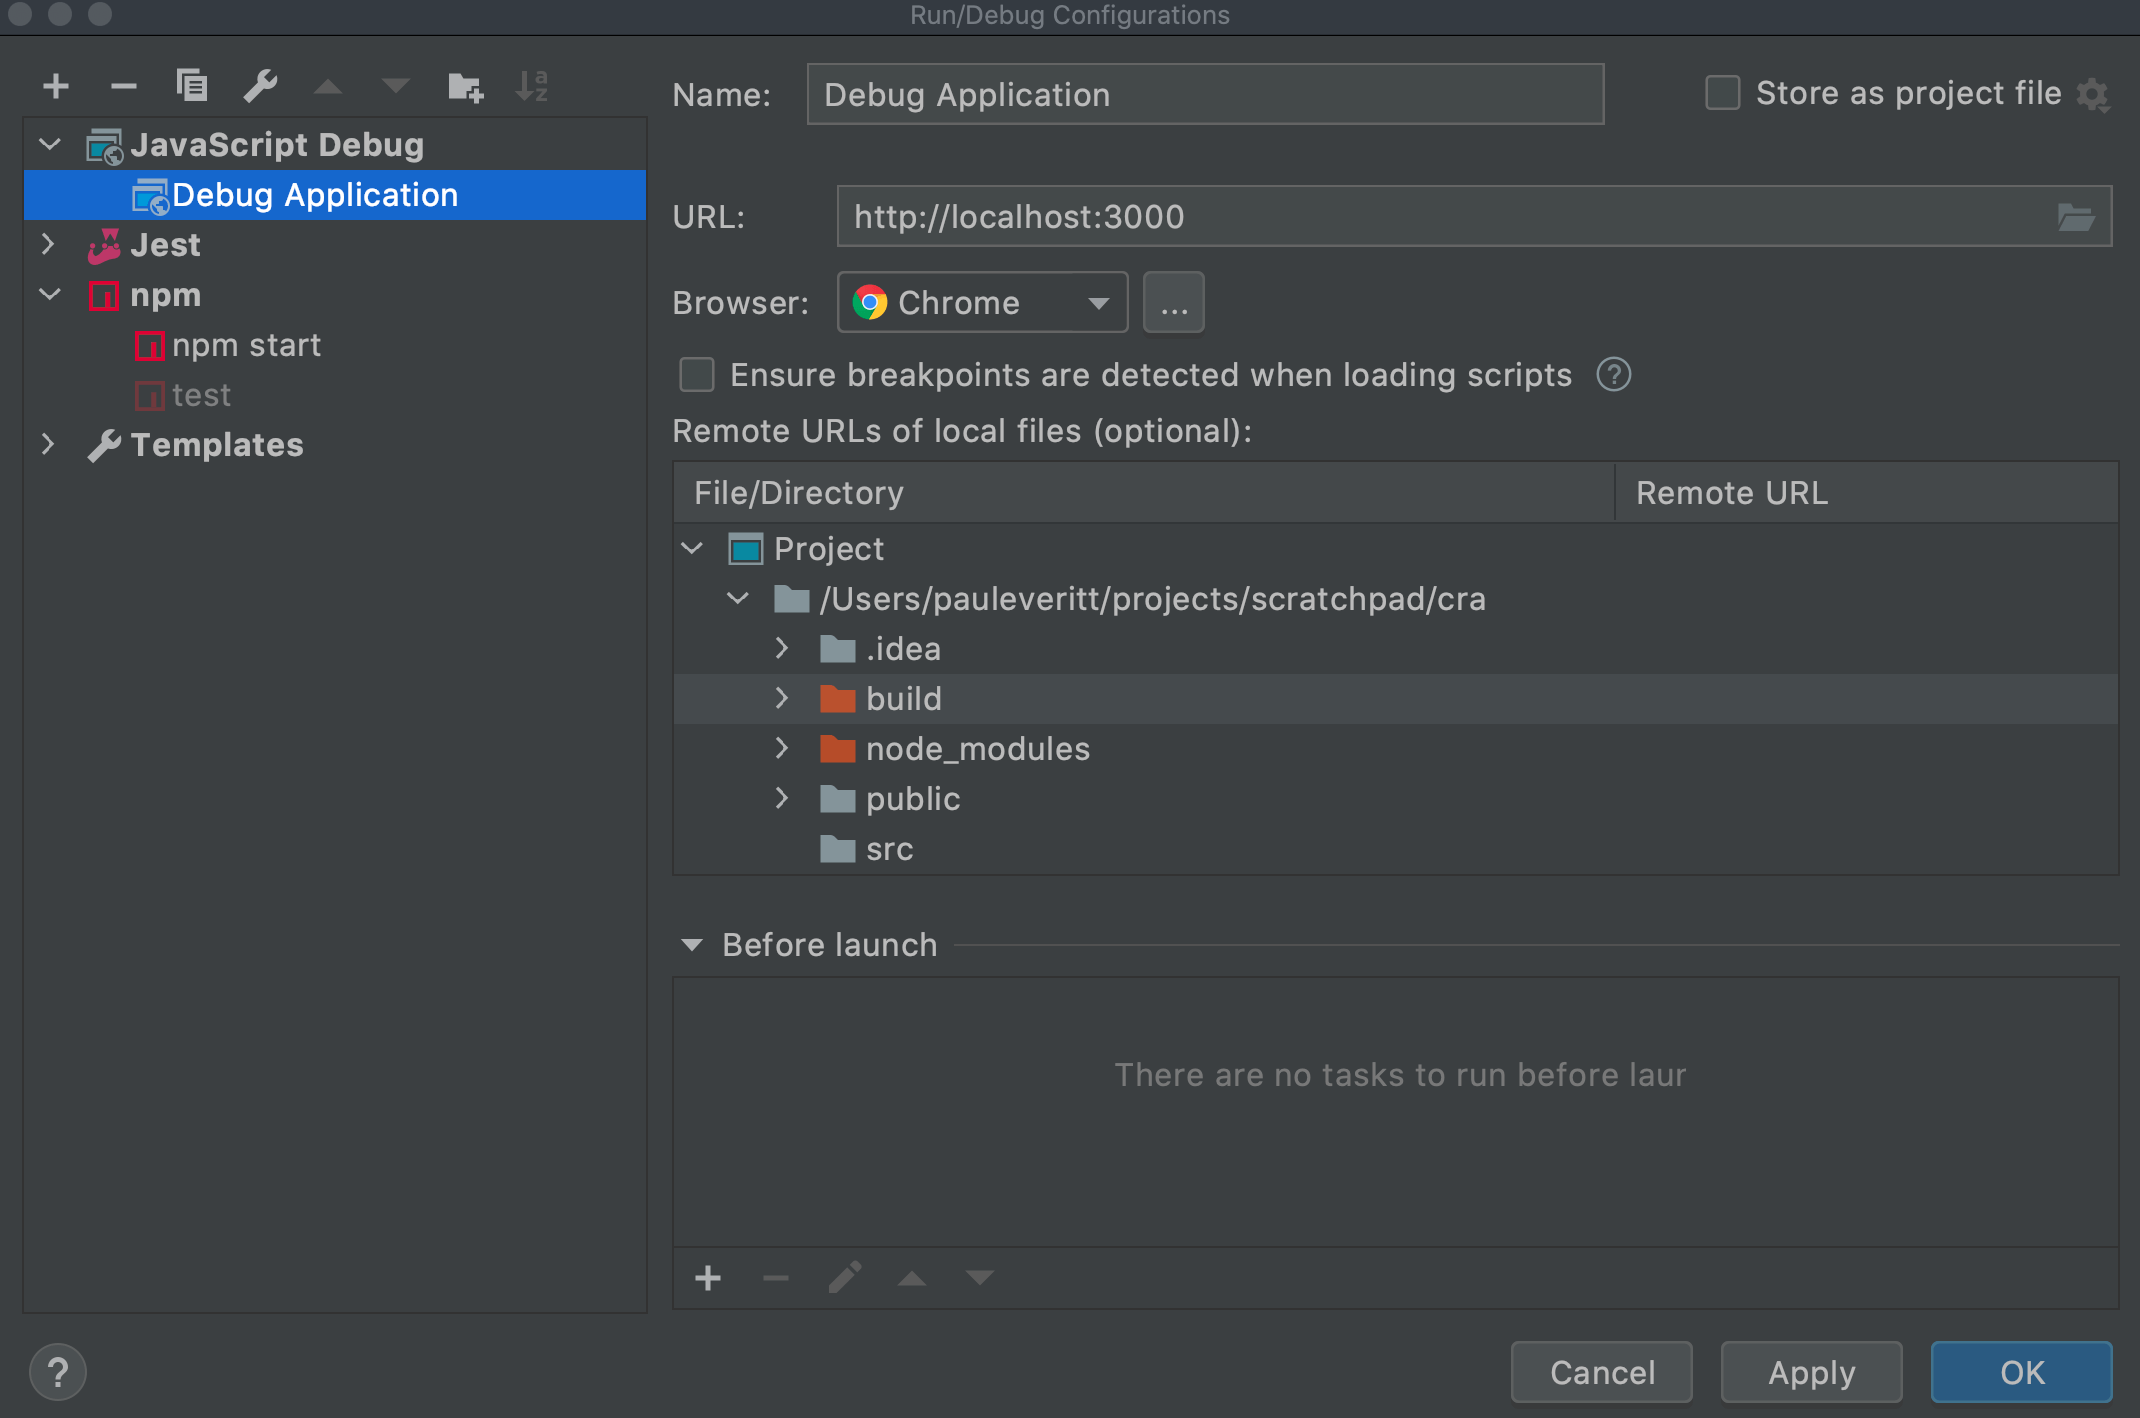
Click Ok to save this new run configuration, then run it by clicking the green play button in the toolbar.
Presuming that your npm start is still running, you should see a browser launched.
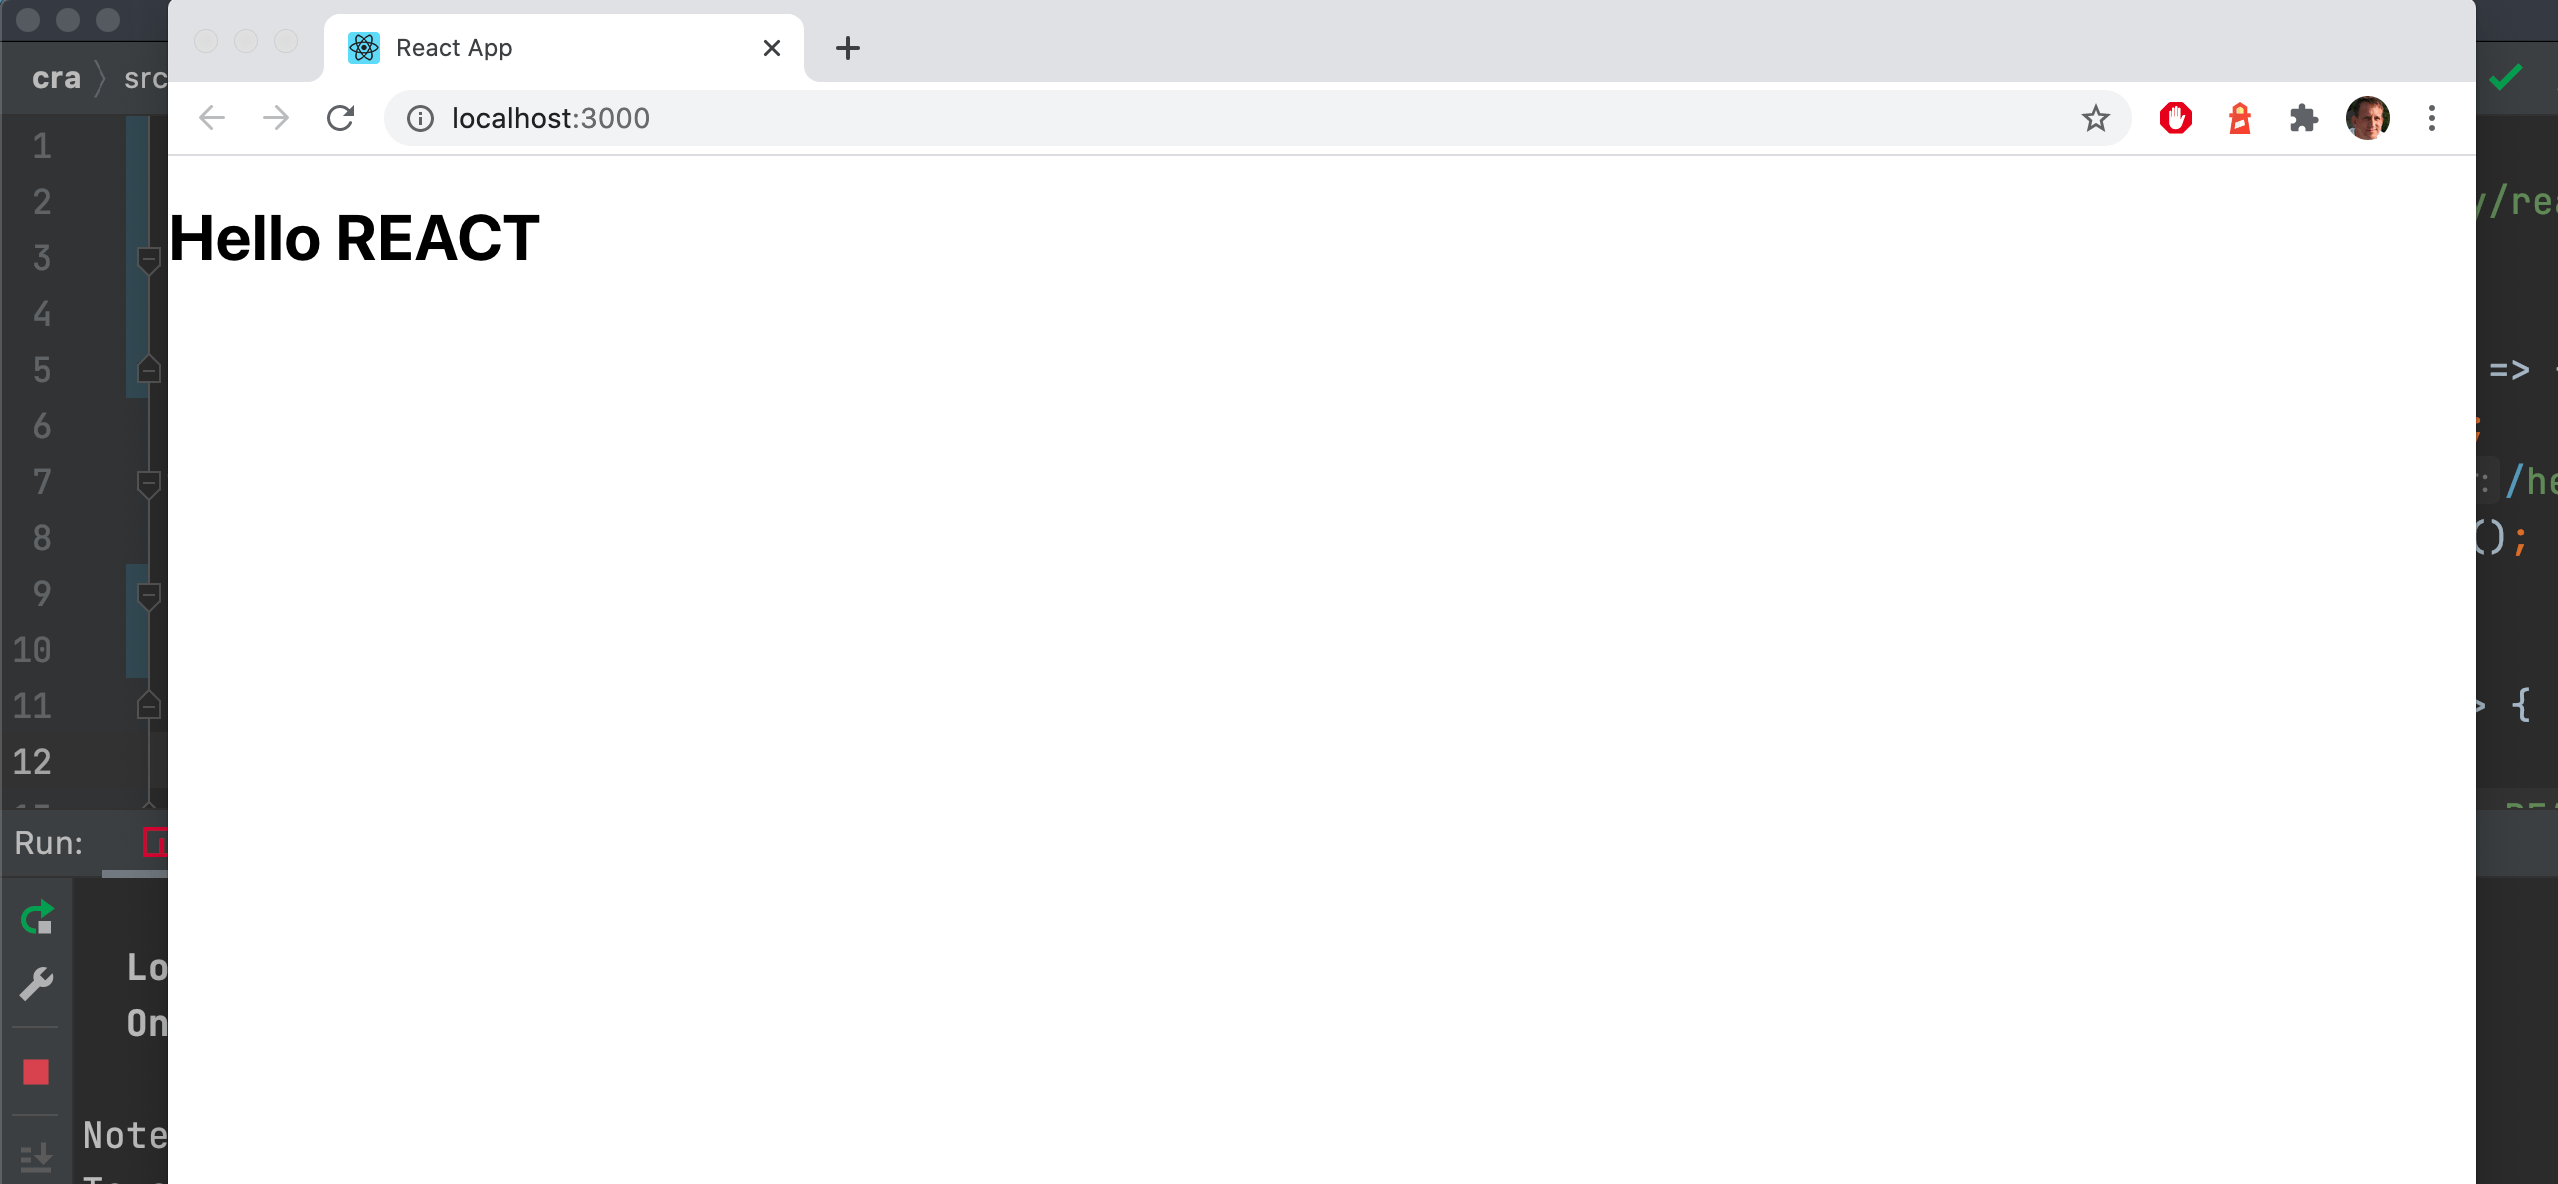
This is an isolated Chrome instance running in a cleared profile, with no history nor cookies. Finish up by closing that new browser window.
Browser Debug
Now it's time to debug in the browser.
Put a breakpoint inside the label function.
Then, re-run the JavaScript Debug configuration you just made, but this time, click the Debug button.
Chrome should pop up. Reload the URL and focus shifts to the IDE, with execution stopped on the line of the breakpoint.
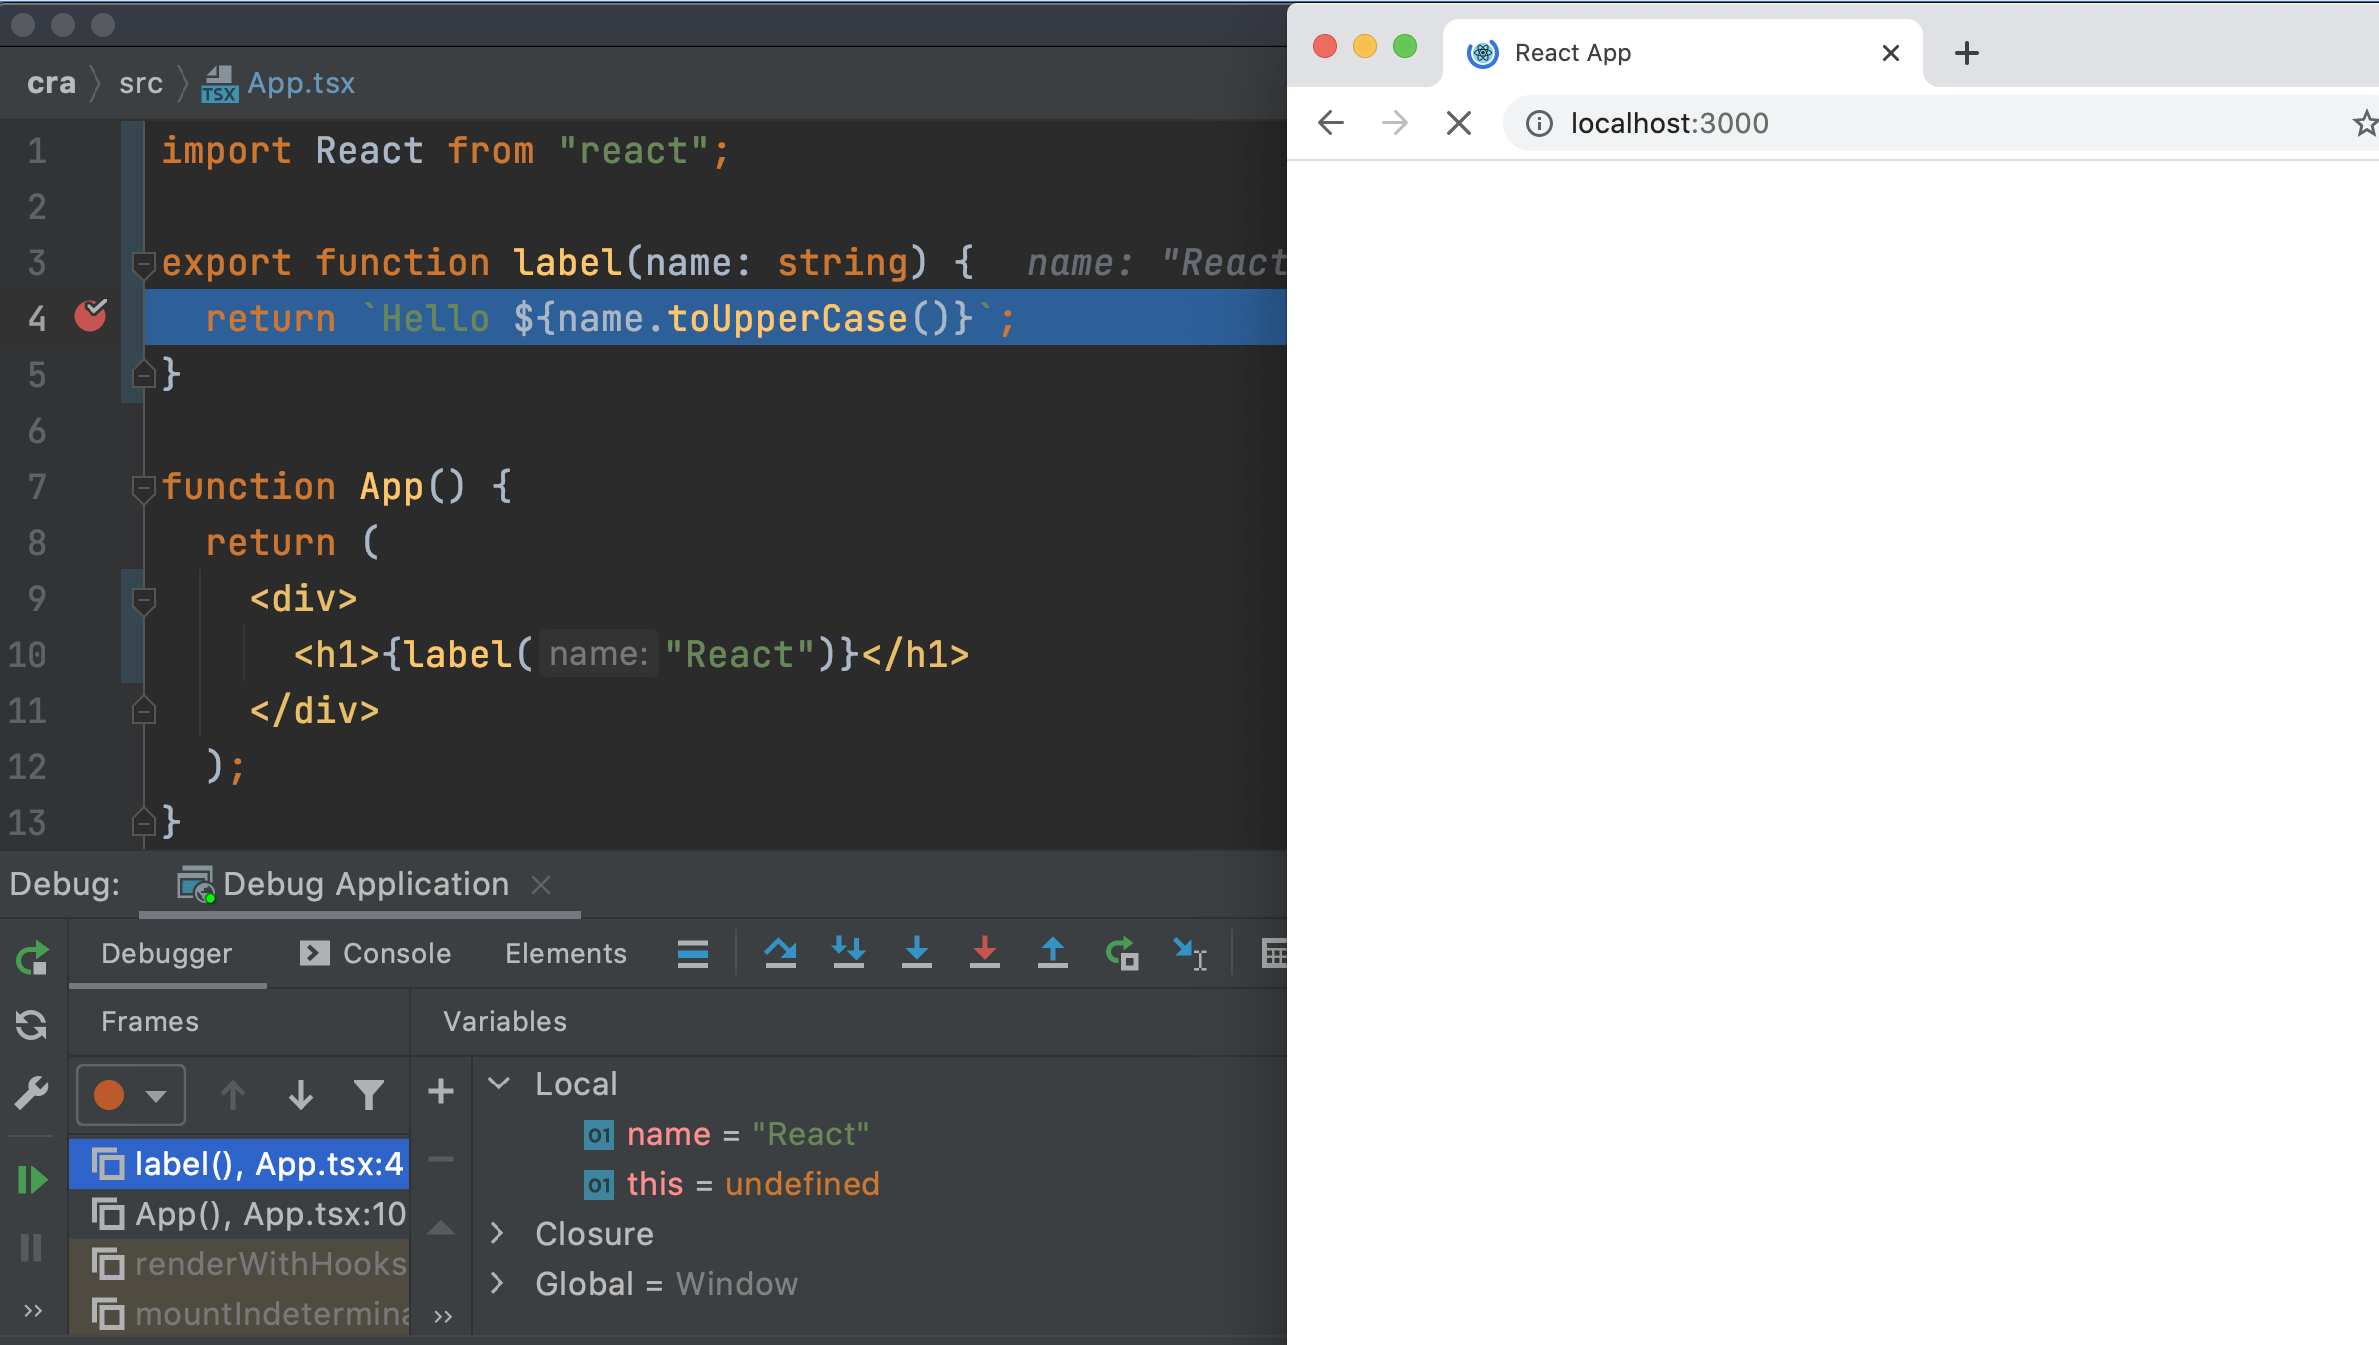
You can do the same debugging tasks as before:
-
Inspect
Variables -
Highlight a snippet and execute it
-
Step through code
In this case, all the execution is happening in the browser's JavaScript engine.
To verify, use Variables to look at the Global | chrome object.
To clean up, click the red button to stop the debugger, close Chrome, and clear the breakpoint.
As a note, none of the files changed in this step.