
Debugging During Testing With Node.js
Use the visual debugger in the IDE for smarter TDD.
In the previous step we used testing as a way to develop our component without switching to a browser.
Sometimes, though, our code has problems that require investigation with a debugger. For React, that usually means a trip to the browser to set a breakpoint and use the Chrome developer tools. Instead, let's show how the IDE's debugger, combined with TDD, can make this investigation far more productive.
Code
The finished code for this tutorial step is in the repository.
Cleanup
As we start, make sure the All Tests run tool window is still running and visible.
You can quit the npm start process and close the window.
Let's start by getting the test code reloaded into our brain by updating the test name to match the changed getByText:
test("renders hello react", () => {
	const { getByText } = render(<App />);
	const linkElement = getByText(/hello react/i);
	expect(linkElement).toBeInTheDocument();
});
Our test re-run, confirming that they still pass.
Hello Parameter
We will use TDD to make our component's greeting a bit more dynamic.
Start in the side-by-side mode described in the previous section, with both App.tsx and App.test.tsx open.
First, add a function in App.tsx, above the App function:
export function label() {
	return "Hello React";
}
Then, in App, change the <h1> to use the output of this function, using autocompletion for the function name:
<h1>{label()}</h1>
We didn't write a test first.
That's sort of ok: we didn't change the rendering itself.
But we also didn't test the label function.
Let's do that now by adding a second test in App.test.tsx:
test("generates a label", () => {
	const result = label();
	expect(result).toEqual("Hello React");
});
In this test we don't need a component with TSX and a fake DOM etc.
It's a plain-old TypeScript function that returns a string.
Nice!
But the test fails: we haven't imported label.
Either do so manually or Alt-Enter on the red squiggly and do the import.
Our second test passes and thus our label function has test coverage.
Let's make the function slightly dynamic by passing in a name for the label, then converting that name to uppercase.
First, change our tests to the behavior we expect -- that is, use TDD!
The generates a label test needs its lines changed to:
test("generates a label", () => {
	const result = label("React");
	expect(result).toEqual("Hello REACT");
});
Our test now fails, thus we need to implement this feature.
The <h1>, like the test, needs to pass in a value:
<h1>{label("React")}</h1>
Now it's just a matter of changing the function to accept an argument, then uppercasing the return value:
export function label(name) {
	return `Hello ${name.toUpperCase()}`;
}
Note that the IDE has a quick fix, via Alt-Enter, to convert the string to an ES6 template string (the backticks.)
With that, our tests pass, but the TypeScript compiler is angry: the name argument doesn't have a supplied type.
Let's fix that:
export function label(name: string) {
	return `Hello ${name.toUpperCase()}`;
}
No surprise: the IDE has an Alt-Enter quick fix for this -- in this case, Infer parameter types from usage.
Stop at Breakpoint
Let's see debugging in action. Imagine we pass in a number, and we can't figure out why our function is failing.
Let's do so.
In the last generates a label test, change the result to const result = label(42);.
First, note that TypeScript warned that the supplied value was not assignable to a string:
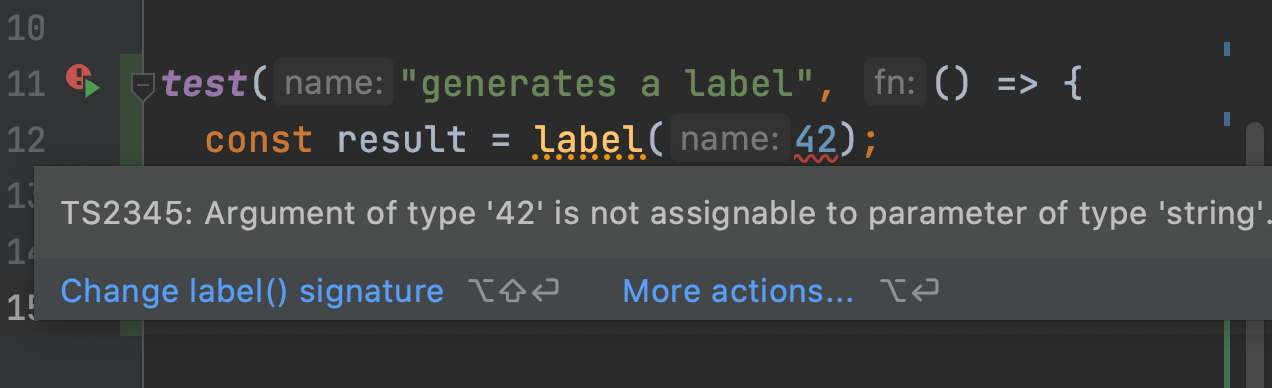
This is the beauty of TypeScript. Especially in test-writing, it helps you "fail faster". Meaning, when paired with a smart IDE, it moves the failure directly under your eyeballs, in the most immediate location...the place where you typed it. Moreover, it provides very specific error messages.
Let's go ahead and debug this.
See the red squiggly under label?
Hover over it, and you will get an inline panel showing more information:
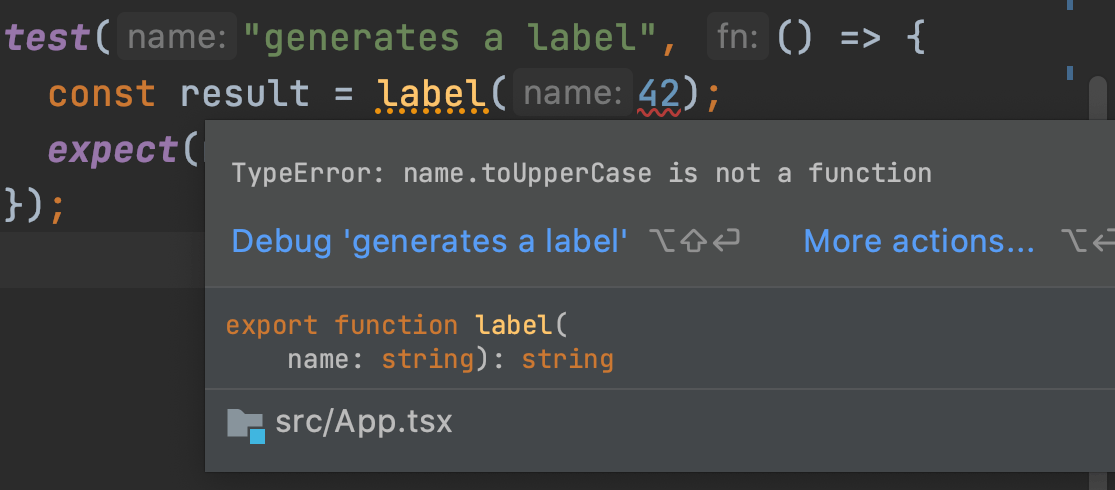
One of the options provided by this inline panel: Debug 'generates a label'.
This does several things:
- Set a breakpoint on that line
- Run the test under the debugger
- When debugging finishes, the IDE removes the breakpoint
Click the Step Into button in the debugger to step into our function call.
Execution stops in our function.
We can inspect the local values and see that name is 42.
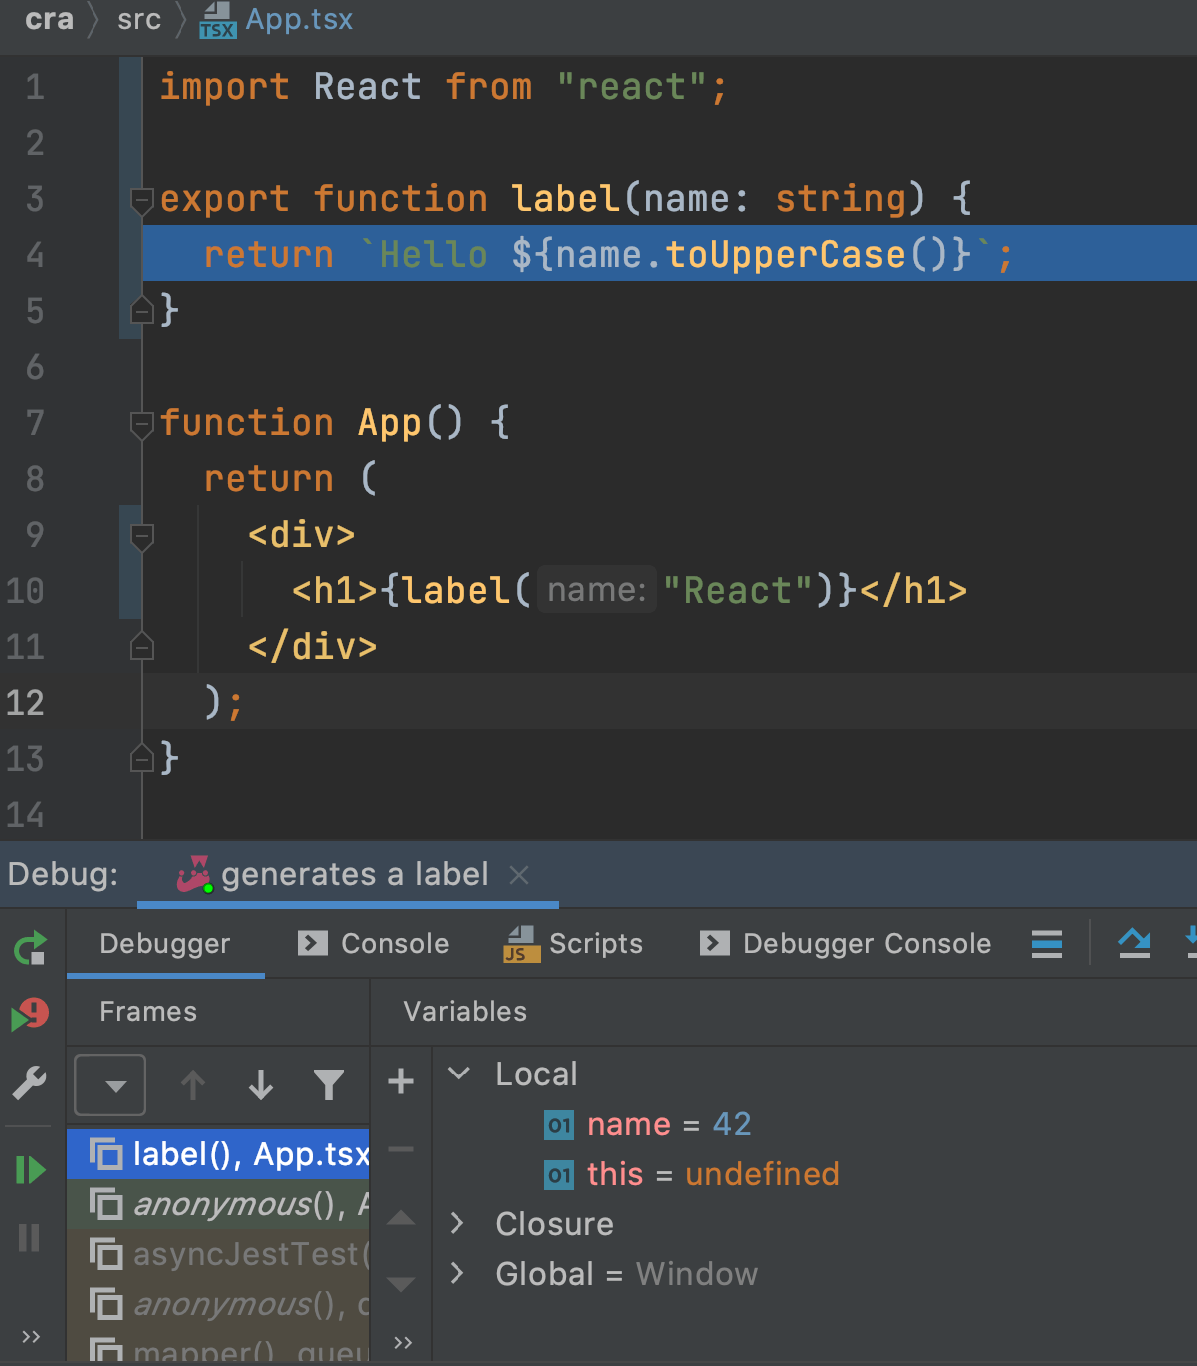
We can now poke and prod our code interactively, in the execution context where it fails.
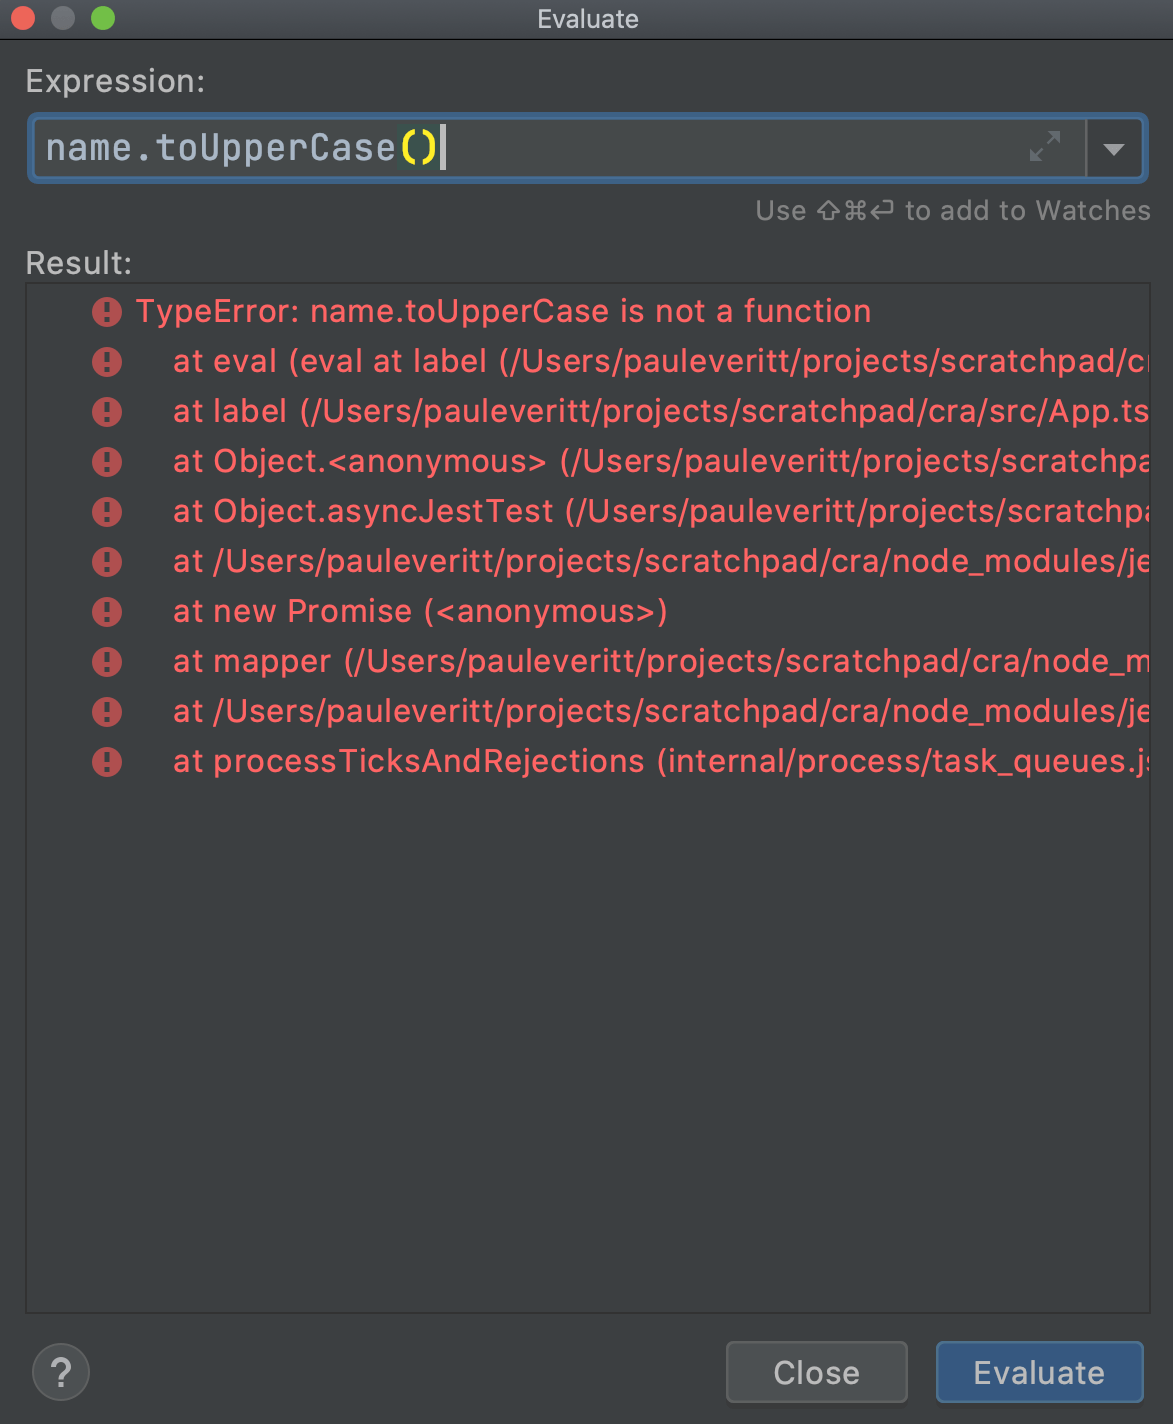
This is a very productive development cycle: write tests, when stuck, use the debugger.
No flailing around with console.log in a browser's dev tools window.
Let's clean up:
-
Click the red square to stop the debugger
-
Close the Debugger tool tab window
-
Change the test's label argument from
42back to"React"and save -
Re-open the Run Tool window
As a note, in this step, the only two files that changed were App.tsx and App.test.tsx.