
Debugging During Testing
When writing tests, use the PyCharm "visual debugger" to interactively poke around in the context of a problem.
Primary guardian, great! But what happens if there are no guardians yet? In this step we tackle that problem by combining two great features: visual testing with visual debugging.
Creating an error
Let's imagine we were working in test_primary_guardian.py on our test_primary_guardian test and did something like this:
def test_primary_guardian(player_one):
    assert player_one.primary_guardian
    player_one.add_guardians([all_guardians[0]])
    player_one.add_guardians([all_guardians[1], all_guardians[2]])
    assert all_guardians[0]
It raises an error:
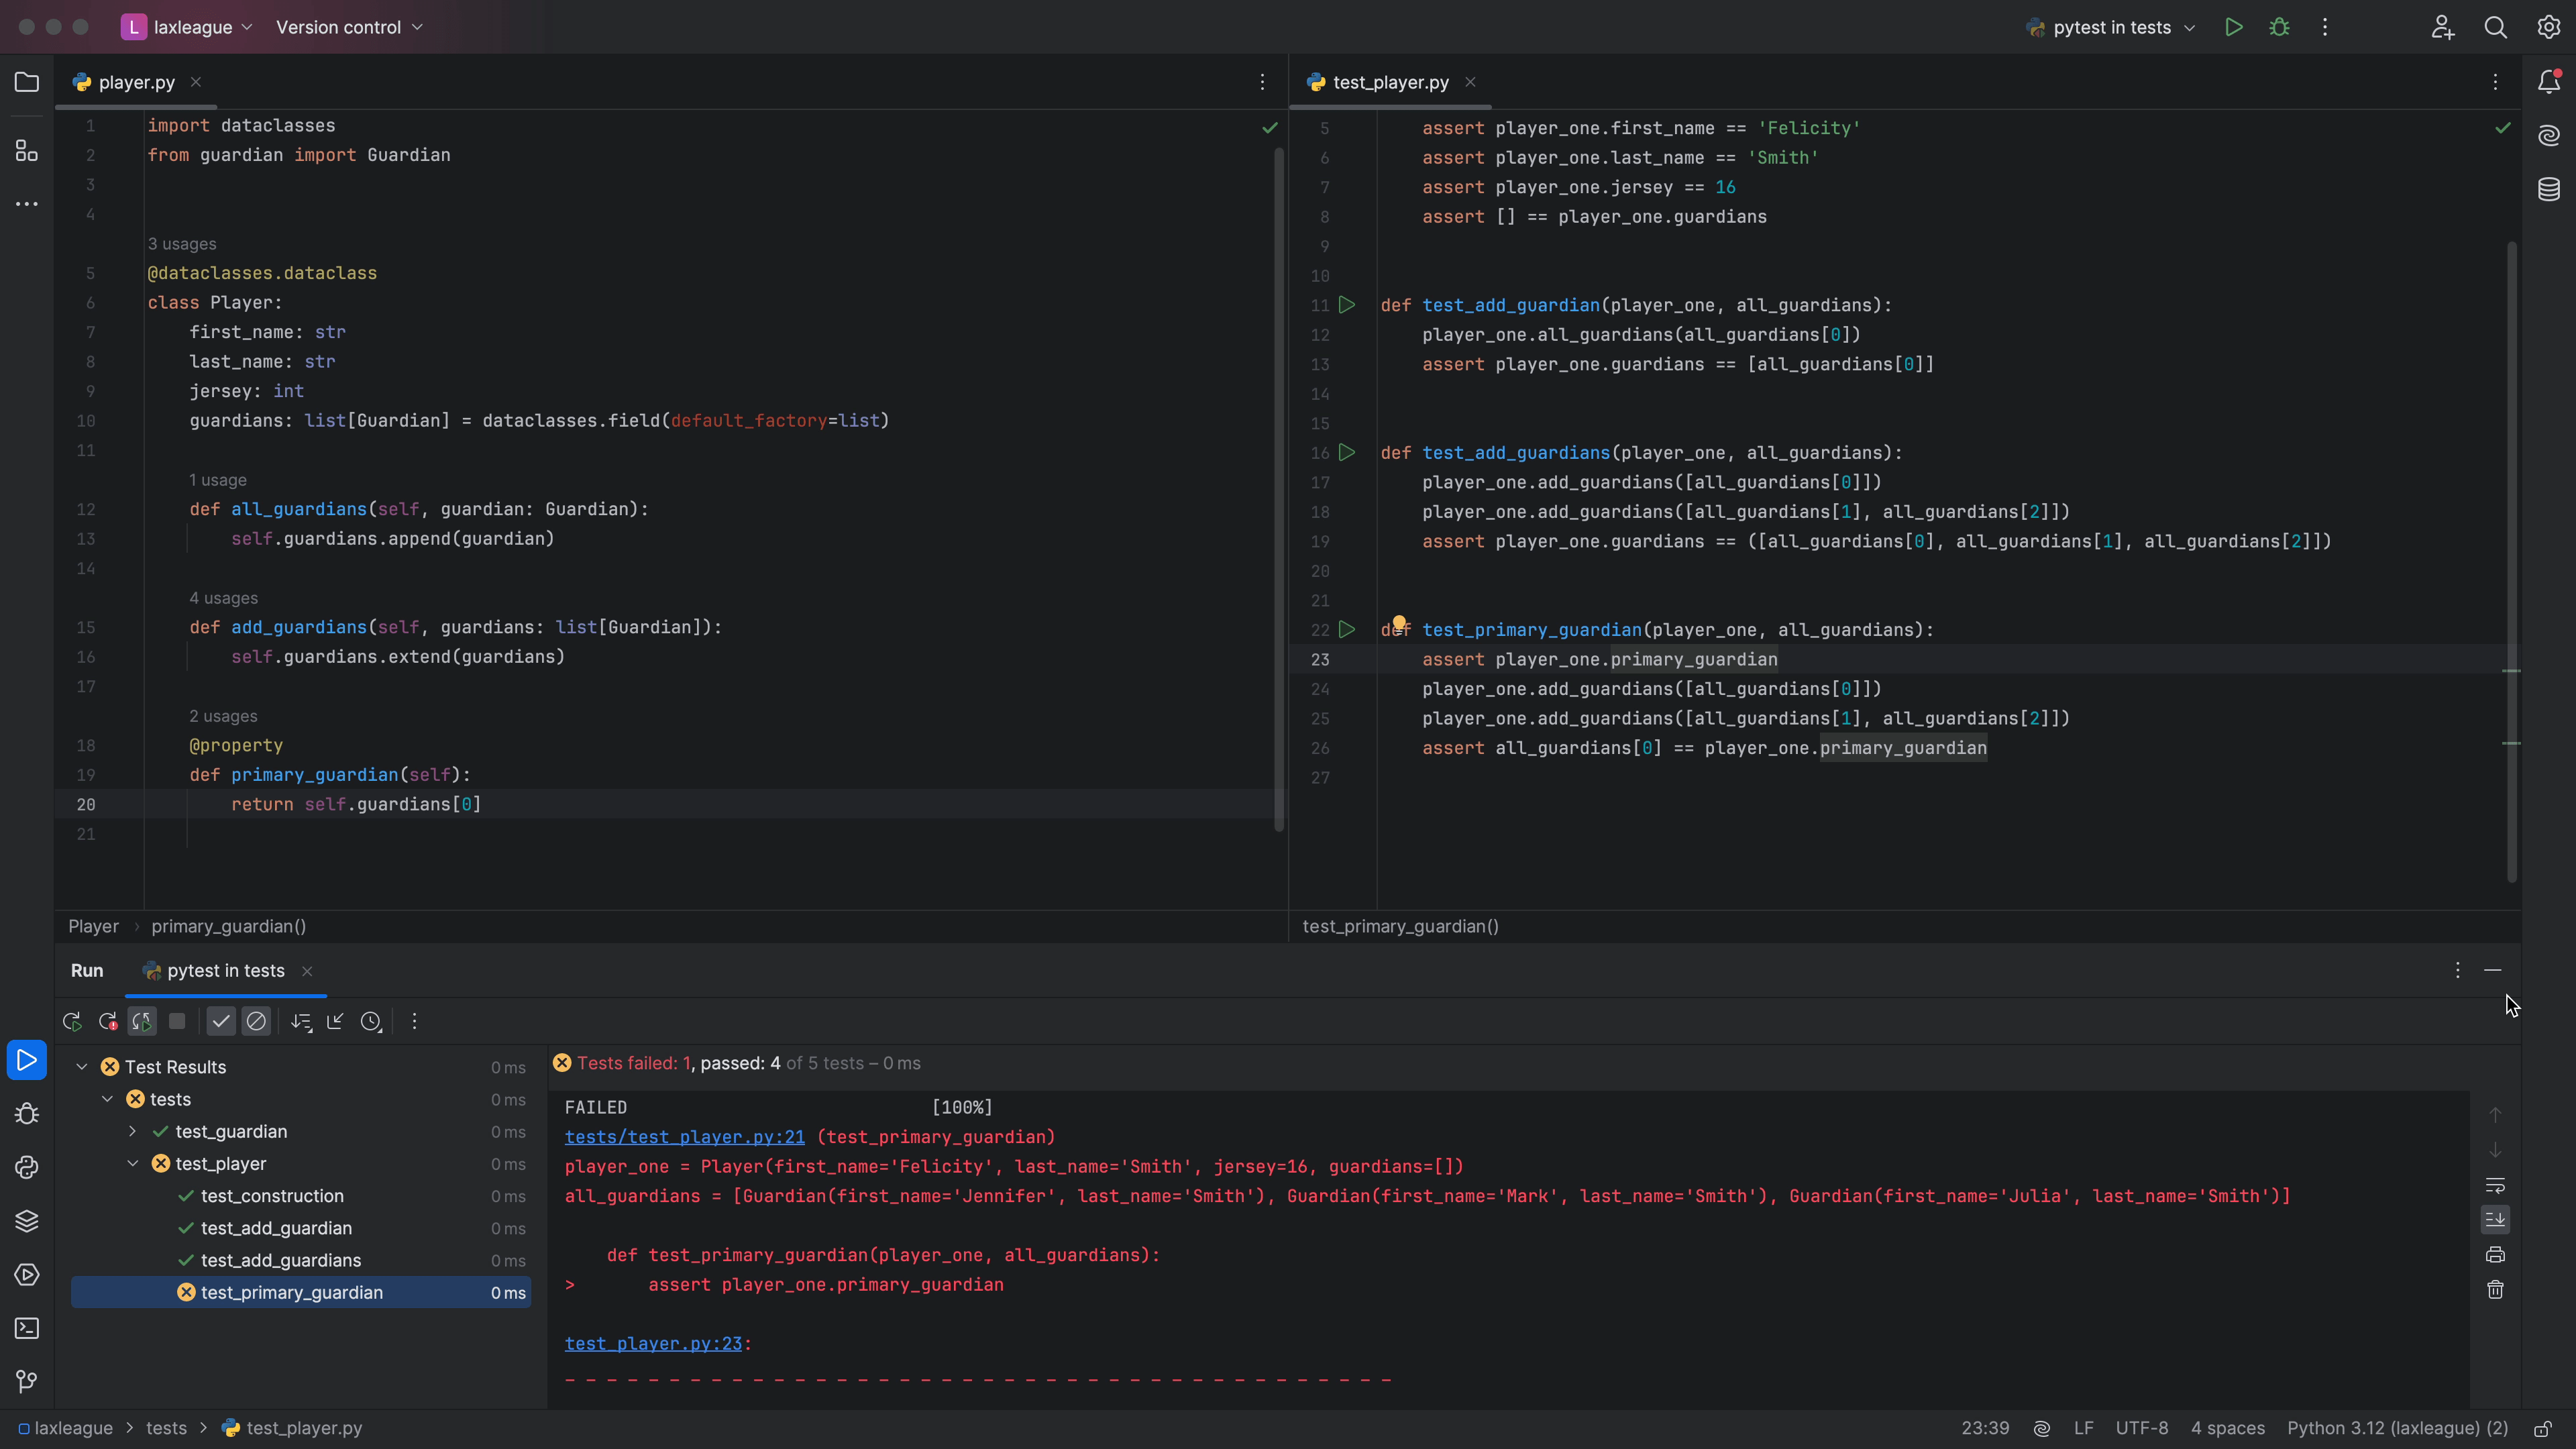
This error message is quite helpful, but let's imagine you're confused about it. "What do you mean, there's no primary guardian?" You'd like to explore a little to see what's going wrong.
Your print() Will Not Help You Here
What's the number one debugger in Python? Alas, the humble print statement. You thus reach for the "easiest" (wrong!) tool:
def test_primary_guardian(player_one):
    print(player_one.guardians)
    assert player_one.primary_guardian
    player_one.add_guardians([all_guardians[0]])
    player_one.add_guardians([all_guardians[1], all_guardians[2]])
    assert all_guardians[0]
Your tests run, but...nada. pytest is capturing output. Besides, you've now changed your code as part of investigating a problem. You could learn how to generate console output in pytest, but that would be the same issue -- writing debugging statements into your code which you might accidentally check in.
The debugger was meant for this. Fortunately PyCharm has a great "visual" debugger, tightly integrated with "visual testing." Let's use that.
Breakpoint, Step...Cha-Cha-Cha
Remove the print statement and instead, click in the gutter beside the first line in that test function.
This adds a red circle to indicate a breakpoint at assert player_one.primary_guardian:

Let's now run that one test, but under the debugger, which itself will then run pytest. Click the green triangle in the gutter to the right of test_primary_guardian and choose `Debug 'pytest for test_play...'. This brings up a new tool window in the bottom, running the debugger:
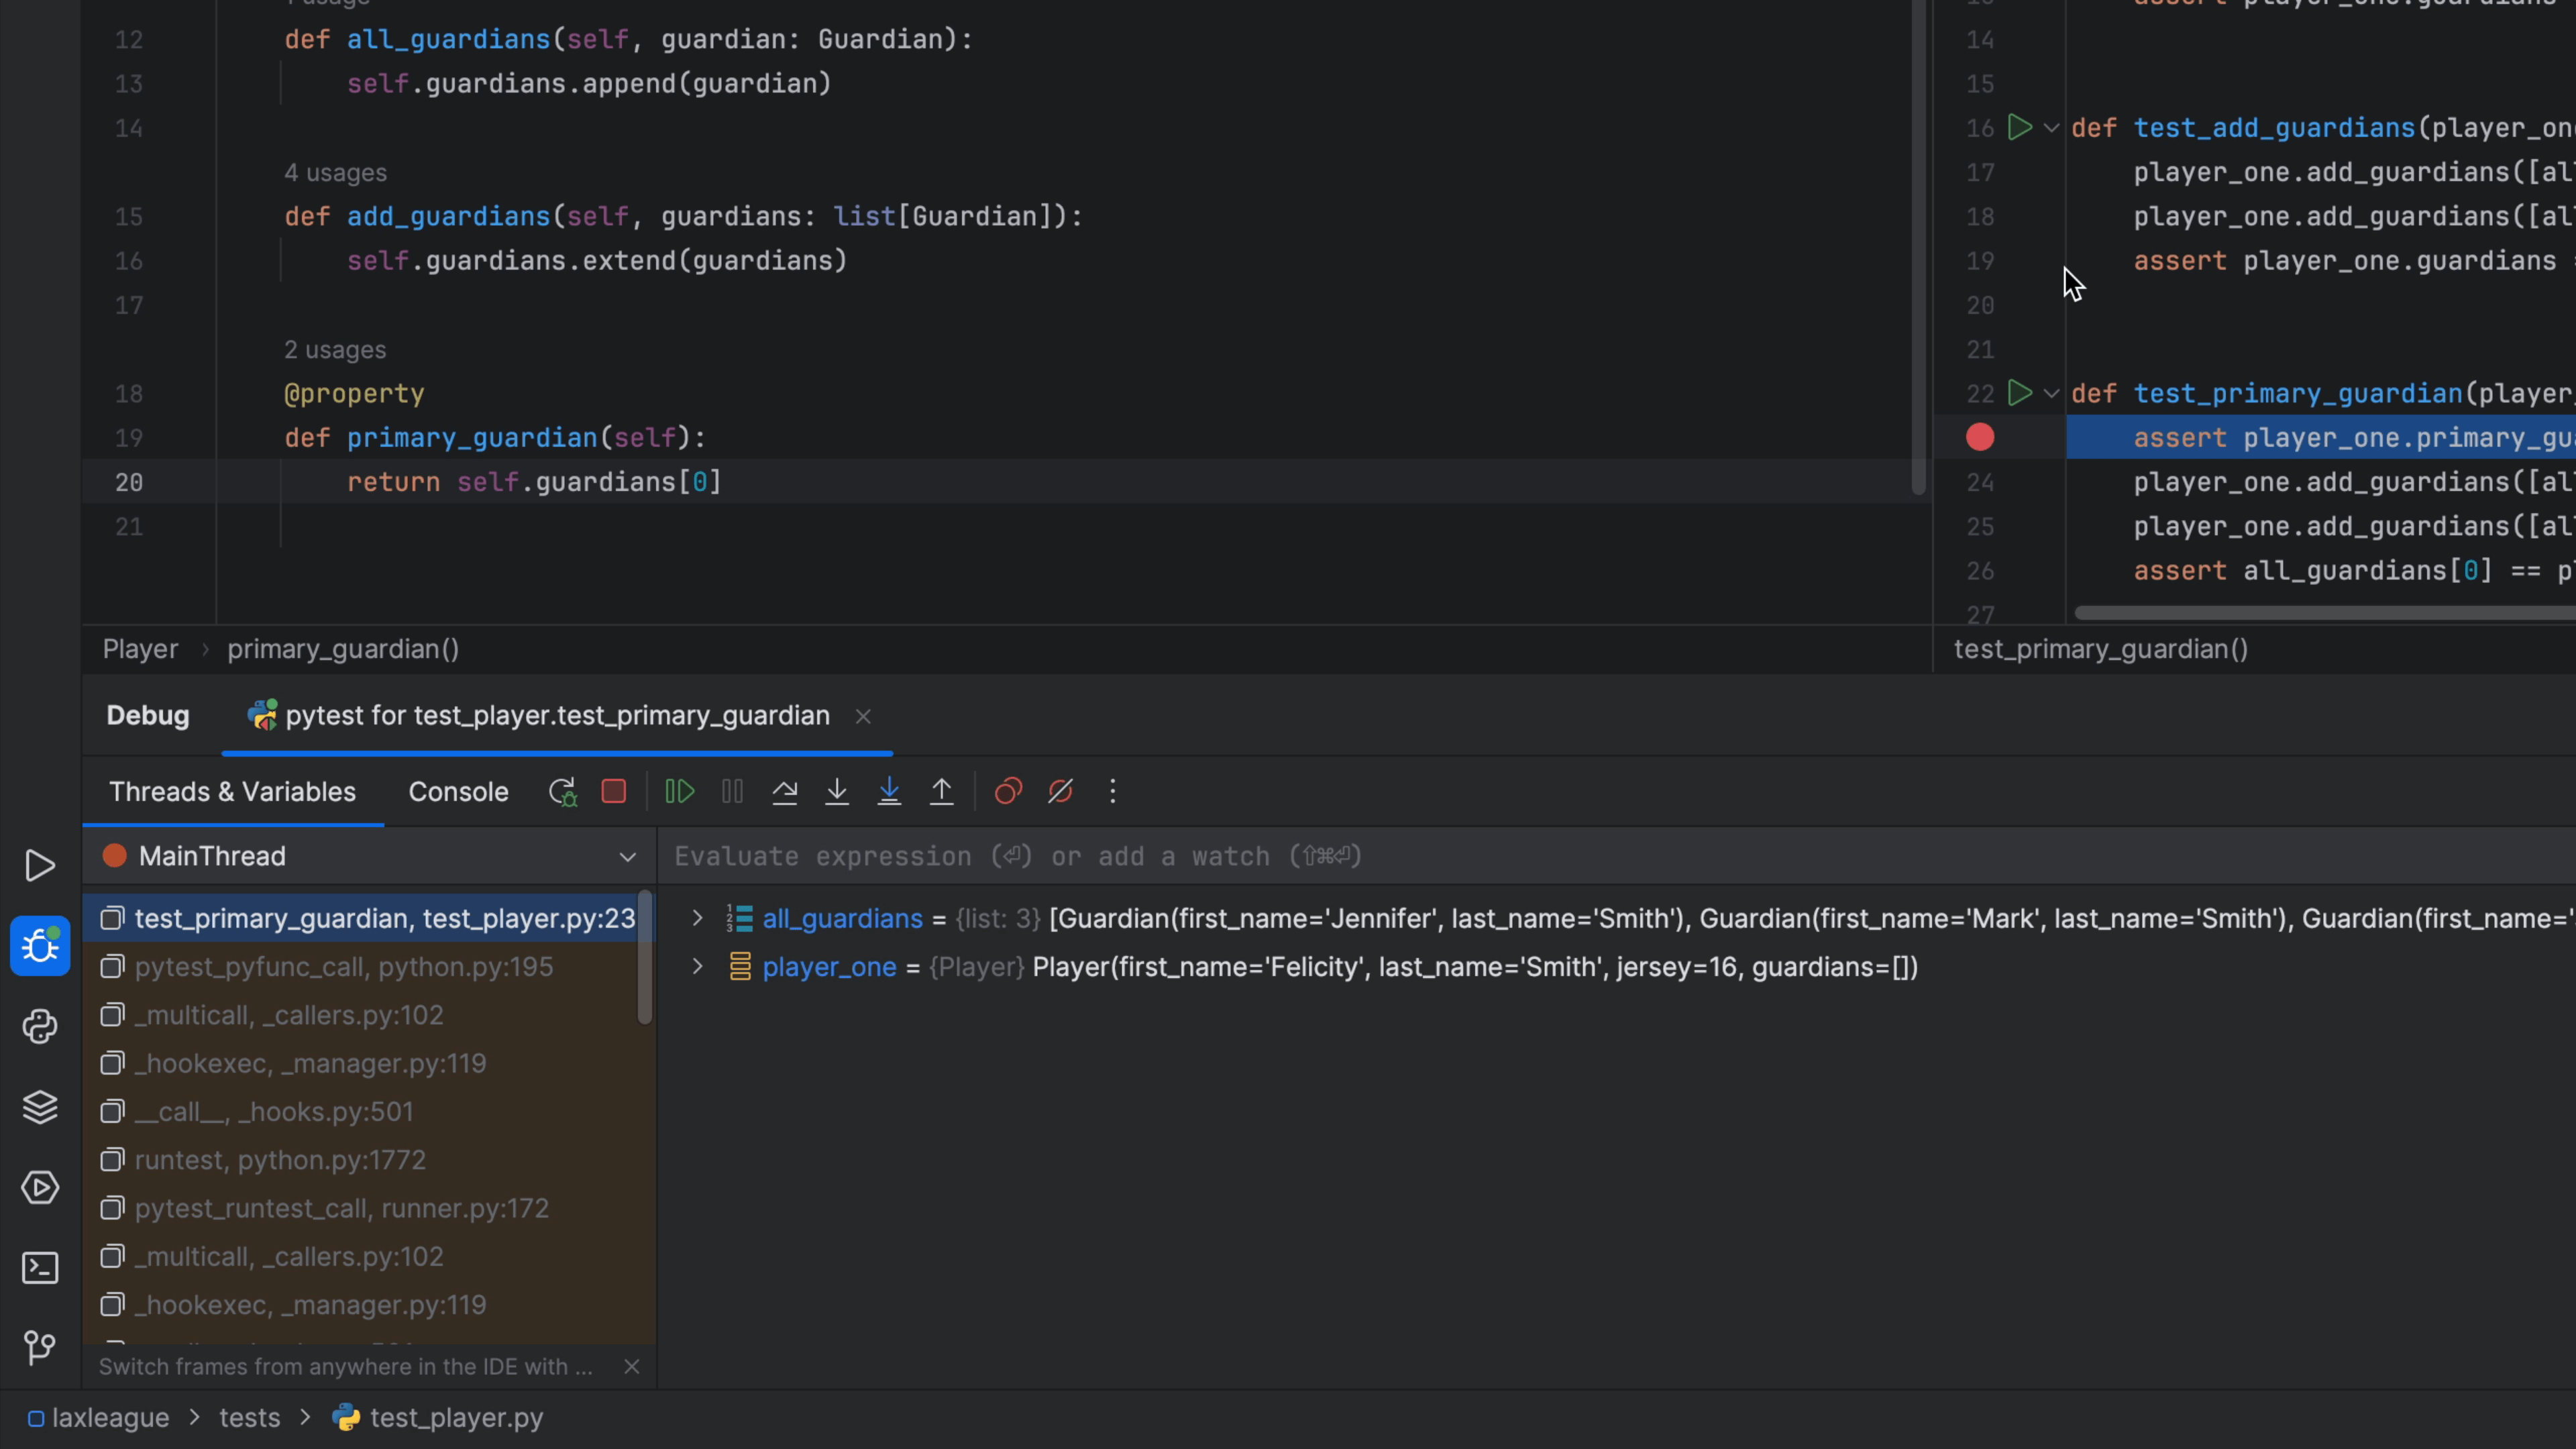
Our test execution has stopped on the line with the assertion. Our Threads & Variables pane shows that player_one exists in the scope and we can take a look at it:

Aha, that's the problem! But let's say we still couldn't spot it. We want to poke around interactively. Highlight player_one.primary_guardian in that line of code -- the one triggering the error -- then right click and choose Evaluate Expression. When you click Evaluate button, you se the output:
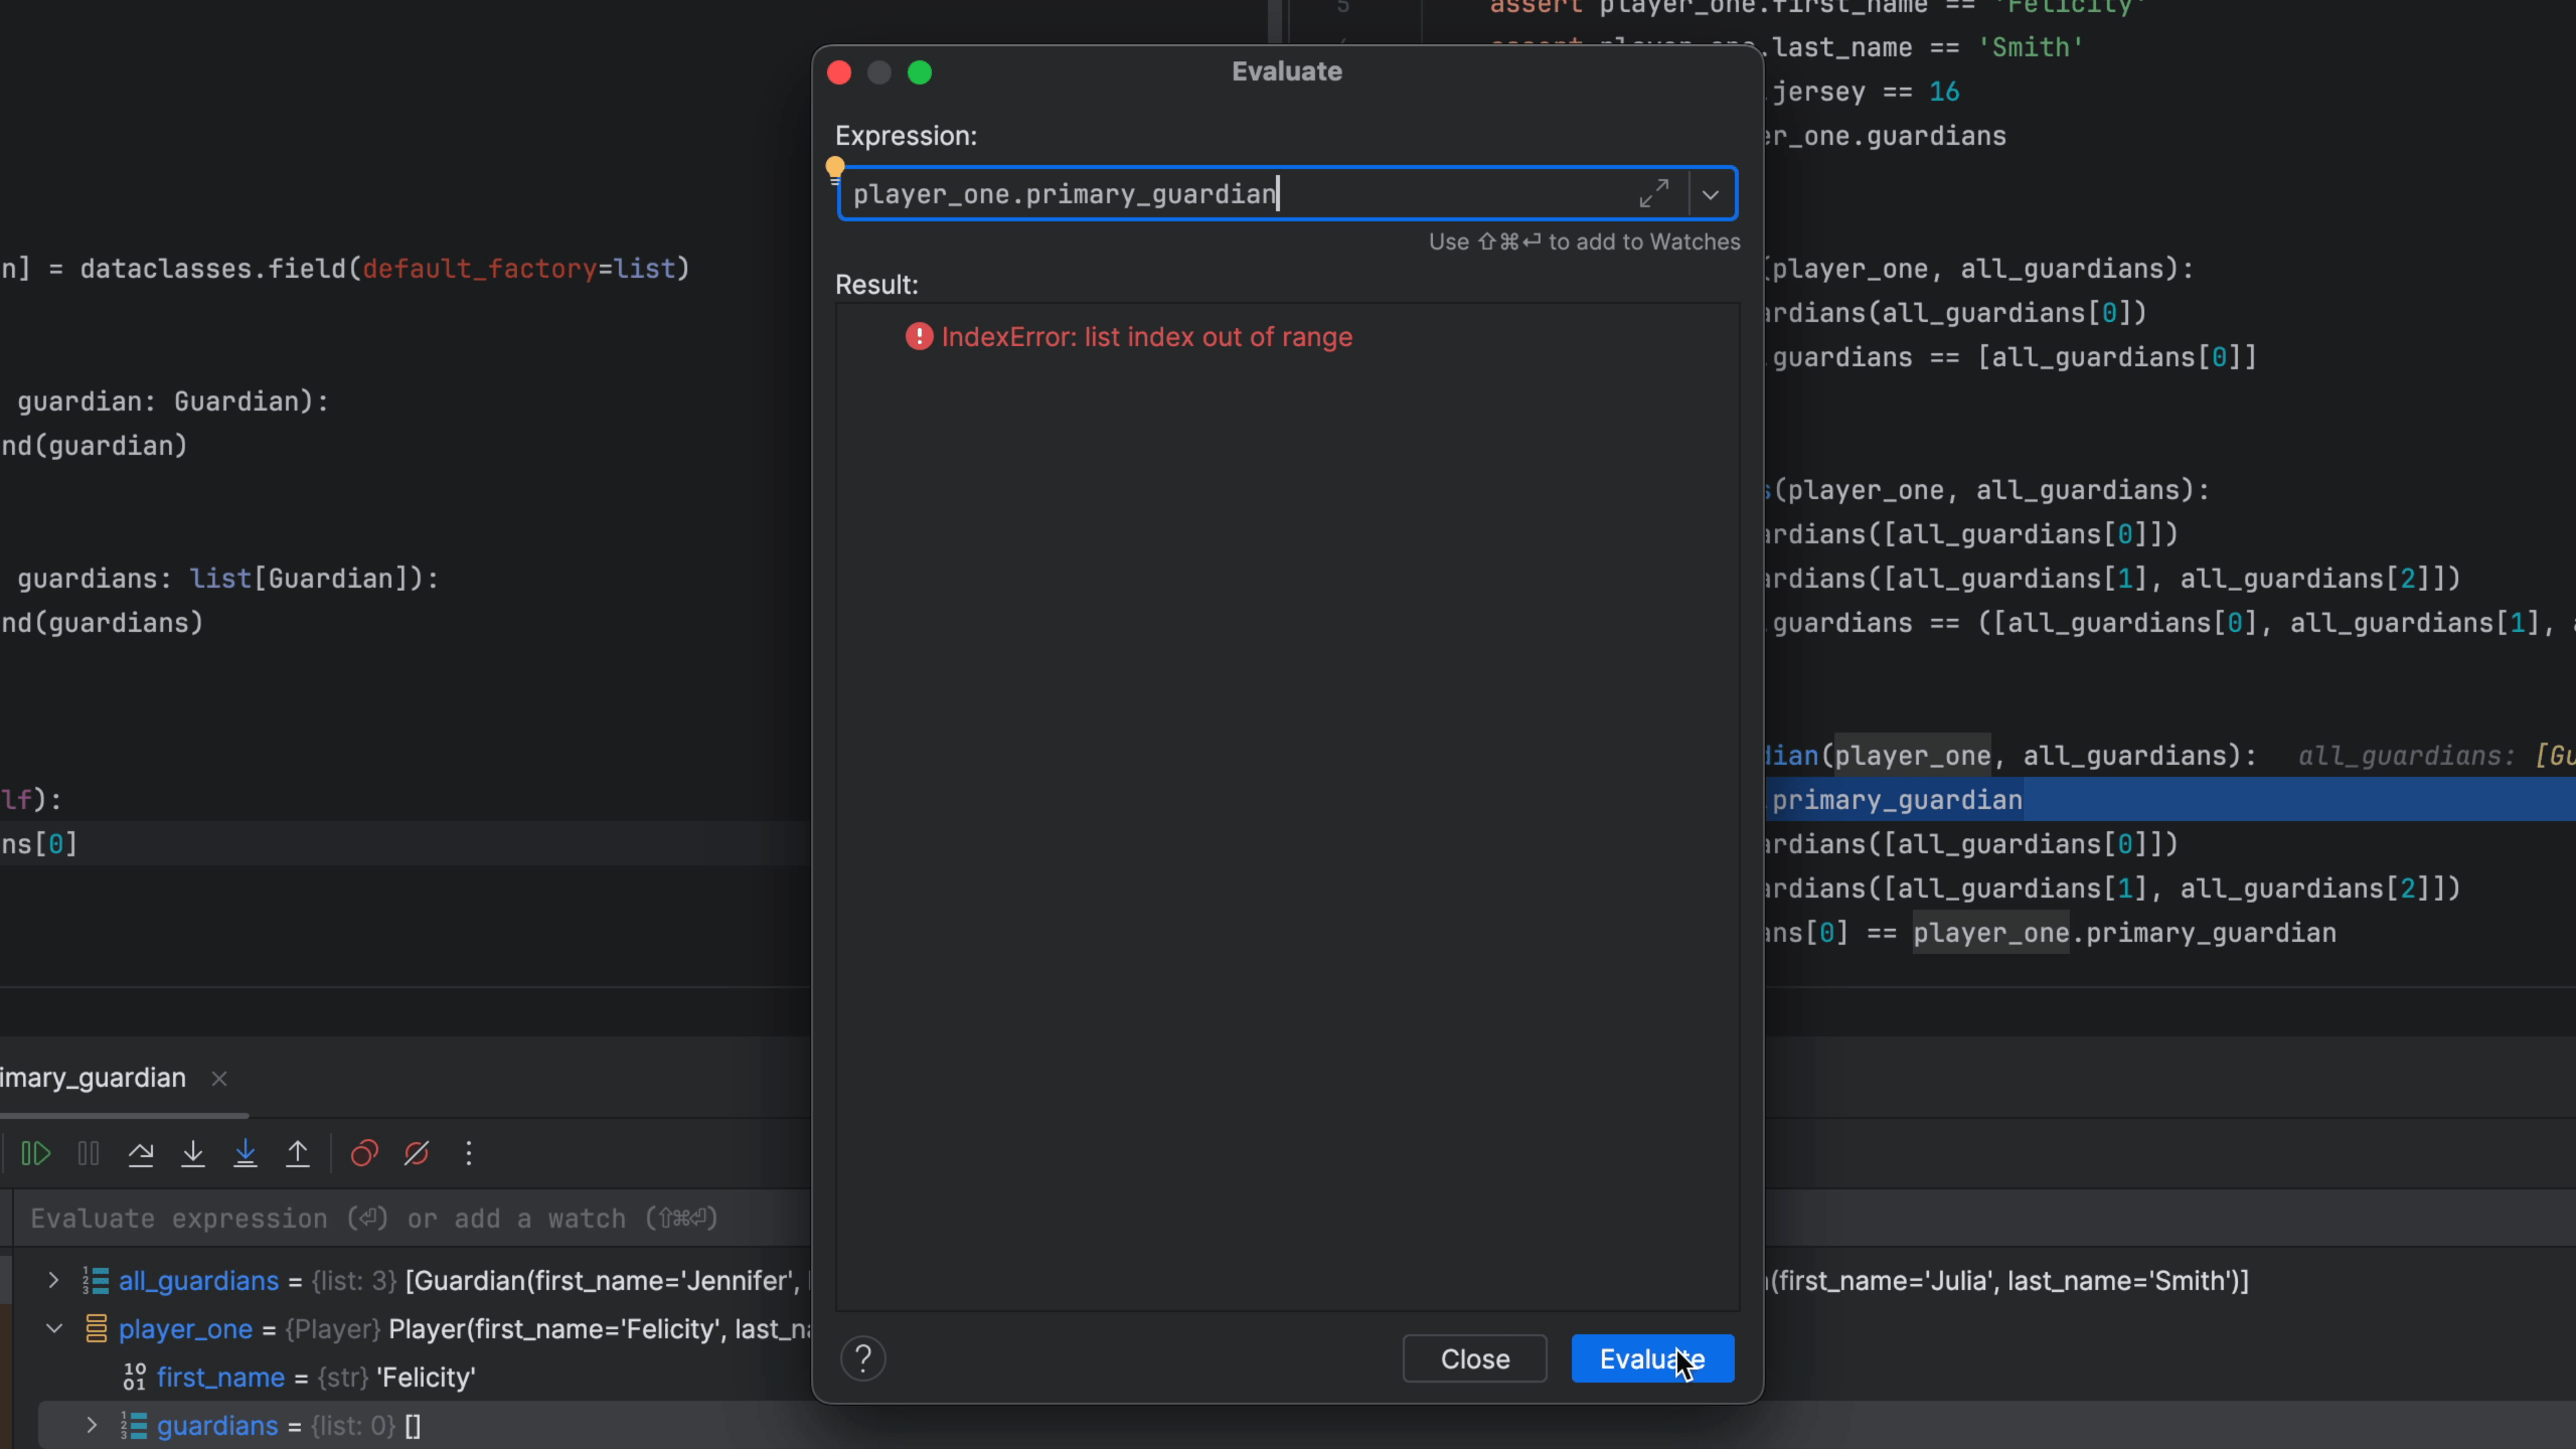
You can now poke around interactively in the state at that point by typing in the Expression: field. You can even overwrite the value of a variable in the scope or create new variables.
You're currently poking around in the code for the test, but perhaps you want to poke around in the implementation. Click Step Into and the debugger will put you on the return self.guardians[0] line in the primary_guardian property/method.
With this we quickly see what is the problem: there is no item zero in self.guardians. Finish up by removing the assert player_one.primary_guardian line and clearing the breakpoint by clicking on the red circle. Close the debugger tool window by clicking on its (x).
The debugger is a fantastic tool when doing TDD -- not just when you have a problem, but whenever you want to explore.