
Trusted by 72% of Java developers
The Java and Kotlin IDE
For You and Your Agents
Free – with 30 days of Ultimate included
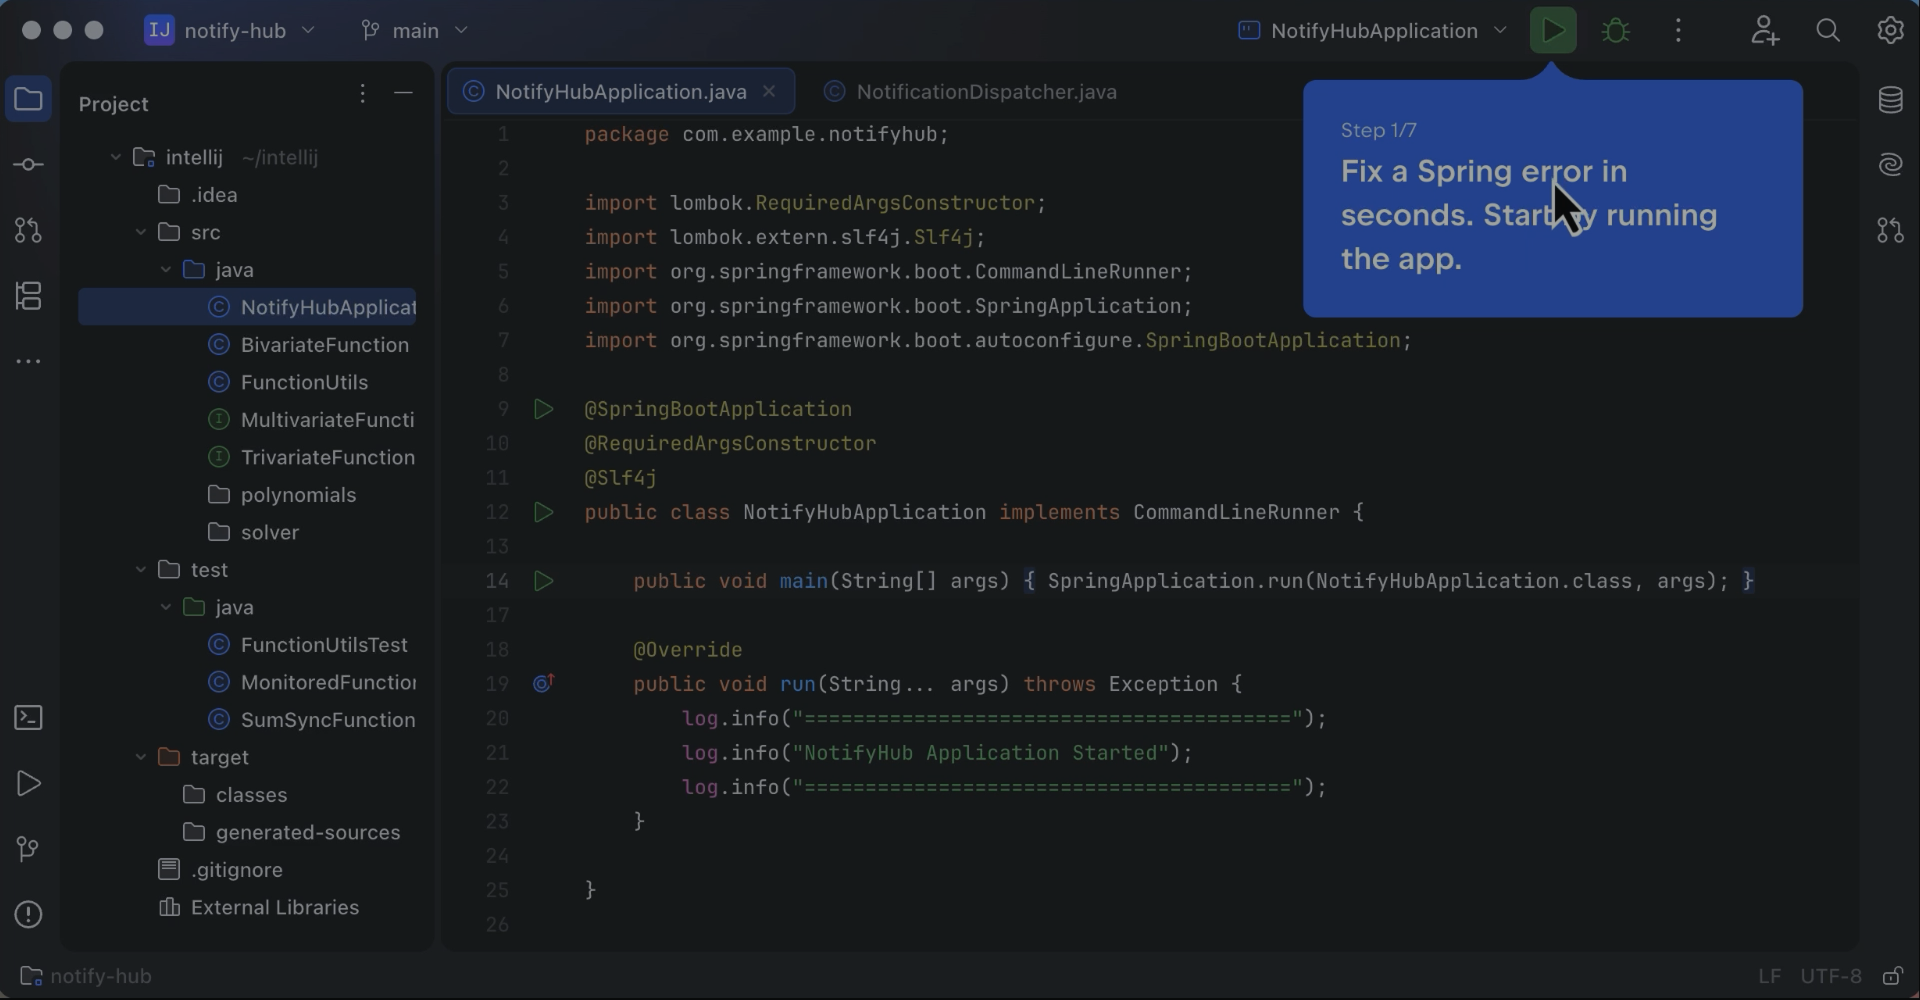
See how IntelliJ IDEA understands your Spring application and helps you find and fix errors in just a few steps.
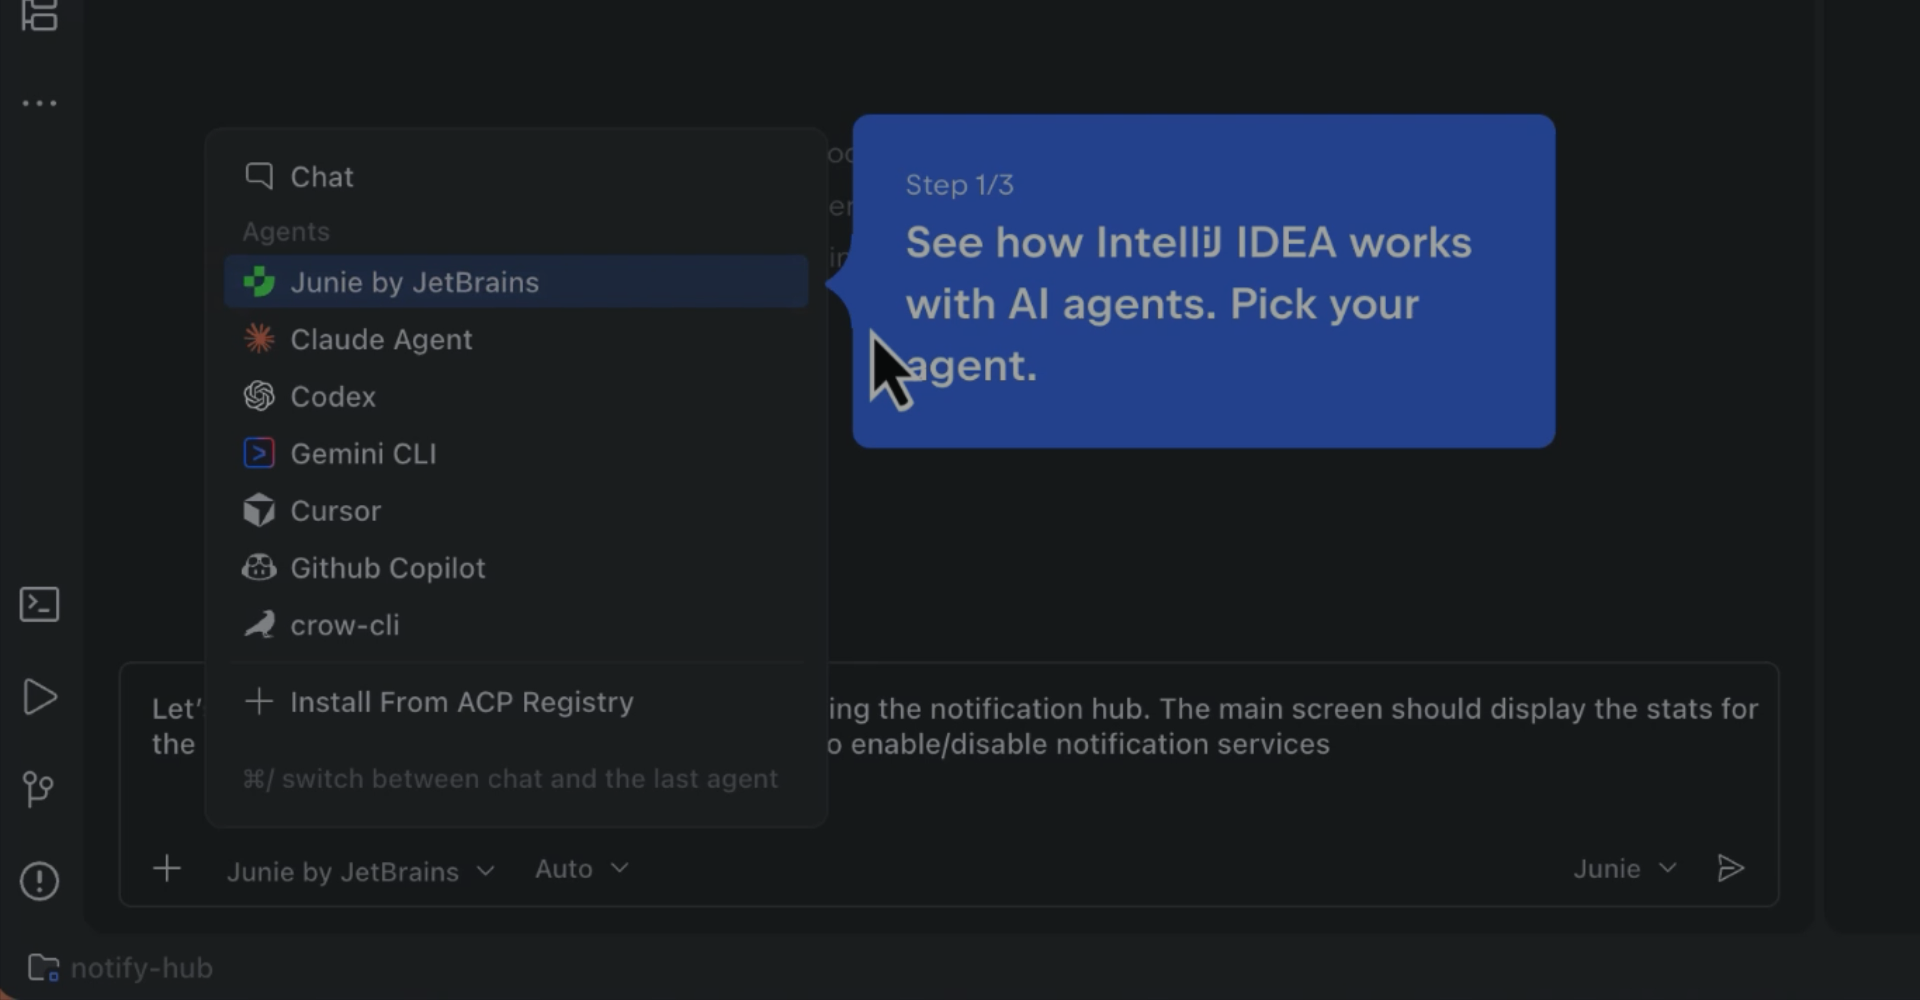
Watch an AI agent at work in IntelliJ IDEA and see how to use your preferred agent right inside the IDE.
Trusted by 300,000+ organizations



Smarter agents. Faster development. One professional IDE.
Customer Stories

Yasuaki Kato
Software Engineer at a healthcare and senior care technology company
“The reason we use IntelliJ IDEA is because we believe it is the most efficient choice for development.”

Jay
Backend Engineer at a company building software for self-service photo studios
“Git integration enables partial commits, branch comparisons, and rebasing within the IDE. For large-scale codebases, class diagrams and dependency analysis provide a clear view of structure and impact. When needed, tuning indexing and build caches improves speed even further."

Varij Kapil
A former Software Developer at a company building custom IT and cloud solutions
“Breaking changes and refactoring need to happen in multiple Java modules and React components. Making such huge changes would not have been possible without JetBrains products.”

Phan Manh Hung
CIO at a company building digital infrastructure for healthcare
“In healthcare software, the most expensive line of code is often the one nobody felt safe to refactor. Our team uses [...] IntelliJ IDEA for the Java/Spring Boot core of [our Health Platform], where you refactor carefully because the rules governing patient data don't move.”
Download IntelliJ IDEA
Supercharge your AI agents with IDE-level confidence.