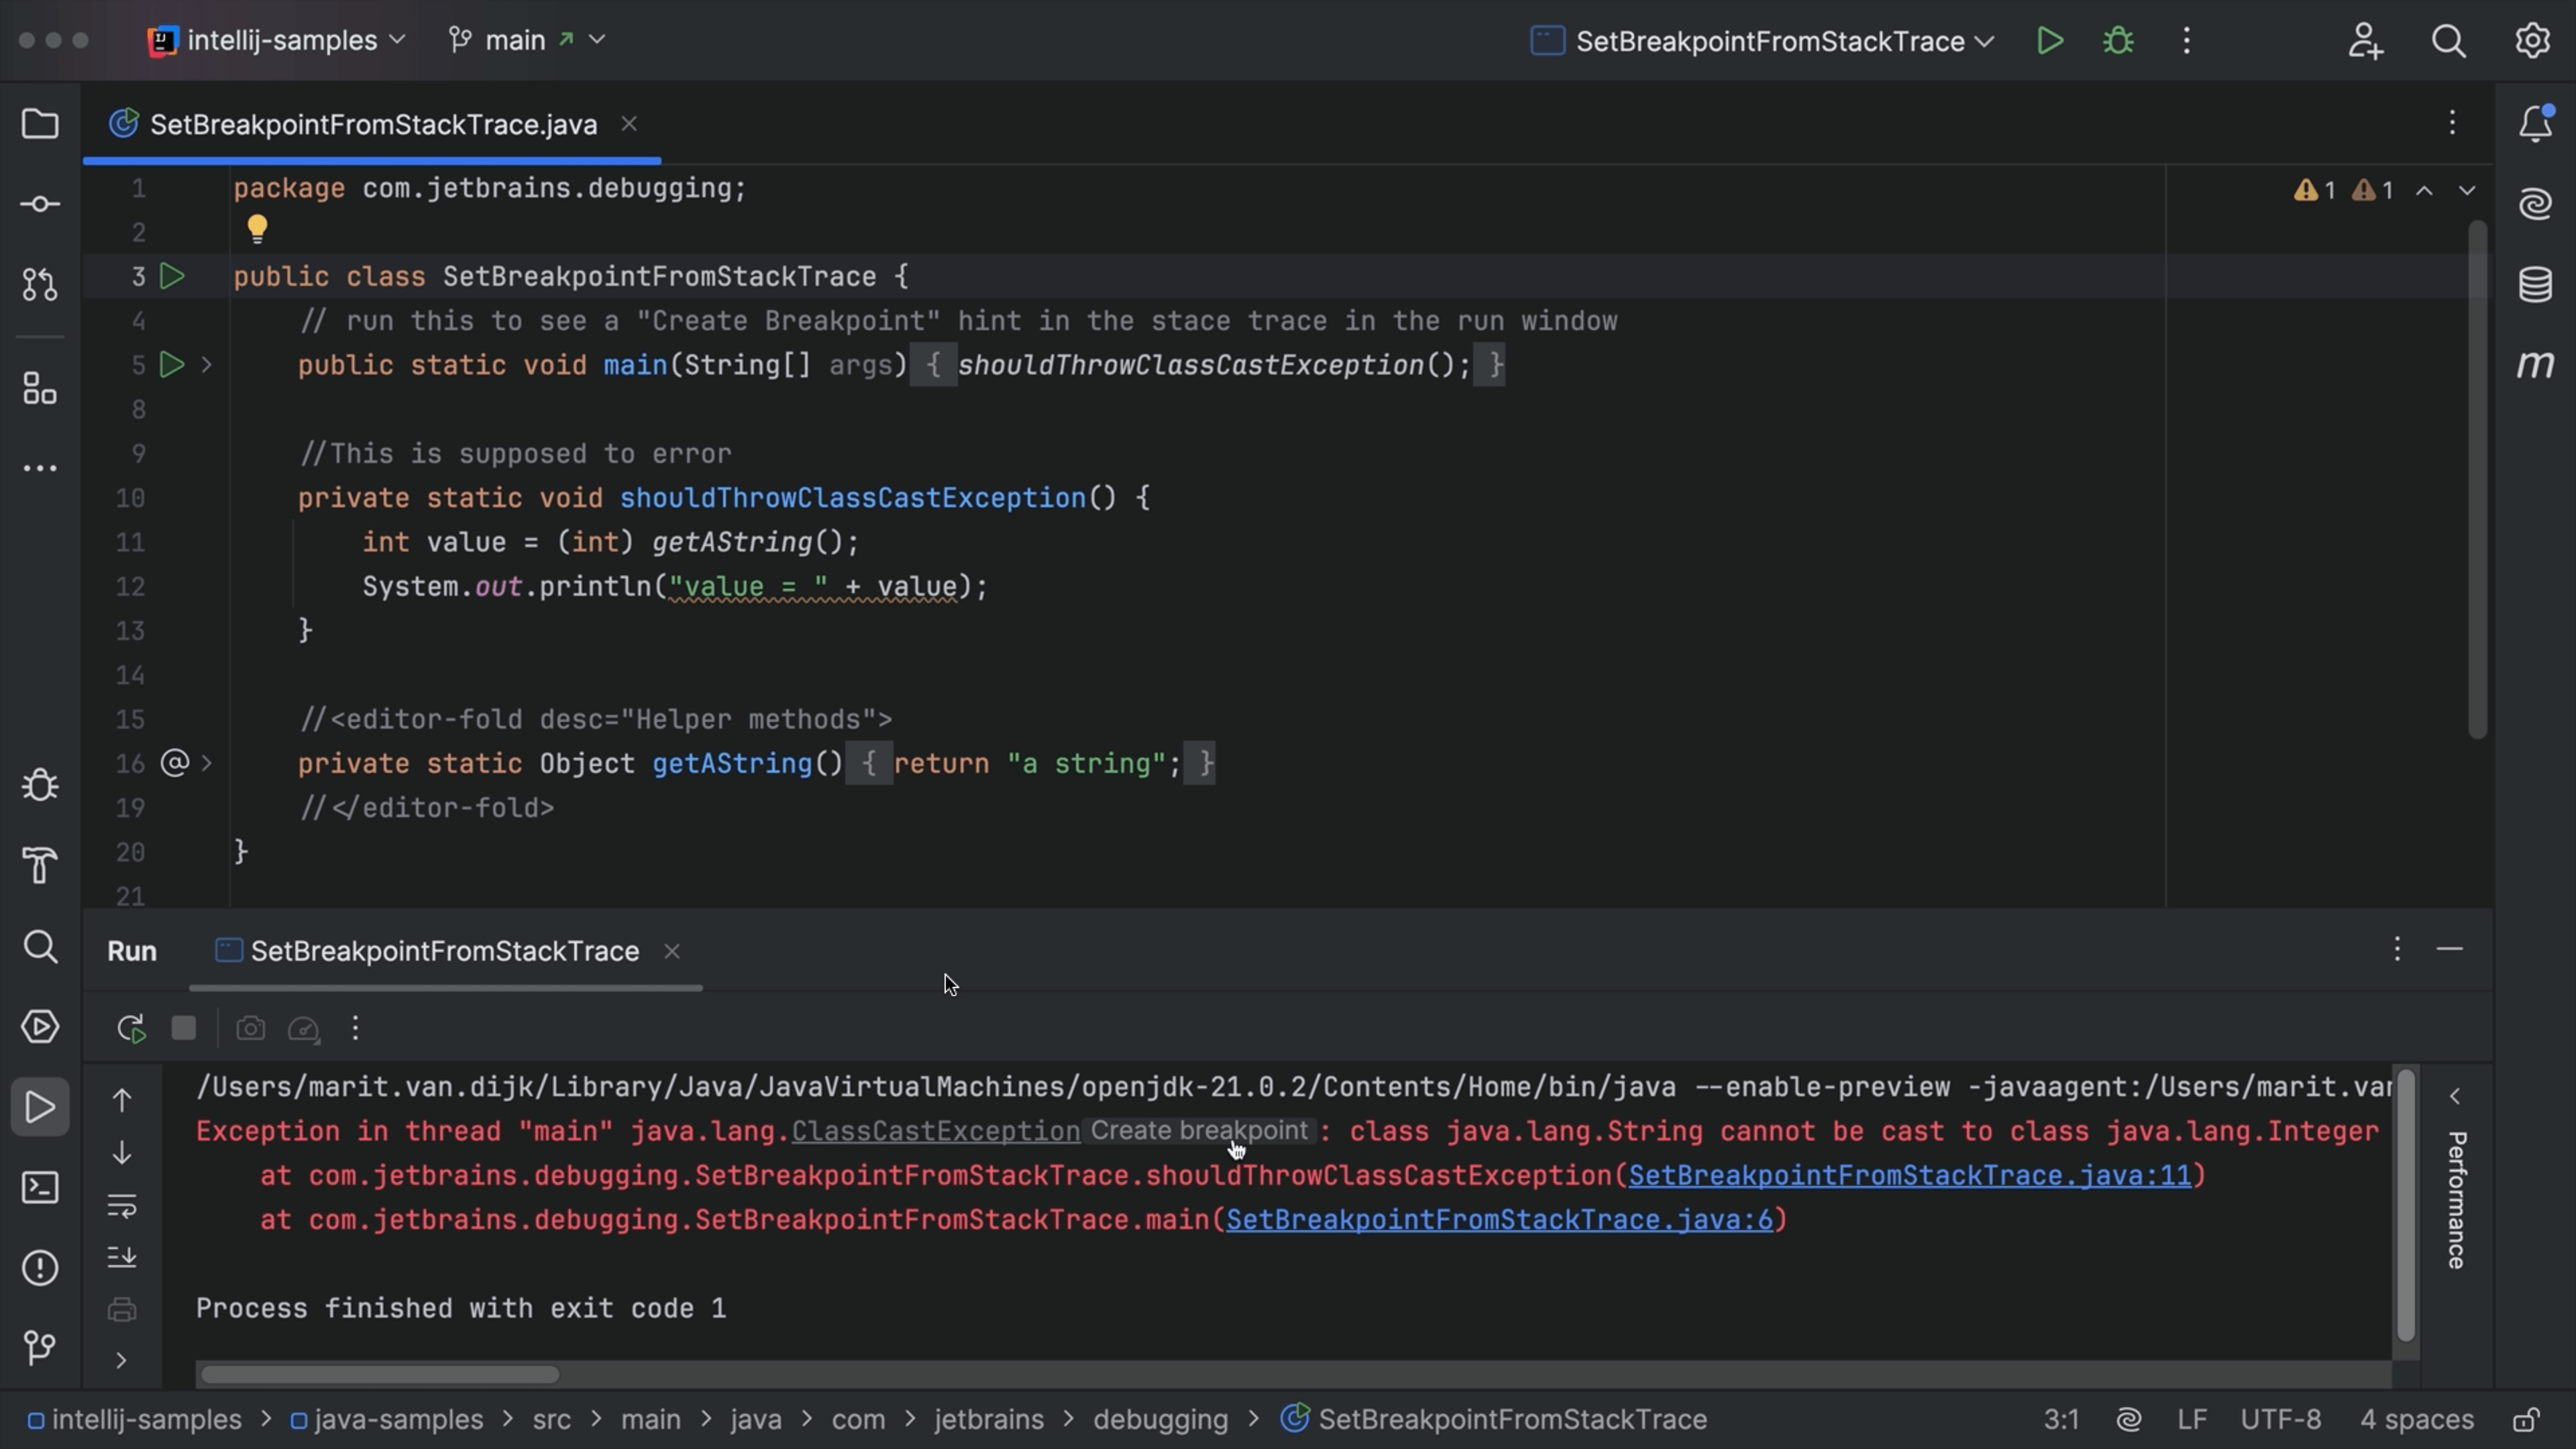
Debugging
Investigate errors and trace code execution with our visual debugger.
Our IDEs feature a powerful, visual debugger. Useful for finding problems in your code and poking and exploring code execution.
Investigate errors and trace code execution with our visual debugger.
Our IDEs feature a powerful, visual debugger. Useful for finding problems in your code and poking and exploring code execution.

Part of tutorial
What are Azure Functions?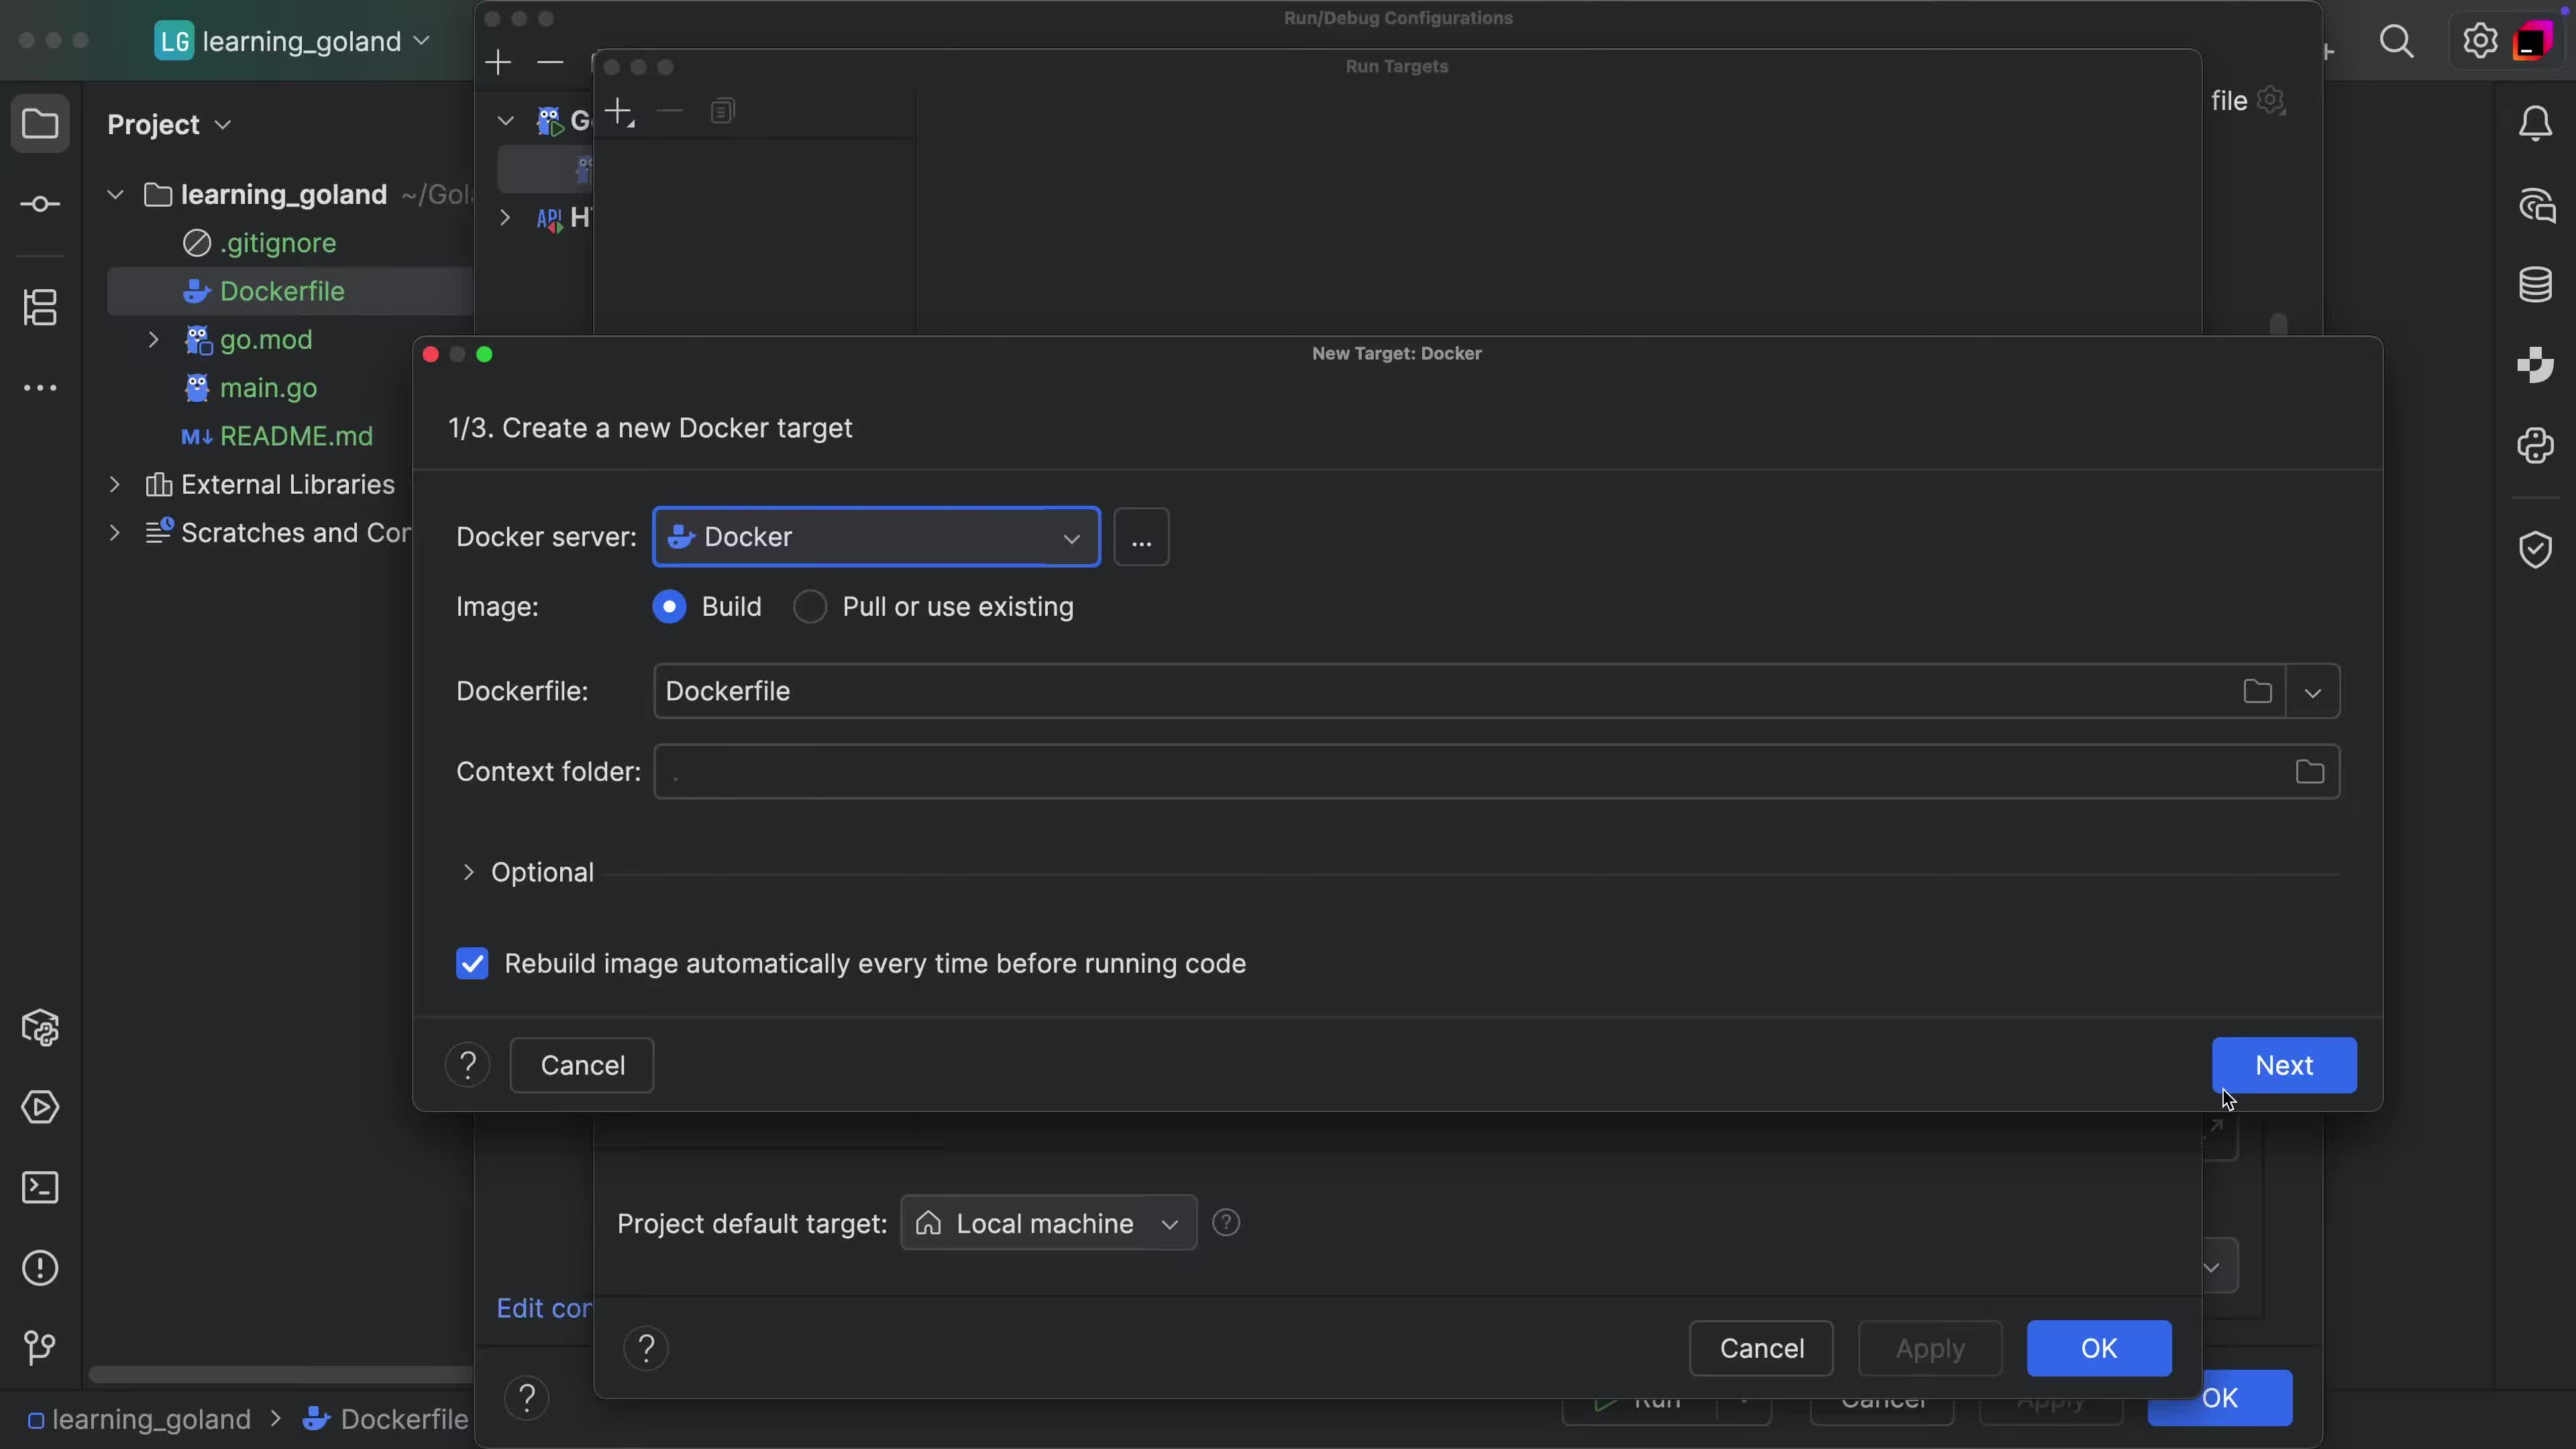

Tip
Stop a Remote Process After Debugging It
Tip
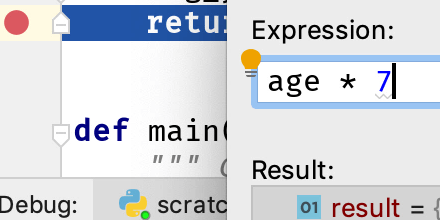
Code completion in Evaluate Expression, Watches or Conditional Breakpoints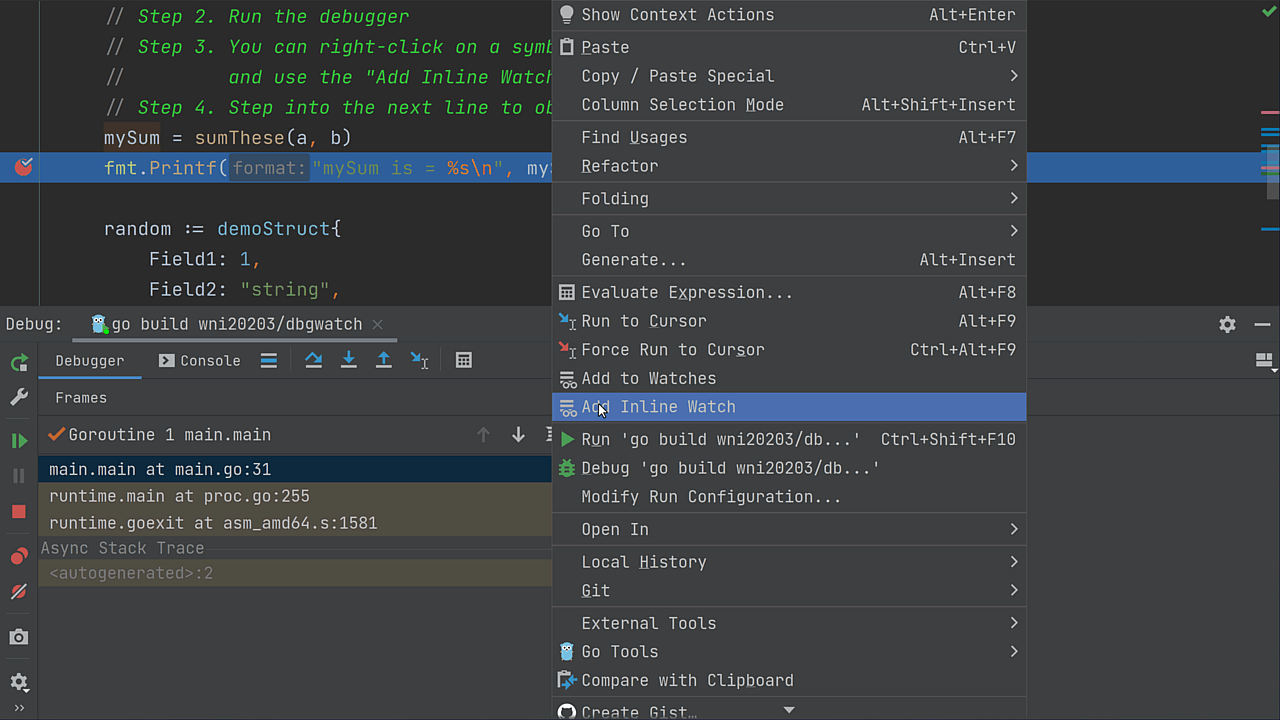
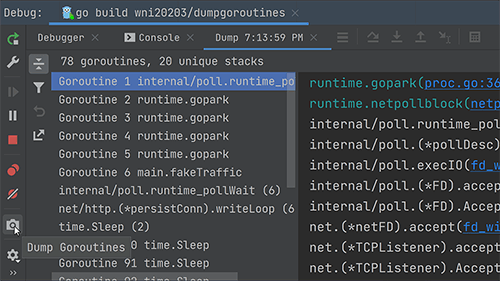
Tip
Dump Goroutines from a Running Application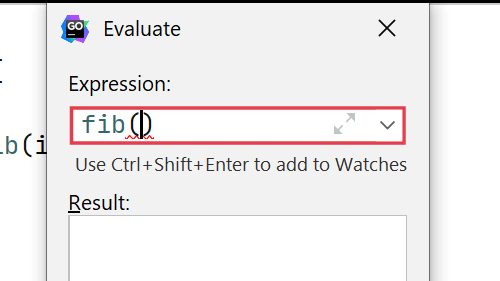

Part of tutorial
Debugging During Testing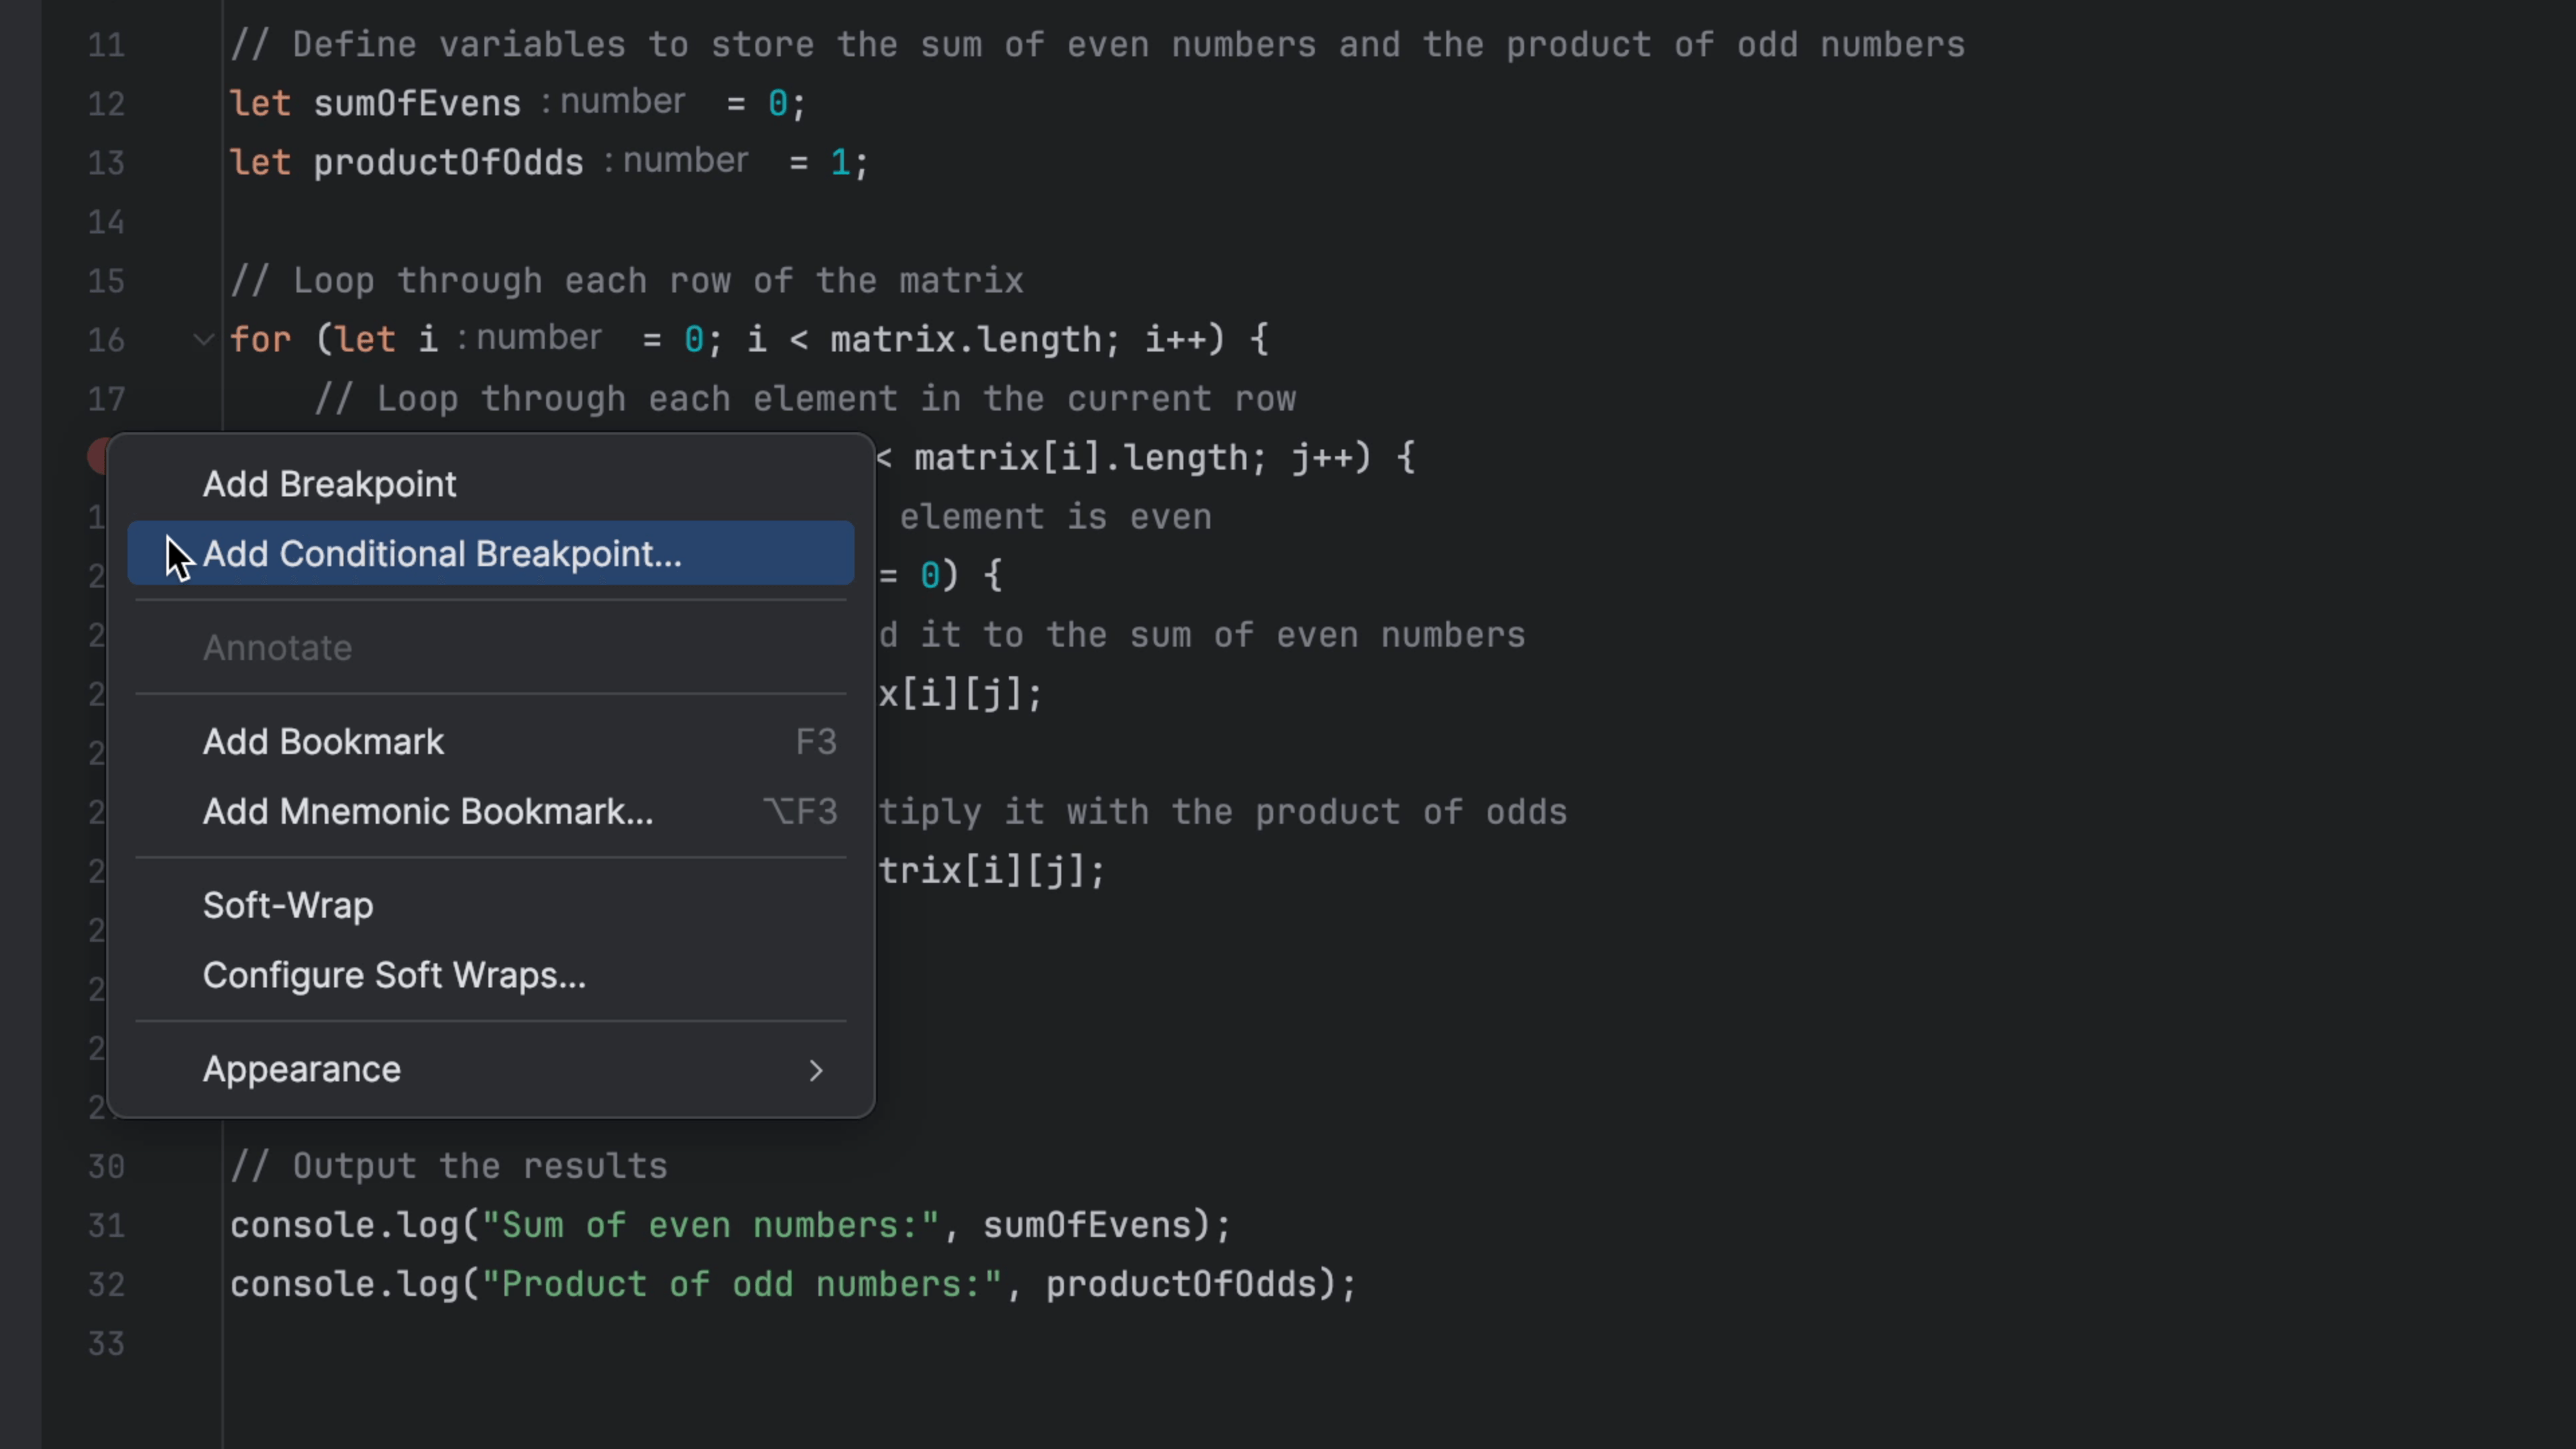
Tip
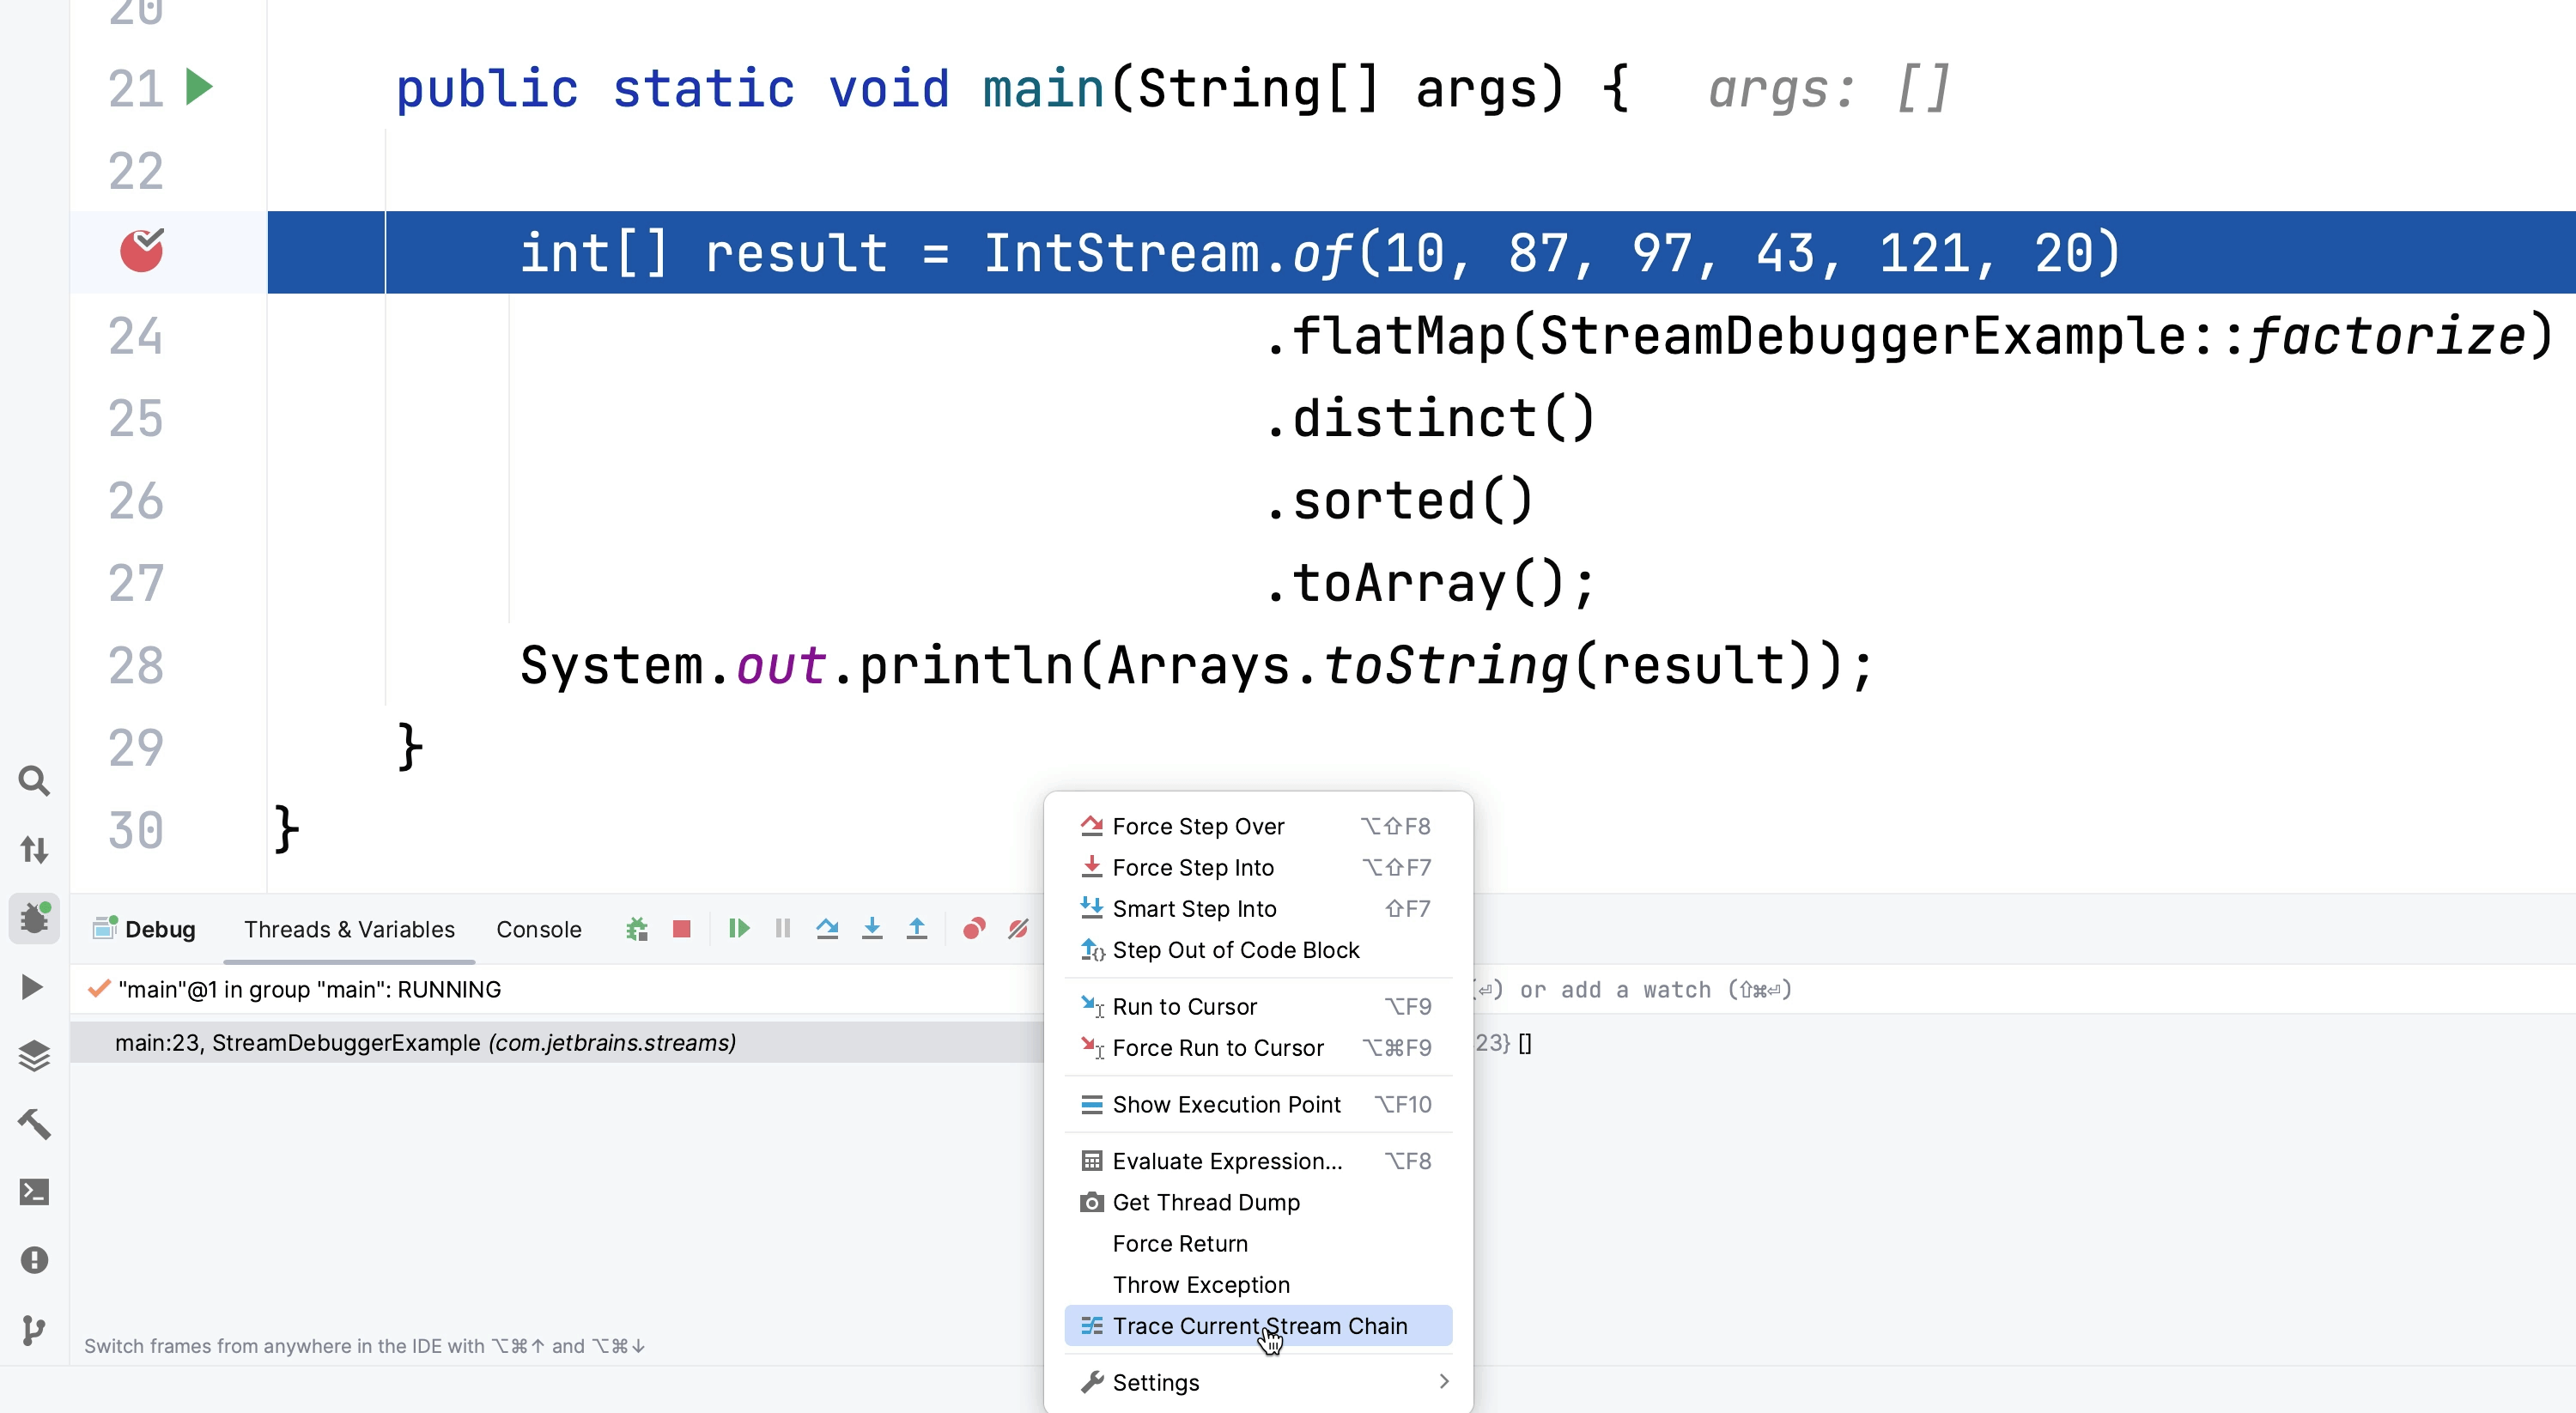
Working with Conditional Breakpoints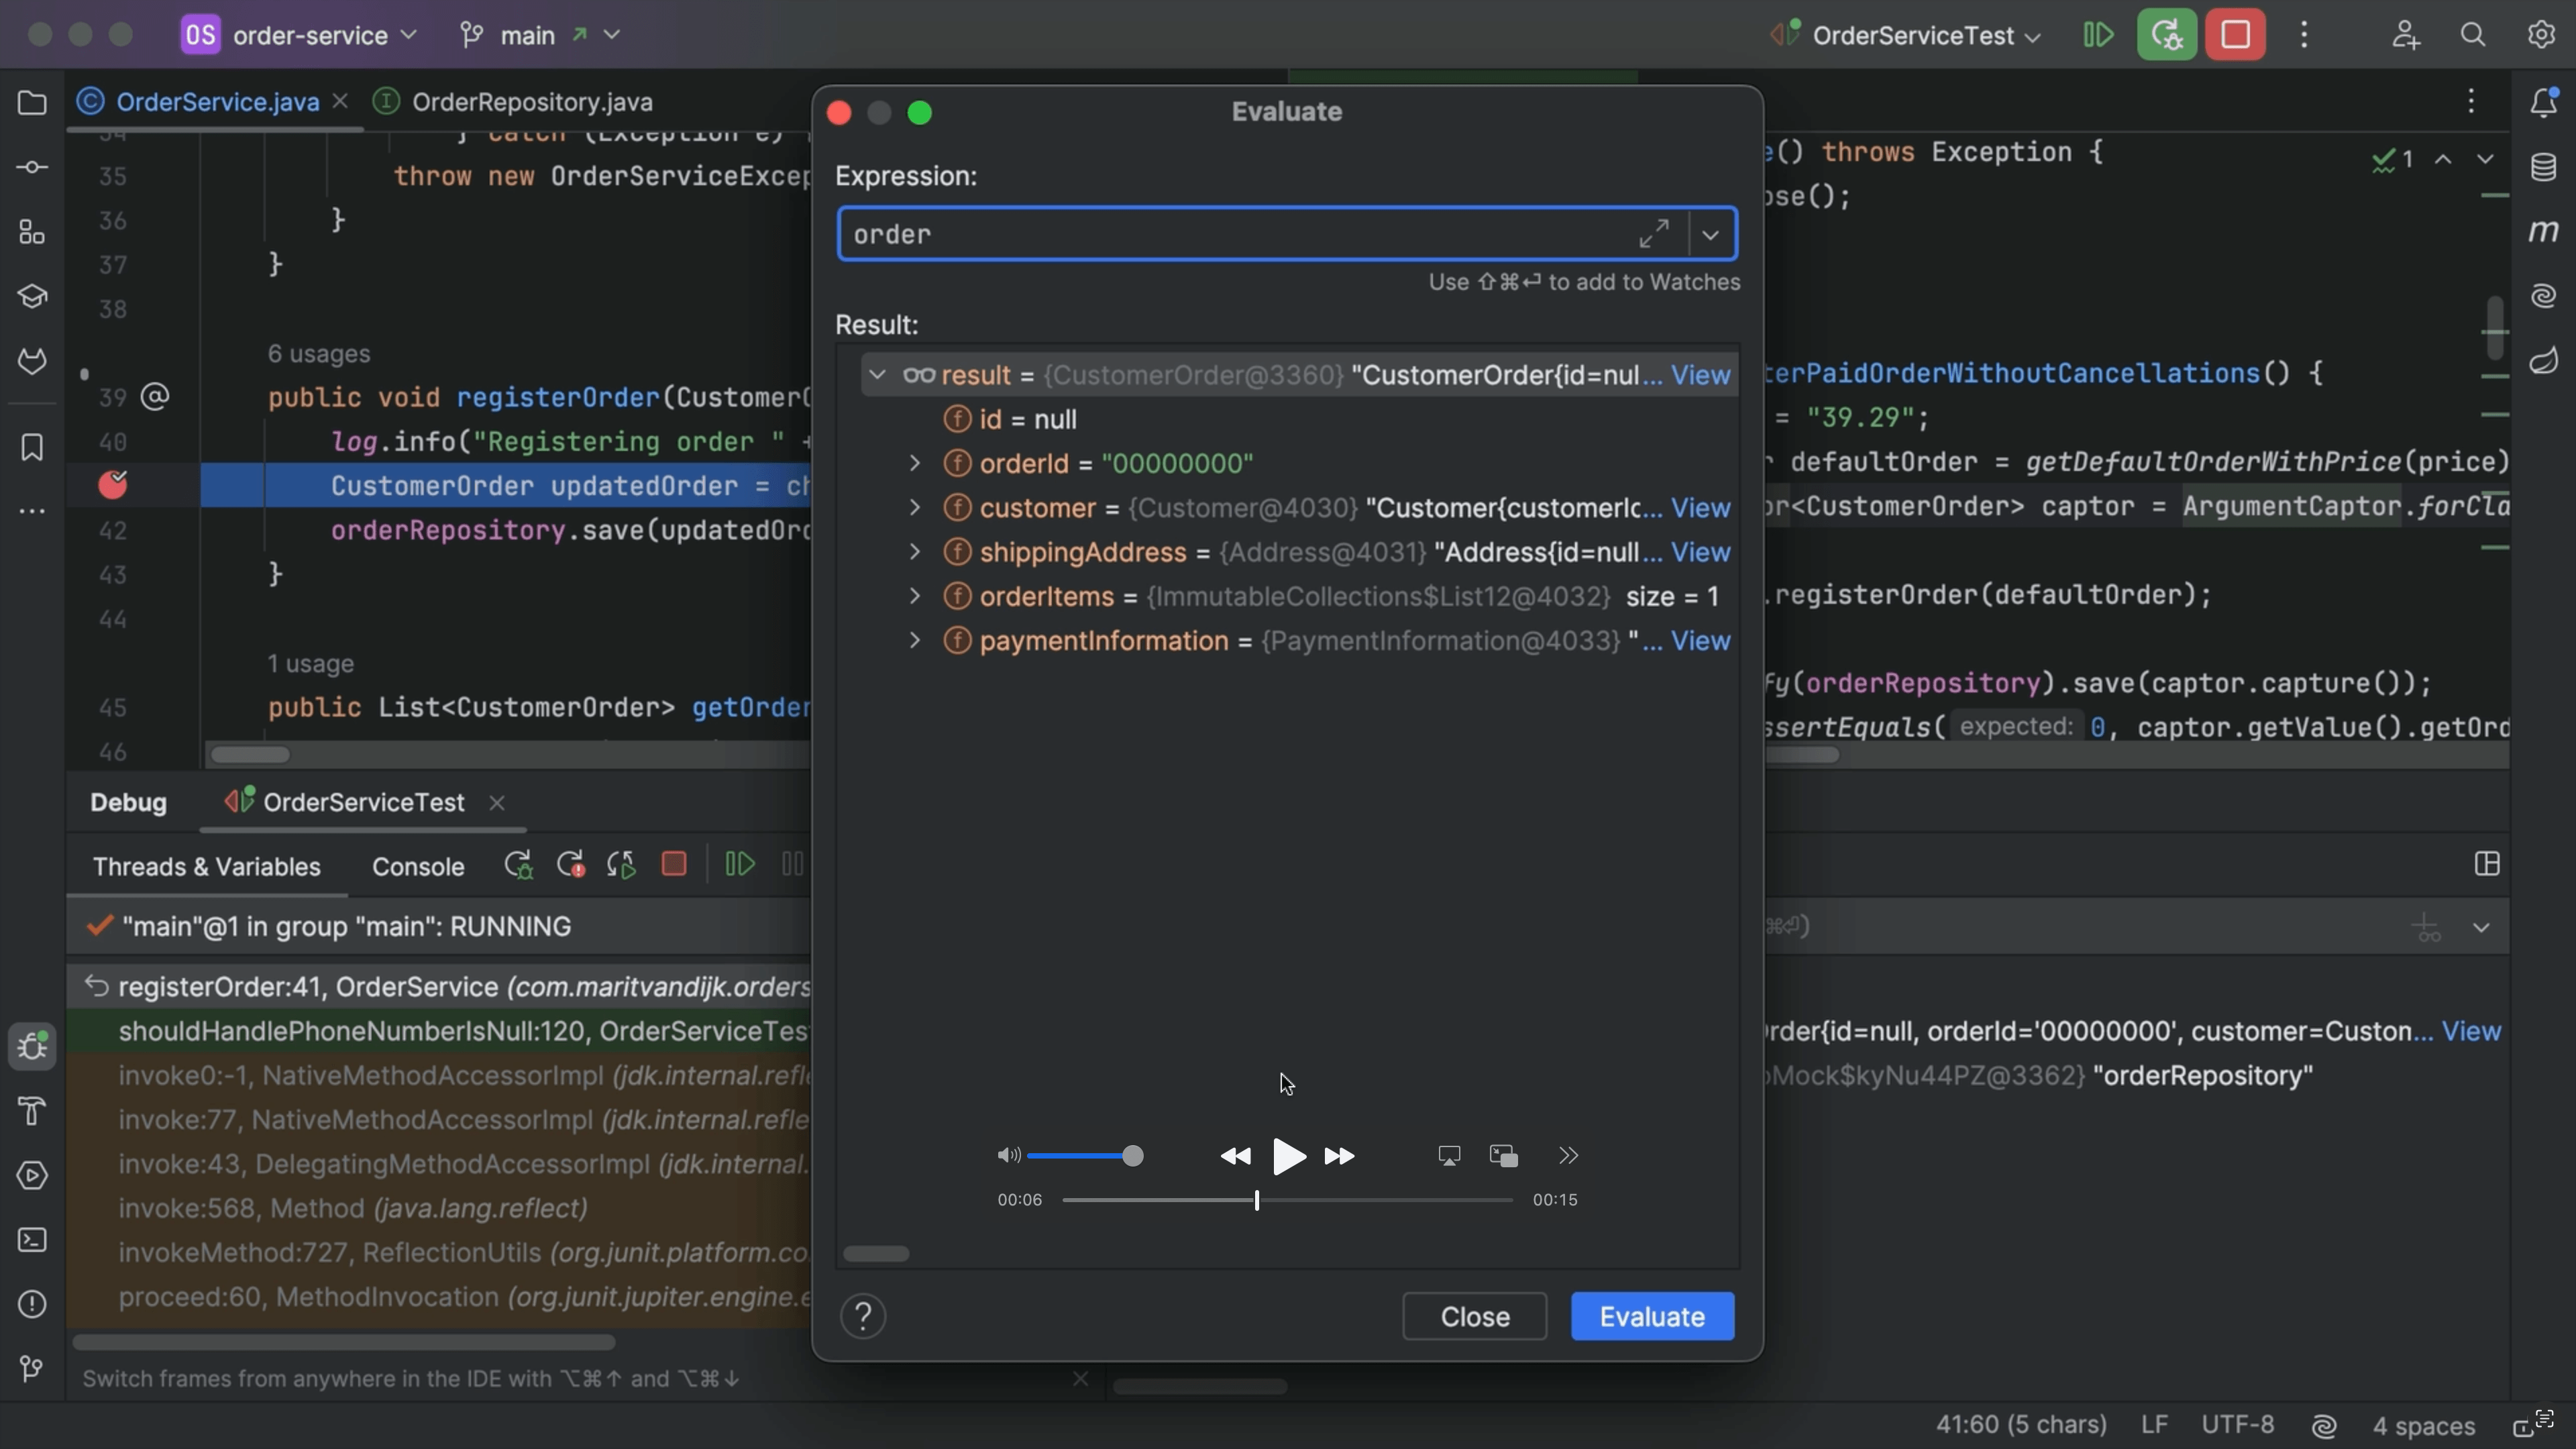
Tip
Evaluate Expression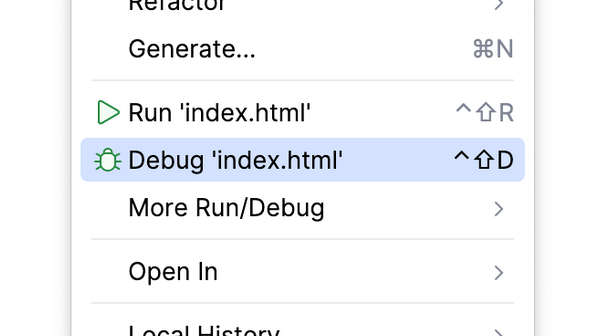
Article
Debug Like a Pro: JavaScript Edition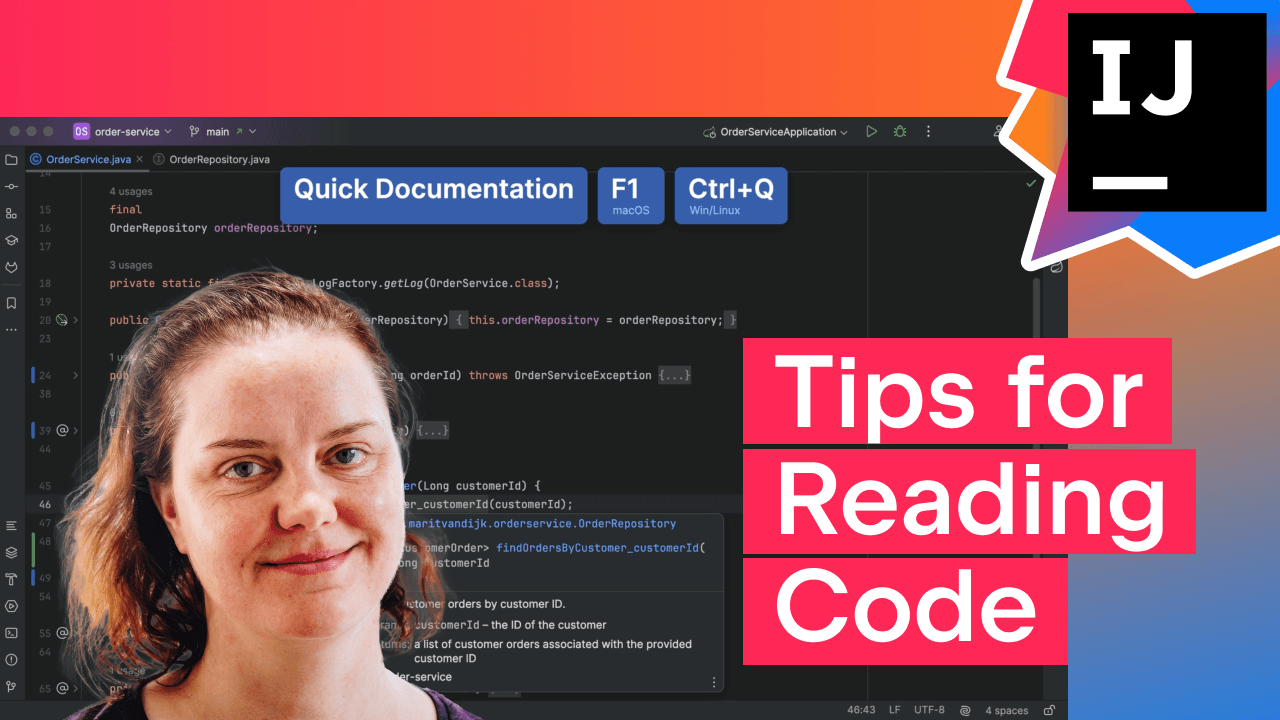


Part of tutorial
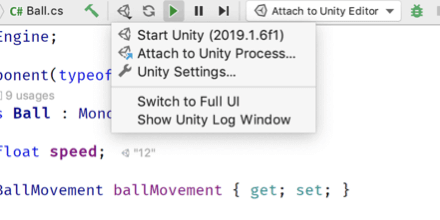
Debugging Unity games
Part of tutorial
Debugging Unreal Engine with Rider


Tip
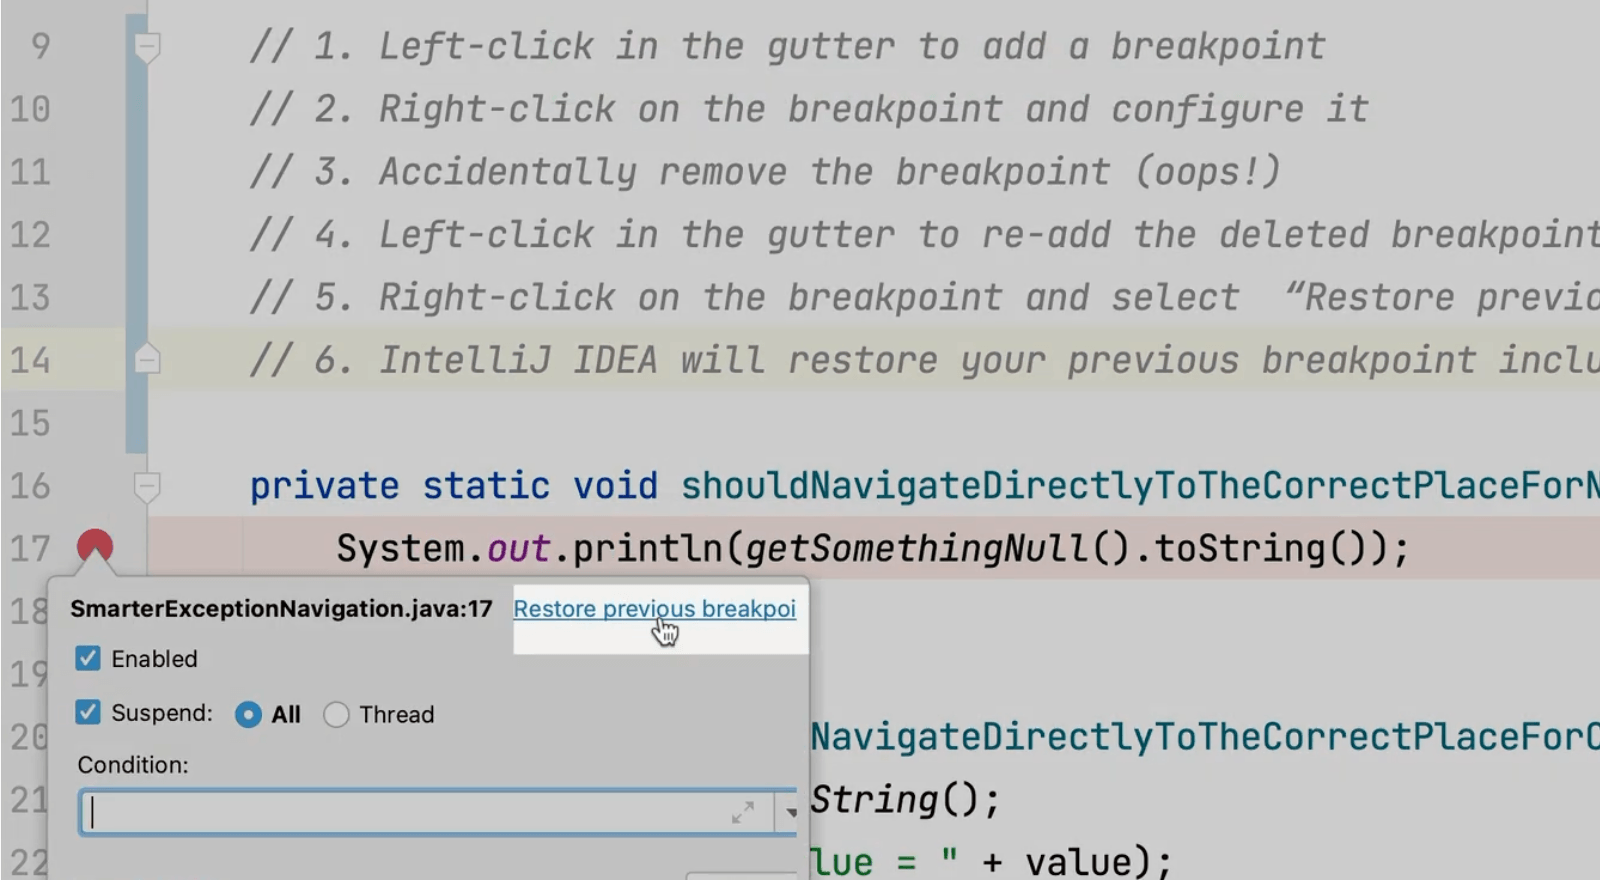
Restore a Deleted Breakpoint

Part of tutorial
Debugging Applications with ReSharper
Part of tutorial
Debugging code
Part of tutorial
Cloud (Azure) in Rider
Part of tutorial
Debugging code with Rider